

Sample Category Title
EUR/JPY Candlesticks and Ichimoku Analysis
Weekly
• Last Candlesticks pattern: Window
• Time of formation: 24 April 2017
• Trend bias: Up
Daily
• Last Candlesticks pattern: Hammer
• Time of formation: 18 May 2017
• Trend bias: Up
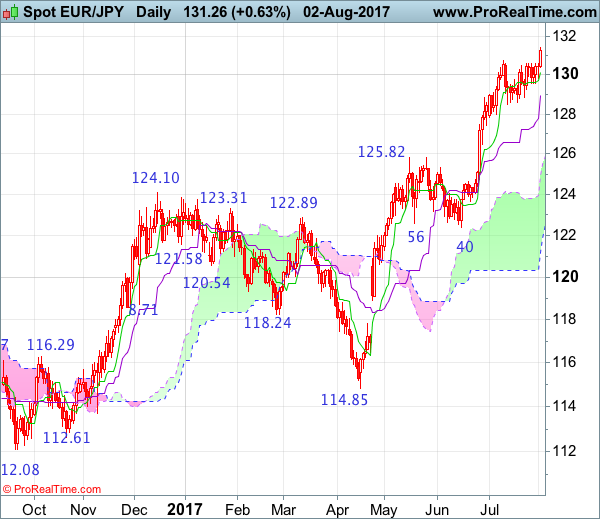
EUR/JPY – 131.26
As the single currency has continued edging higher after resuming recent upmove, suggesting medium term uptrend from 109.49 low is still in progress and may extend headway to 131.50-60, then 132.00-10, however, loss of near term upward momentum should prevent sharp move beyond previous resistance at 132.33 and reckon 133.00-10 would hold from here, risk from there has increased for a correction to take place later.
On the downside, whilst initial pullback to the Tenkan-Sen (now at 130.14) cannot be ruled out, reckon downside would be limited to 129.50-55 and support at 128.57 should hold, bring another rise later. A drop below support at 127.44 would defer and suggest a temporary top is possibly formed, bring test of 127.00, break there would add credence to this view, then retracement of recent upmove would take place for weakness to 126.50, then towards 126.00-10, however, reckon previous resistance at 125.82 would hold from here, bring rebound later.
Recommendation: Buy at 128.65 for 131.50 with stop below 127.65.
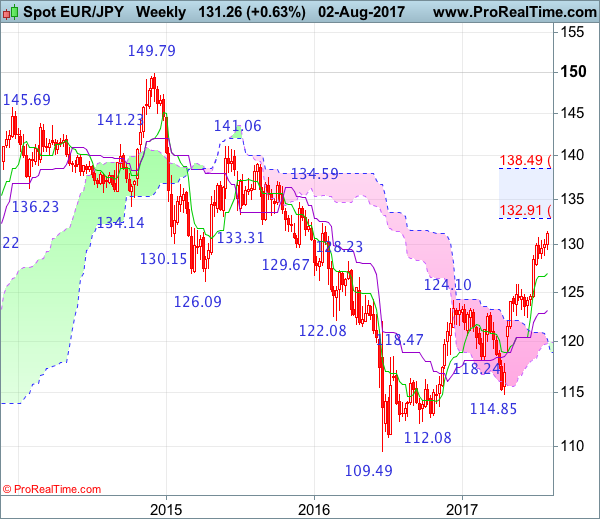
On the weekly chart, as the single currency has continued trading with a firm bias after resuming recent major upmove from 109.49 low, reinforcing our bullish view for this medium term rise to extend further gain to 131.00, then 131.50-60, however, overbought condition should limit upside to previous chart resistance at 132.33 and reckon 133.00-10 would hold from here, risk from there is seen for a retreat to take place later.
On the downside, although initial pullback to 129.50-60, then 128.90-00 cannot be ruled out, reckon 128.50-60 would limit downside and euro shall head north again from there to aforesaid upside targets. A drop below support at 127.81 would defer and risk test of the Tenkan-Sen (now at 126.59) but a weekly close below there is needed to signal a temporary top is formed, bring retracement of recent upmove to previous resistance at 125.82 (now support) but downside should be limited to 125.00 and reckon 124.00-10 would remain intact.
USD/CAD Candlesticks and Ichimoku Analysis
Weekly
• Last Candlesticks pattern: Shooting doji
• Time of formation: 01 May 2017
• Trend bias: Sideways
Daily
• Last Candlesticks pattern: Bearish engulfing
• Time of formation: 5 May 2017
• Trend bias: Down
USD/CAD – 1.2555
Although the greenback has recovered after falling to 1.2414 and consolidation above this level would be seen, reckon upside would be limited to the Kijun-Sen (now at 1.2729) and resistance at 1.2771 should hold, bring another decline later, below said support at 1.2414 would extend recent selloff to 1.2400, then 1.2350-60, however, oversold condition should limit downside to 1.2300 and price should stay well above 1.2240-50, risk from there has increased for a rebound to take place later.
On the upside, whilst initial recovery to 1.2620-25, then the Kijun-Sen (now at 1.2729) cannot be ruled out, reckon resistance at 1.2771 would limit upside and bring another decline later. Above previous support at 1.2859 (now resistance) would defer and suggest a temporary low is formed instead, bring a stronger rebound to 1.2900-05, however, still reckon upside would be limited to 1.2940-45 and price should falter below resistance at 1.3015.
Recommendation: Sell at 1.2700 for 1.2400 with stop above 1.2800.

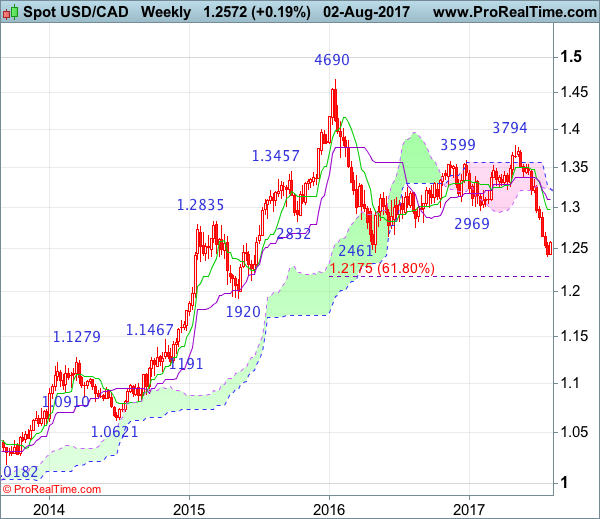
On the weekly chart, as the greenback found support at 1.2414 and has recovered, a white candlestick looks set to be formed this week, hence consolidation with mild upside bias is seen for retracement of recent decline to 1.2700-05, however, reckon upside would be limited to 1.2770-75 and price should falter below 1.2800-05 and bring another decline later. Below 1.2414 would signal medium term fall from 1.4690 top has resumed and extend weakness to 1.2300-10 but near term oversold condition should prevent sharp fall below 1.2240-50 and price should stay above 1.2175 (61.8% Fibonacci retracement of 1.0621-1.4690), risk from there has increased for a rebound later.
On the upside, although initial recovery to 1.2700-05 cannot be ruled out, reckon upside would be limited to 1.2771 resistance and bring another decline later. Above previous support at 1.2589 (now resistance) would suggest a temporary low is possibly formed, bring a stronger rebound to 1.2900, then towards resistance at 1.2944, however, reckon the Tenkan-Sen (now at 1.2978) would hold. Only a weekly close above the Tenkan-Sen (now at 1.2978) would shift risk to upside for a strong rebound to to 1.3015 resistance, then 1.3050-60 but price should falter below the Kijun-Sen (now at 1.3104) and bring another selloff in late Q3.
RBA Lowers Australia’s Growth Forecast, Cites Currency Strength
For the 24 hours to 23:00 GMT, the AUD slightly declined against the USD and closed at 0.7957.
LME Copper prices declined 0.2% or $10.0/MT to $6290.0/MT. Aluminium prices declined 0.7% or $12.5/MT to $1891.5/MT.
In the Asian session, at GMT0300, the pair is trading at 0.7958, with the AUD trading marginally higher against the USD from yesterday's close.
Earlier today, the Reserve Bank of Australia (RBA) trimmed Australia's economic growth forecast by half a percentage point for 2017 to 2.0-3.0%, citing the impact of a stronger Australian dollar on economic growth. However, the central bank reiterated its expectation that the economy would grow at an annual rate of about 3.0% over the next couple of years. The RBA left its outlook on average underlying inflation unchanged for the year ended December at 1.5-2.5%, later picking up to 2.0-3.0% by June 2019.
On the macro front, Australia's seasonally adjusted retail sales climbed 0.3% on a monthly basis in June, compared to an advance of 0.6% in the prior month, while market expectation was for retail sales to rise 0.2%.
The pair is expected to find support at 0.7927, and a fall through could take it to the next support level of 0.7896. The pair is expected to find its first resistance at 0.7977, and a rise through could take it to the next resistance level of 0.7996.
The currency pair is trading above its 20 Hr moving average and showing convergence with its 50 Hr moving average.

Euro-Zone’s Retail Sales Surprised With An Unexpected Rise In June
For the 24 hours to 23:00 GMT, the EUR rose 0.24% against the USD and closed at 1.1878, boosted by better-than-expected retail sales data from the Euro-bloc.
The Euro-zone's seasonally adjusted retail sales unexpectedly advanced 0.5% on a monthly basis in June, suggesting that households ramped-up spending amid optimism that the region's economy is on a stronger growth path. Retail sales registered a rise of 0.4% in the previous month, while markets were expecting it to record a flat reading. Meanwhile, the region's final Markit services PMI remained unchanged at a level of 55.4 in July, in line with the flash estimates.
Separately, Germany's services sector activity fell more than initially estimated to a level of 53.1 in July, compared to a preliminary print that had indicated a drop to a level of 53.5. In the previous month, the PMI had recorded a reading of 54.0.
The greenback lost ground against a basket of major currencies, following worse-than-expected US ISM non-manufacturing data.
The US ISM non-manufacturing PMI declined more-than-expected to a level of 53.9 in July, dipping to an eleven-month low level, thus highlighting a loss of momentum in the nation's dominant services sector. Markets had expected the PMI to fall to a level of 56.9, compared to a reading of 57.4 posted in the previous month.
On the contrary, the nation's seasonally adjusted initial jobless claims fell more-than-anticipated to a level of 240.0K in the week ended 29 July, pointing to a healthier labour market, compared to market expectations of a drop to a level of 243.0K. In the prior week, initial jobless claims had recorded a revised reading of 245.0K. Further, the nation's final Markit services PMI unexpectedly rose to a level 54.7 in July, while investors had envisaged it to remain steady at a level of 54.2 registered in the preliminary figures. In the previous month, the PMI had recorded a reading of 54.2.
Another set of data revealed that final durable goods orders in the US climbed 6.4% in June, revised from a flash print indicating a gain of 6.5%. Durable goods orders had fallen by a revised 0.1% in the previous month. Moreover, the nation's factory orders rebounded 3.0% in June, meeting market expectations. In the prior month, factory orders had dropped by a revised 0.3%.
In the Asian session, at GMT0300, the pair is trading at 1.1876, with the EUR trading slightly lower against the USD from yesterday's close.
The pair is expected to find support at 1.1840, and a fall through could take it to the next support level of 1.1805. The pair is expected to find its first resistance at 1.1902, and a rise through could take it to the next resistance level of 1.1929.
Moving ahead, investors will keep a close watch on Germany's factory orders for June, slated to release in a while. Later in the day, all eyes will be on the crucial US non-farm payrolls and unemployment rate data, both for July, followed by the nation's trade balance figures for June.
The currency pair is trading above its 20 Hr and 50 Hr moving averages.

BoE Opted To Leave Benchmark Interest Rate Steady, Lowered UK’s Growth Forecast
For the 24 hours to 23:00 GMT, the GBP declined 0.6% against the USD and closed at 1.3142, after the Bank of England (BoE) downgraded UK's economic growth forecast.
The BoE monetary policy committee voted 6-2 to keep its key interest rate unchanged at 0.25% and left unchanged the size of its asset purchase programme at £435.0 billion.
The central bank, its quarterly inflation report, slashed UK's economic growth forecast to 1.7% in 2017 and 1.6% in 2018, from 1.9% and 1.7% respectively, arguing that economic growth remains sluggish in the near-term as the economy has started to feel the negative effects emerging out of uncertainties of Brexit. Meanwhile, inflation is expected to peak at around 3.0% by October 2017, before gradually moderating, and falling to 2.2% by 2020.
Prior to the monetary policy decision, Pound was boosted by robust UK Markit services PMI data that showed the nation's services sector expanded faster-than-anticipated to a level of 53.8 in July, compared to market consensus for a rise to a level of 53.6. The PMI had recorded a reading of 53.4 in the prior month.
In the Asian session, at GMT0300, the pair is trading at 1.3137, with the GBP trading a tad lower against the USD from yesterday's close.
The pair is expected to find support at 1.3078, and a fall through could take it to the next support level of 1.3018. The pair is expected to find its first resistance at 1.3232, and a rise through could take it to the next resistance level of 1.3326.
Amid no major economic releases in UK today, investors will look forward to Britain's trade balance, manufacturing as well as industrial production data, all due to release next week.
The currency pair is trading below its 20 Hr and 50 Hr moving averages.

Japanese Yen Trading On A Weaker Footing This Morning
For the 24 hours to 23:00 GMT, the USD declined 0.74% against the JPY and closed at 109.95.
In the Asian session, at GMT0300, the pair is trading at 110.17, with the USD trading 0.2% higher against the JPY from yesterday's close.
The pair is expected to find support at 109.76, and a fall through could take it to the next support level of 109.36. The pair is expected to find its first resistance at 110.66, and a rise through could take it to the next resistance level of 111.16.
Next week, traders will eye Japan's trade balance figures and Eco-Watchers survey data.
The currency pair is showing convergence with its 20 Hr moving average and trading below its 50 Hr moving average.

Swiss Franc Trading A Tad Lower In The Asian Session
For the 24 hours to 23:00 GMT, the USD declined 0.29% against the CHF and closed at 0.9679.
In the Asian session, at GMT0300, the pair is trading at 0.968, with the USD trading marginally higher against the CHF from yesterday’s close.
The pair is expected to find support at 0.9662, and a fall through could take it to the next support level of 0.9645. The pair is expected to find its first resistance at 0.9707, and a rise through could take it to the next resistance level of 0.9735.
With no macroeconomic releases in Switzerland today, market participants will focus on Switzerland’s inflation and jobs report, set to release next week.
The currency pair is trading below its 20 Hr and 50 Hr moving averages.

Loonie Trading Marginally Lower, Ahead Of Canada’s Jobs Data
For the 24 hours to 23:00 GMT, the USD marginally rose against the CAD and closed at 1.2572.
In the Asian session, at GMT0300, the pair is trading at 1.2575, with the USD trading a tad higher against the CAD from yesterday's close.
The pair is expected to find support at 1.2546, and a fall through could take it to the next support level of 1.2516. The pair is expected to find its first resistance at 1.2612, and a rise through could take it to the next resistance level of 1.2648.
Ahead in the day, traders will closely monitor Canada's unemployment rate data for July, to gauge strength in the nation's labour market.
The currency pair is showing convergence with its 20 Hr and 50 Hr moving averages.

Elliott Wave View: USDCAD Correction Ended
Short term USDCAD Elliott Wave view suggests the decline to 1.2411 ended Intermediate wave (3) of an Elliott Wave impulse structure from 6/2 peak. Intermediate wave (4) bounce is in progress as a flat Elliott wave structure where Minor wave A ended at 1.2576 and Minor wave B ended at 1.2416. Minor wave C is subdivided as an impulse Elliott Wave structure. Up from 1.2416 low, Minute wave ((i)) ended at 1.253 and pullback to 1.2443 ended Minute wave ((ii)). Pair then rallied in Minute wave ((iii)) ending at 1.2593 and Minute wave ((iv)) pullback ended at 1.2355. Near term, Minute wave ((v)) of C is proposed complete at 1.2619, which also complete Intermediate wave (4). While bounces stay below 1.2619, and more importantly below 1.2683, expect pair to extend lower or at least pullback in 3 waves. We don’t like buying the pair.
USDCAD 1 Hour Elliott Wave Chart
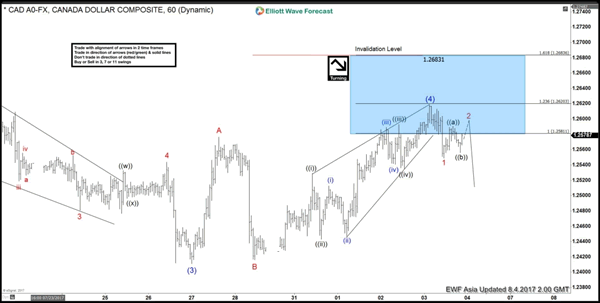
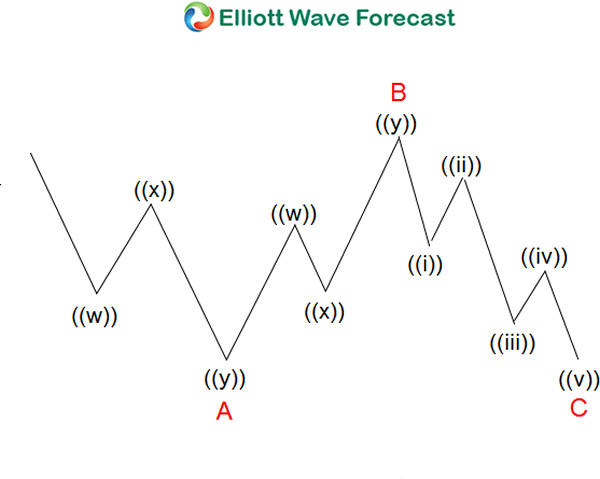
Elliott Wave FLAT structure is a 3 waves corrective pattern and there are 3 different types of Flats:
- Regular flat
- Expanded flat
- Running flat.
The flat seen in USDCAD above is the Regular flat type. A Regular flat is a 3 waves corrective pattern which could often be seen in the market nowadays. The internal subdivision of Flat is labeled as A,B,C with 3-3-5 structure. Waves A and B are subdivided in corrective structures such as zigzag, flat, double three or triple three. Third wave C is always 5 waves structure, either as a motive impulse or an ending diagonal pattern. It’s important to notice that in a Regular Flat, wave B completes slightly above the starting point of wave A. Wave B usually ends at 50%, 61.8%, 76.4%, or 85.4% of wave A and Wave C of regular flat usually ends close to 100% -1.236% Fibonacci extension of A related to B.
European Open Briefing: The US Dollar Remains Weak Ahead Of Today’s NFP Release
Global Markets:
- Asian stock markets: Nikkei down 0.35 %, Shanghai Composite gained 0.25 %, Hang Seng rose 0.15 %, ASX 200 lost 0.20 %
- Commodities: Gold at $1267 (-0.35 %), Silver at $16.65 (+0.15 %), WTI Oil at $48.94 (-0.20 %), Brent Oil at $51.90 (-0.20 %)
- Rates: US 10-year yield at 2.23, UK 10-year yield at 1.15, German 10-year yield
News & Data:
- Australia Retail Sales m/m 0.3 % vs 0.2 % expected
- Australia Retail Sales y/y 1.5 % vs 1.2 % expected
- Japan Average Cash Earnings -0.4 % vs 0.6 % expected
- Strong U.S. jobs report seen in July; wages likely rose – RTRS
- Oil prices dip on high OPEC supplies, rising U.S. production – RTRS
- Australia's central bank upbeat on economy as consumers splurge – RTRS
- Asia stocks edge higher, dollar languishes on U.S. politics, mixed data – RTRS
Markets Update:
The US Dollar remains weak ahead of today's NFP release. EUR/USD is consolidating around the 1.19 level, while USD/JPY is struggling to keep itself above 110. It is likely that volatility will remain relatively low ahead of the important data release at 13:30 London time.
The market is expecting a 183k NFP figure and a 0.1 % decline of the unemployment rate to 4.3 %. Should the data exceed expectations, the Dollar should be able to recover a bit. EUR/USD is likely to fall below 1.18 and GBP/USD back to 1.30 in such a scenario. Disappointing data would put the weak Dollar under additional pressure. EUR/USD would likely break above 1.20 in that case, while USD/JPY would decline below 110.
AUD/USD consolidated in a 0.7935-75 range overnight. While the Aussie Dollar has lost some momentum, it still remains well bid and should test 0.80 resistance soon. NZD/USD was able to bounce off 0.7390 support and recovered to 0.7450 in Asia.
Upcoming Events:
- 13:30 BST – US NFP
- 13:30 BST – US Unemployment Rate
- 13:30 BST – Canadian Unemployment Rate
- 13:30 BST – Canadian Employment Change
- 15:00 BST – Canadian Ivey PMI