
Sample Category Title
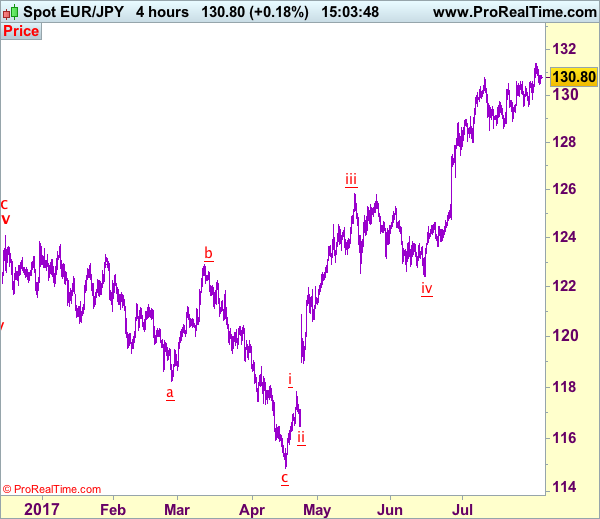
Trade Idea: EUR/JPY – Hold long entered at 130.70
EUR/JPY - 130.75
Recent wave: wave v of (C) ended at 94.12 and major correction in wave A has ended at 149.79
Trend: Near term up
Original strategy:
Bought at 130.70, Target: 132.50, Stop: 130.10
Position: - Long at 130.70
Target: - 132.50
Stop: - 130.10
New strategy :
Hold long entered at 130.70, Target: 132.50, Stop: 130.40
Position: - Long at 130.70
Target: - 132.50
Stop:- 130.40
The single currency has retreated after rising to 131.40 earlier this week, suggesting consolidation below this level would be seen, however, as long as 130.40-45 holds, bullishness remains for recent upmove to resume later, above said resistance would extend gain to 131.60, then 132.00-10, however, loss of upward momentum should prevent sharp move beyond 132.50-60 and reckon 132.90-00 would hold from here, risk from there is seen for a retreat later.
In view of this, we are holding on to our long position entered at 130.70. Below 130.40-45 would risk weakness to 130.10-15, break there would suggest top is possibly formed but below support at 129.84 is needed to add credence to this view, bring test of 129.54, below there would provide confirmation, bring correction to 129.00 first.
Our latest preferred count is that wave (ii) is ABC-X-ABC which ended at 123.33 and wave (iii) is unfolding with wave iii ended at 100.77, followed by wave iv at 111.57 and wave v as well as the wave (iii) has ended at 97.04, followed by wave (iv) at 111.43 and wave (v) has ended at 94.12 which is also the end of the larger degree v, this also implied the major wave (C) has also ended there, hence major correction has commenced from there with (A) leg unfolding in its lower degree wave c which has possibly ended at 145.69. Under this count, A-B-C wave (B) has commenced with A leg ended at 136.23, wave B at 143.79 and wave C has possibly ended at 149.79.
Our larger degree count is that the decline from 139.26 is wave (C) and is sub-divided into a diagonal triangle i-ii-iii-iv-v with wave i - 105.44, wave ii- 123.33, wave iii - 97.03, wave iv - 111.43, followed by the final wave v as well as the end of wave (C) at 94.12, this also mark the bottom of larger degree wave B. Under this count, major rise in wave C has commenced as an impulsive wave with minor wave III ended at 145.69, wave V is still in progress for further gain to 150.00. Having said that, this so-called wave V could well be the first leg of larger degree 5-waver wave C and this wave C should bring at least a retest of wave A top at 169.97 (July 2008).
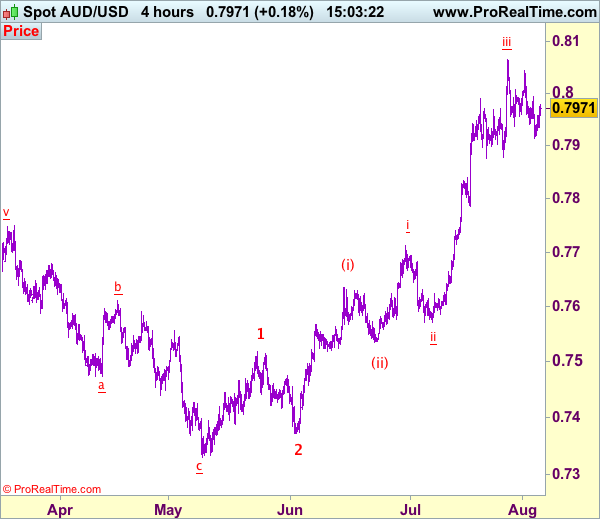
Trade Idea: AUD/USD – Hold short entered at 0.8030
AUD/USD – 0.7968
Recent wave: Wave 5 ended at 1.1081 and major correction has commenced for fall to 0.7000 and then towards 0.6500-10
Trend: Near term up
Original strategy :
Sold at 0.8030, Target: 0.7880, Stop: 0.8000
Position: - Short at 0.8030
Target: - 0.7880
Stop: - 0.8000
New strategy :
Hold short entered at 0.8030, Target: 0.7880, Stop: 0.8000
Position: - Short at 0.8030
Target: - 0.7880
Stop:- 0.8000
Although aussie has recovered after falling to 0.7914, suggesting consolidation would be seen, however, as long as resistance at 0.7993 holds, mild downside bias remains for another retreat, below said support at 0.7914 would add credence to our view that wave iii top is possibly formed at 0.8066, bring correction in wave iv to 0.7900, however, reckon previous support at 0.7875-78 would hold and renewed buying interest should emerge there, bring another rise later. Above said resistance at 0.8066 would signal recent upmove is still in progress for headway to 0.8100, then 0.8140-50 but overbought condition should limit upside to 0.8190-00, bring retreat later. We are keeping our latest bullish count that recent impulsive waves is unfolding as (1 2, (i)(ii), i ii) and may extend headway to aforesaid upside targets.
In view of this, we are holding on to our short position entered at 0.8030. A sustained breach below support at 0.7875 would defer and risk correction to 0.7810-20, however, still reckon downside would be limited to 0.7786 and price should stay well above wave i top at 0.7712.
On the 4-hour chart, the move from 0.8066 is the wave 5 with i: 0.8860, ii: 0.8315, wave iii is an extended move ended at 1.0183, iv: 0.9706 and wave v has ended at 1.1081 (also the top of entire wave 5). The subsequent selloff is the major correction which is unfolding as ABC-X-ABC and 2nd A leg has ended at 0.8848, followed by a-b-c wave B which ended at 0.9758, hence, 2nd C wave is now in progress and indicated downside target at 0.7000 and 0.6950 had been met, so further fall to 0.6710-20 cannot be ruled out.
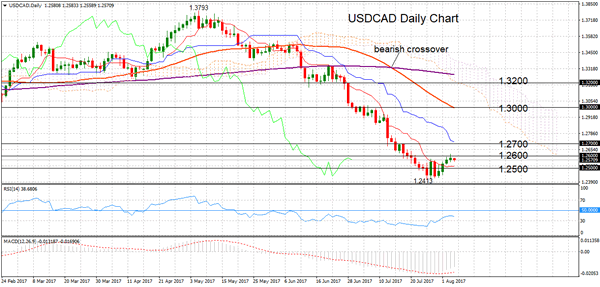
USDCAD Stalls Rally To 2-Week High, Overall Bearish Market Structure Intact
USDCAD bounced to a two-week high of 1.2618 after rising for four consecutive days from a multi-year low below 1.2500.
Momentum signals are shifting from bearish to neutral, suggesting a weakening in downside pressure. RSI has moved out of oversold territory to rise above 30 while MACD has flattened out and is no longer sloping down.
The market was unable to record a daily close above the key psychological 1.2600 level yesterday. This is now a strong resistance level. Breaking above this could see gains towards 1.2700, another important level that was tested in the past. However, prices would need to rise to the 1.3200 handle to weaken the overall bearish market structure on the daily chart.
The technical structure remains bearish since USDCAD is below the daily Ichimoku cloud while the Tenkan-sen and Kijun-sen lines are negatively aligned. Also highlighting the bearish outlook was the crossover of the 50-day moving average below the 200-day MA on July 13.
A rounded low may be developing at just below the 1.2500 level and this may keep the market from extending lower in the near-term but bearish momentum could pick up again if USDCAD breaks support at 1.2500 and falls past the July 27 low at 1.2413. Such a move would accelerate a deeper decline towards the next major trough in the 1.2100 area.
Consolidation is expected in the 1.2500 handle in the near-term. The overall bearish market structure remains intact with no clear signals of a reversal in the underlying trend.
Bank Of England Lowers UK Growth Forecast
The Bank of England kept rates at their record low on Thursday, following their latest Monetary Policy Committee meeting. However, the BoE cut forecasts for growth and wages, as Brexit weighs on the UK economy. The BoE expects the UK economy to grow by 1.7% this year (in May the forecast was 1.9%), 1.6% (from 1.7% forecast in May) in 2018 and 1.8% in 2019. This pessimistic outlook for the next 2 years has reduced market expectations of any imminent hike in UK rates. However, Bank of England Governor Carney suggested there is scope to potentially hike rates at least once next year.
Following this grim outlook for the UK, GBP gave up recent gains against both USD & EUR. GBPUSD lost 1.56 cents falling from 1.3268 to 1.3112 on the day. EURGBP climbed from 0.89234 to a high, not seen since October of 2016, of 0.90483 on the day.
In the US, reports are that Special Counsel Robert Mueller has issued grand jury subpoenas in his investigation of alleged Russian interference in the 2016 U.S. elections, adding to an already unsteady US political landscape. Market attention now turns to todays, always impactful, US Nonfarm Payroll and Unemployment data, with many hoping to see a sustained improvement in payrolls and a steady, or reducing, unemployment rate that may help improve the economic outlook for the US.
EURUSD gained on the day, on the back of lackluster US PMI and Factory Orders, to trade up to 1.18926. Currently, EURUSD is trading around 1.1880.
USDJPY, reacting to the latest US data, was 0.6% lower on the day to trade as low as 109.946. Currently, USDJPY is trading around 110.10.
GBP suffered against USD & EUR, following a pessimistic economic outlook from the Bank of England, losing 0.7% on the day against USD and 0.8% against EUR. Currently, GBPUSD is trading around 1.3145 and EURGBP around 0.9040.
Gold saw a modest gain of 0.25% on Thursday and currently trades around $1,269.50.
Recent modest US inventory drawdowns kept demand relatively strong for Oil, although continued high production is impeding further gains. WTI is currently trading around $49.00pb.
At 13:30 BST, the US Department of Labor releases Nonfarm Payrolls & the Unemployment Rate for July. June witnessed a significant rebound in NFP, with 222,000 new positions added, and unemployment remaining at 4.4%. This release is expected to be lower, at 183,000, which is still a strong enough figure to absorb new entrants into the labour market and potentially push the unemployment rate to 4.3%, from the previous release of 4.4%. While we can expect market volatility following this week’s release, many will be looking to see if hourly earnings are growing, as June saw 2.5% and July is expected to remain the same. Without an increase in hourly earnings the markets do not expect consumer spending to gather pace, which would likely fuel upward inflationary pressure and consequently provide the Federal Reserve with more grounds to hike rates before the end of the year.
At the same time as NFP Statistics, Canada will release Canadian Unemployment Rate & the Net Change in Employment for July. Consensus calls for the unemployment rate to remain at 6.5% with the Net Change in Employment expected at 10K. Whilst any positive number is good for CAD, this release is significantly lower than the previous release of 45.3K. Regardless, the Canadian economy is benefitting from a strong employment market and recent healthy economic indicators.
Market Update – Asian Session: RBA Reiterates Concerns About Gains In The Aussie
Asia Summary
Asian equity markets are currently trading mixed, in line with what was seen during the New York session. Overall markets have traded cautiously ahead of the later release of US monthly employment data and quarterly earnings out of auto giant Toyota.
In Singapore, shares of large banking name DBS have declined by over 1.5% after its quarterly profits missed expectations.
The Reserve Bank of Australia (RBA) issued its quarterly monetary policy statement in which it lowered its 2017 GDP growth forecast, but kept underlying inflation forecasts unchanged. The central bank also reiterated its concerns about the recent gains in the Australian dollar, after it suggested in its Aug 1st policy decision that the gains in the Aussie could impact growth and inflation.
Key economic data
(AU) AUSTRALIA JUNE RETAIL SALES M/M: 0.3% V 0.2%E; Q/Q: 1.5% V 1.2%E
(AU) RBA QUARTERLY STATEMENT ON MONETARY POLICY: REITERATES RECENT AUD (A$) RISE HAD MODEST EFFECT ON GDP FORECASTS
(JP) JAPAN JUNE LABOR CASH EARNINGS Y/Y: -0.4% V 0.5%E; REAL CASH EARNINGS Y/Y: -0.8% V 0.1%E
(PH) PHILIPPINES JULY CPI M/M: 0.3% V 0.2%E; Y/Y: 2.8% V 2.8%E; Core Y/Y: 2.1% v 2.7%e
Speakers and Press
Japan
(JP) Former BoJ Official Kiuchi: Hope other members consider 'serious' policy side effect; may reach limit of JGB purchases in middle of 2018
(JP) Japan Economic Revitalization Minister Motegi: Reiterates to maintain FY2020 primary balance surplus goal
Asian Equity Indices/Futures (00:30ET)
Nikkei -0.3%, Hang Seng +0.1%, Shanghai Composite +0.2%, ASX200 -0.3%, Kospi +0.2%
Equity Futures: S&P500 flat ; Nasdaq flat , Dax flat , FTSE100 flat
FX ranges/Commodities/Fixed Income (00:30ET)
EUR 1.1869-1.1888; JPY 109.85-110.19; AUD 0.7934-0.7975; NZD 0.7423-0.7450
Aug Gold -0.4% at 1,267/oz; Aug Crude Oil -0.4% at $48.86/brl; Sept Copper +0.3% at $2.89/lb
GLD SPDR Gold Trust ETF daily holdings unchanged at 791.9 metric tons
(AU) Australia sells A$500M in 1.75% Nov 2020 bonds, avg yield 1.9447%, bid to cover 5.04x
(CN) PBOC SETS YUAN REFERENCE RATE AT: 6.7132 V 6.7211 PRIOR
(CN) China PBOC OMO injects CNY120B in 7 and 14-day reverse repos v CNY60B in 7-day reverse repo prior
Equities notable movers
Australia
Sims Metal Management, SGM.AU Announces succession plan for CEO and CFO, along with FY17 guidance; -12.7%
Commonwealth Bank, CBA.AU Austrac initiated civil penalty proceedings related to anti-money laundering and counter-terrorism financing laws
Crown Ltd, CWN.AU FY17 profits below estimates; -2%
Tabcorp, TAH.AU Reported FY17 results; +1.3%
Hong Kong/China
CK Hutchsion Holdings, 1.HK H1 Profits below estimates; -4.5%
Japan
Mazda, 7261.JP Speculated capital tie-up with Toyota; +4.5%
US markets on close: Dow flat, S&P500 -0.2%, Nasdaq -0.4%, Russell -0.6%
Best Sector in S&P500: Utilities, Industrials +0.5%
Worst Sector in S&P500: Energy -1.4%
At the close: VIX 10.44 (+0.16 pts); Treasuries: 2-yr 1.34% (-2bps), 10-yr 2.22% (-5bps), 30-yr 2.79% (-6bps)
US Market Summary
Blue chips continued to hit higher ground, with the Dow marking a new all-time high again at 22,040 before trading lower towards day end. Apple and Amazon both lost nearly 1%, putting the most pressure on the S&P. Attention shifts to tomorrow's jobs data. Yesterday's lower than expected ADP weekly increase reduced forecasts for tomorrow's NFP data, with consensus at +178k.
US Afterhours Movers
After Market Movers
GPRO Reports Q2 -$0.09 v -$0.26e, Rev $296.5M v $271Me; Guides Q3 R$290-310M v $279Me, Gross Margin 36-38% range; +16% afterhours
YELP Reports Q2 $0.25 v $0.20e, Rev $208.9M v $205Me; authorizes $200M share buyback; +14.8% afterhours
WTW Reports Q2 $0.67 v $0.50e, Rev $341M v $334Me; Raises FY17 $1.57-1.67 v $1.28e (prior FY17 $1.40-1.50); +14.3% afterhours
MDRX Reports Q2 $0.15 v $0.15e, Rev $428M v $424Me; Raises FY17 R$1.79-1.82B v 1.72Be; +12.2% afterhours
FLR Reports Q2 -$0.17* v $0.59e, Rev $4.70B v $4.94Be; -9.0% afterhours
SYNA Reports Q4 $1.18 v $1.16e, Rev $426.5M v $427Me; Guides Q1 Rev $380-420M v 447Me; -14.6% afterhours
PI Reports Q2 $0.06 v $0.03e, Rev $34.1M v $33.9Me; Guides Q3 -$0.08 to -$0.01 v $0.08e, R$31.8-33.3M v $38Me, Adj EBITDA -$1.7M to -$0.2M ; -23.3% afterhours
AAOI Reports Q2 $1.54 v $1.35e, Rev $117.4M v $116Me; Guides Q3 $1.30-1.43 v $1.36e; R$107-115M v $123Me; Sees softer than expected demand for 40G solutions with a large customer; -29.3% afterhours
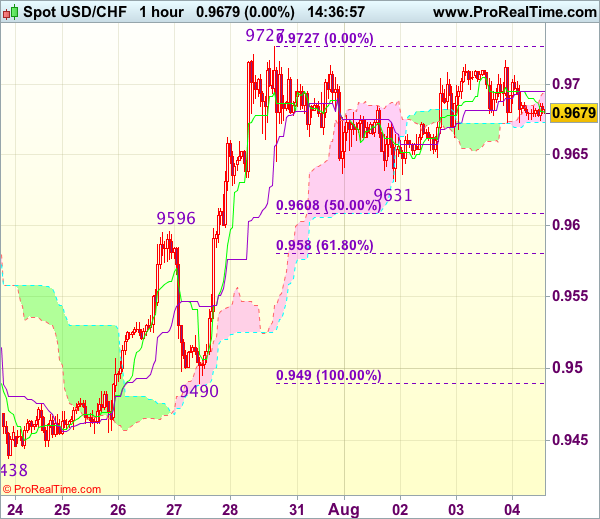
Trade Idea : USD/CHF – Buy at 0.9600
USD/CHF - 0.9682
Most recent candlesticks pattern : N/A
Trend : Near term up
Tenkan-Sen level : 0.9680
Kijun-Sen level : 0.9695
Ichimoku cloud top : 0.9693
Ichimoku cloud bottom : 0.9673
Original strategy :
Buy at 0.9600, Target: 0.9700, Stop: 0.9565
Position : -
Target : -
Stop : -
New strategy :
Buy at 0.9600, Target: 0.9700, Stop: 0.9565
Position : -
Target : -
Stop : -
As the greenback has eased after faltering below indicated resistance at 0.9727, retaining our view that further consolidation below this level would be seen and risk of another retreat to 0.9655-50 cannot be ruled out, however, reckon downside would be limited to 0.9596 (previous resistance turned support) and bring another rise later. A break of indicated resistance at 0.9727 is needed to signal recent upmove has resumed and extend gain to 0.9750-60, then 0.9780, however, near term overbought condition should limit upside to 0.9800-10, bring retreat later.
In view of this, would not chase this rise here and would be prudent to buy dollar on subsequent pullback as previous resistance at 0.9596 should turn into support and contain dollar’s downside. Below 0.9580 (61.8% Fibonacci retracement of 0.9490-0.9727) would defer and suggest a temporary top is formed instead, bring correction to 0.9540-50 but price should stay well above support at 0.9490, bring another rise later.
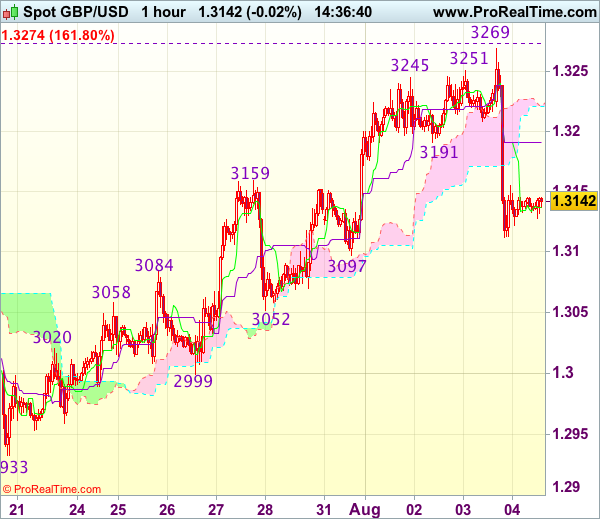
Trade Idea : GBP/USD – Stand aside
GBP/USD - 1.3141
Most recent candlesticks pattern : N/A
Trend : Near term up
Tenkan-Sen level : 1.3137
Kijun-Sen level : 1.3191
Ichimoku cloud top : 1.3222
Ichimoku cloud bottom : 1.3221
New strategy :
Stand aside
Position : -
Target : -
Stop : -
Despite yesterday’s brief rise to 1.3269, lack of follow through buying and the subsequent selloff suggests a temporary top has been formed and consolidation with downside bias is seen for test of support at 1.3097, however, break there is needed to add credence to this view, bring retracement of recent upmove to 1.3070-75 and later towards support at 1.3052 but price should stay well above support at 1.2999, bring another rise later.
In view of this, would be prudent to stand aside in the meantime. Above 1.3170-75 would bring recovery to 1.3200, however, as temporary top has been formed at 13269, reckon upside would be limited to 1.3220-30 and price should falter well below resistance at 1.3269, bring another retreat later.
US Dollar Awaits NFP Report For Next Move Vs Japanese Yen
Key Highlights
- The US Dollar remains in a downtrend against the Japanese Yen with a close below 111.00.
- There is a major descending channel with resistance near 110.40 forming on the 4-hours chart of USD/JPY.
- The US Factory orders figure for June 2017 was recently released, which posted an increase of 3% (MoM).
- Today, the US Nonfarm payrolls figure for July 2017 will be released, which is slated for 183K, against the previous 222K.
USDJPY Technical Analysis
The US Dollar started a downtrend in July 2017 from 114.50 against the Japanese Yen. The USD/JPY pair remains on the edge and awaits the US NFP report for the next move.
The pair is currently consolidating losses above the 110.00-109.80 support. There is a major descending channel with resistance near 110.40 forming on the 4-hours chart.
Above the channel resistance, there is a bearish trend line at 110.55. Furthermore, the 50% Fib retracement level of the last decline from the 110.98 high to 109.84 low is at 110.41.
Therefore, it seems like there is a major resistance forming near 110.50-60 ahead of a crucial release. Any major deviation from the market forecast could result in a significant break for USD/JPY either above 110.50 or below 109.80.
US Factory Orders
Recently, the US saw the release of the Factory orders figure for June 2017 by the US Census Bureau. The market was looking for an increase of around 2.9% compared with the previous month.
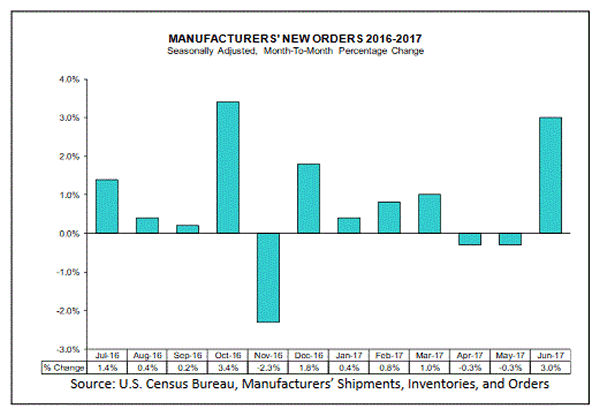
However, the outcome was better, as there was a rise of 3%. And, the last reading was revised up from -0.8% to -0.3%. The report added that:
New orders for manufactured goods in June, up following two consecutive monthly decreases, increased $14.0 billion or 3.0 percent to $481.1 billion.
Overall, the result was positive, which helped USD/JPY and the pair held the 109.80 support level.
US Nonfarm Payrolls
Today, the US nonfarm payrolls for July 2017 will be released by the US Department of Labor. The market is looking for 183K, less than the last 222K. Moreover, the US Unemployment Rate is forecasted to decline from 4.4% to 4.3% in July 2017.
If the actual result come in line with the forecast or exceeds it, the US Dollar may recover above 110.50 against the Japanese Yen. On the other hand, if it disappoints, the USD/JPY pair may decline towards 109.40.
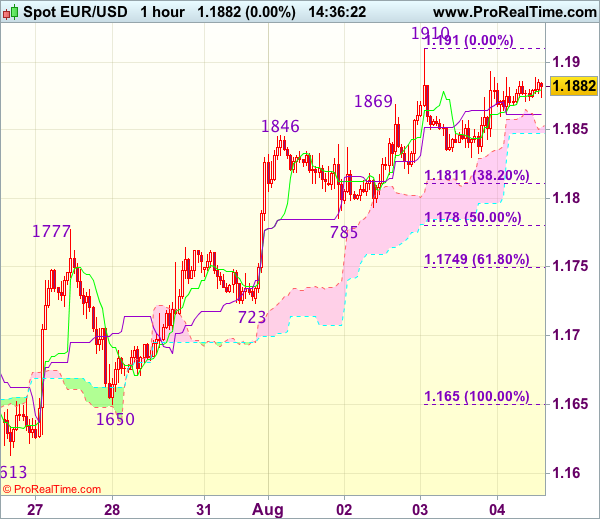
Trade Idea : EUR/USD – Hold short entered at 1.1880
EUR/USD - 1.1880
Most recent candlesticks pattern : N/A
Trend : Near term up
Tenkan-Sen level : 1.1880
Kijun-Sen level : 1.1862
Ichimoku cloud top : 1.1852
Ichimoku cloud bottom : 1.1848
Original strategy :
Sold at 1.1880, Target: 1.1780, Stop: 1.1915
Position : - Short at 1.1880
Target : - 1.1780
Stop : - 1.1915
New strategy :
Hold short entered at 1.1880, Target: 1.1780, Stop: 1.1915
Position : - Short at 1.1880
Target : - 1.1780
Stop : - 1.1915
Although the single currency has maintained a firm undertone after rebounding from 1.1830 (yesterday’s low), as long as indicated resistance at 1.1910 holds, further consolidation would take place and risk remains for another retreat, below said support at 1.1830 would bring weakness to 1.1810-15, however, break of 1.1780-85 (50% Fibonacci retracement of 1.1650-1.1910 and previous support) is needed to signal top is formed, bring retracement of recent rise to 1.1745-50 (61.8% Fibonacci retracement) but support at 1.1723 would remain intact.
In view of this, we are holding on to our short position entered at 1.1880. Above said resistance at 1.1910 would signal recent upmove is still in progress and may extend headway to 1.1940-50 and possibly towards 1.1970-75 before correction takes place.
Trade Idea : USD/JPY – Stand aside
USD/JPY - 110.09
Most recent candlesticks pattern : N/A
Trend : Near term down
Tenkan-Sen level : 110.02
Kijun-Sen level : 110.30
Ichimoku cloud top : 110.67
Ichimoku cloud bottom : 110.45
Original strategy :
Exit short entered at 110.90
Position : - Short at 110.90
Target : -
Stop : -
New strategy :
Stand aside
Position : -
Target : -
Stop : -
Although the greenback broke below previous support at 109.92 and fell to 109.85 as suggested, lack of follow through selling suggests consolidation would be seen and recovery to the Kijun-Sen (now at 110.30) cannot be ruled out, however, reckon upside would be limited to the upper Kumo (now at 110.67) and price should falter below resistance at 110.98, bring another decline later.
In view of this, would not chase this fall here and would be prudent to stand aside in the meantime. Below said support at 109.85 would signal recent selloff from 114.50 top is still in progress and may extend weakness to 109.70 but loss of downward momentum should limit downside to 109.50, risk from there has increased for a rebound to take place later.
