Sample Category Title
Struggling Dollar Awaits US Jobs Report For Potential Relief
Dollar Awaits U.S. Job Report. The dollar wallows near a 2-1/2-year low versus the euro and a 7-week trough versus the yen. After weak US ISM data U.S. dollar is awaiting the non-farm jobs report due at 1230 GMT for potential relief. Economists polled by Reuters expect U.S. employers to have added 183,000 jobs in July, down from 222,000 in June.
GBP Near 9-mnt Low Vs Euro After BoE Dovish Message. Sterling slid down after the Bank of England voted 6-2 to keep interest rates at current record lows 0.25% and lowered its forecasts for growth, inflation and wages, disappointing investors who expected more hawkish messaging.
Gold Weaker Ahead Of U.S. Jobs Report. After hitting a six-week high earlier this week gold prices ended the U.S. day session modestly lower on Thursday. Although, the present postures of the dollar index and the Euro currency are bullish for the precious metals markets, a non-farm jobs report later on this Friday is likely to shake up many markets, including gold.
How To Trade Gold Ahead Of US NFP
- US NFP would impact the gold price
- Technicals are showing some important signals
Investors have one focus, which is what the impact of the US non-farm payroll data on the Fed interest rate hike will be. The odds are very low that we are going to see another rate hike this year and this has stimulated the rally for the gold price. We are up nearly 10.6% so far this year and this is despite the fact that we have seen a few interest rate hikes this year. What really matters is the economic data and if it confirms that the economy is not facing any major threat, we think that the Fed would resume their gradual interest rate hike.
When it comes to the US NFP number, only an extreme reading on either side is going to change the Fed’s stance. An extreme reading on either side would also shake the floor for the gold price which is stuck in a tight range of $1254-1274. What would that extreme reading be? We think a number above 250K or below 100K would do the job. But remember, that is only the headline number, we have also other vitally important factors such as wage growth, average hourly earnings and the participation rate.
Technical Analysis
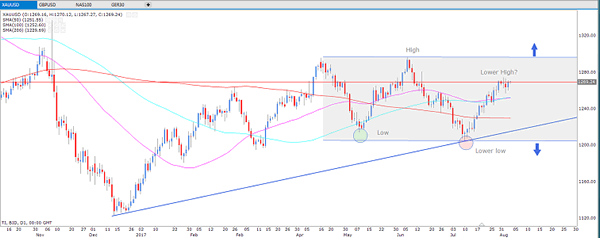
The uptrend is strong as the price is trading above the 100 and 200 day moving average – a clear signal for a strong uptrend. Moreover, we are consolidating in a sideway pattern. However, something which we need to watch out for, is that we have formed a lower low and perhaps we are in a process of forming a lower high (as shown on the chart). A break below the 200-day moving average would signal that the game is about to change and the break of the upward trend line would validate that we may have another lower low.
More Pressure Ramps Up On Trump While US NFP Takes The Stage
- Trump under deep investogation and markets are still ignoring it
- US NFP could change the Fed stance on further rate hikes
- Dollar weakness could fade away
The political shakiness in the US is hunting the US dollar as if other factors were not bad enough. Traders are gloomier about the dollar after the report that the investigation is becoming even more intense about Russia intervening in the US election. One would wonder that there must be some merit to these allegations that this investigation is keep on becoming more intense. But as this scrutiny goes deeper and deeper, the pain for the dollar bulls also becomes tougher and tougher.
But for today, the entire focus is on one data which is also called the mother of all economic data - the US non-farm payroll number. The US GDP growth during the first half of this year is 2% which is far from 3%, a number which could resolve many problems for the dollar. Moreover, the US GDP growth for the second half of this year isn't looking that enthusiastic either. A vital component of the US GDP growth is the US non-manufacturing data which has already dropped miserably on Thursday to 53.9 compared to 56.9. This does not provide a very inspiring picture
Earlier this week, the ADP number which is widely considered as the correlating indicator for the US non-farm payroll data has also produced a lousy drawing because the number underwhelmed investors. If you track the history of the correlation between the ADP and the US non-payroll number so far this year, it becomes evidently clear that there is a story behind this idea which has some life.
Once again a lot of focus will be towards the wage growth number as it commands the most amount of attention. The number has been nothing but stubborn and we need to see this number to improve as it would move traders and ask for their love again. The headline unemployment rate is expected to fall to 4.3%, nothing significant about this, especially if there is no wage growth.
If both the wage growth and participation rate see a downward number today, then it would confirm that the Fed has dug up a hole for themselves by underestimating the slack in the economy.
Nonfarm Payrolls To Drive Markets
US jobs data headline an active data wire on Friday, as markets brace for what's arguably the most closely-watched economic release of the month.
The Department of Labor will issue its nonfarm payrolls report at 12:30 GMT. Most measures of labour market health are expected to be positive, with analysts forecasting the creation of 183,000 nonfarm jobs in July. That follows a brisk 222,000 addition the previous month.
The national unemployment rate is forecast to drop 0.1 percentage point to 4.3%.
On the earnings front, average hourly wages are expected to rise 2.4% in the 12 months through July. That follows a 2.5% year-over-year gain in June.
Traders will be watching for any deviation from the consensus forecasts, especially for the headline nonfarm payrolls number. The US dollar will be especially vulnerable. The currency fell to fresh 14-month lows against a basket of currencies earlier this week.
Separately, the Commerce Department will release the latest trade figures for the month of June. Washington's trade deficit is projected to fall to $45 billion from $46.5 billion in May.
North of the border, Canada will also issue its latest employment and trade figures on Friday. Employment is forecast to rise by 10,000, following a gain of 45,300 the previous month that was much higher than forecasts. The unemployment rate is expected to hold steady at 6.5%.
Canada's international merchandise trade deficit is expected to rise to $1.35 billion in June from $1.09 billion the month before.
Oil traders will also keep track of the latest US rig-count numbers courtesy of Baker Hughes Inc. The oilfield services provider will release its weekly report at 17:00 GMT.
EUR/USD
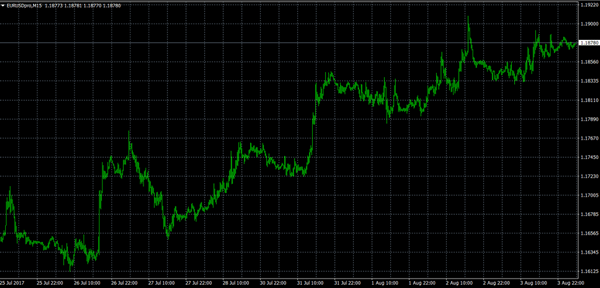
The euro will look to nonfarm payrolls for direction on Friday, but could also see action after Germany's Federal Statistical Department releases the latest factory orders report at 06:00 GMT. Factory orders are forecast to rise 0.5% in June and 4.4% annually. The EUR/USD edged up 0.1% to 1.1888 on Friday. Price broke above 1.1900 on Thursday. A close above 1.1870 should see the pair returning above the 1.1900 level.
GBP/USD
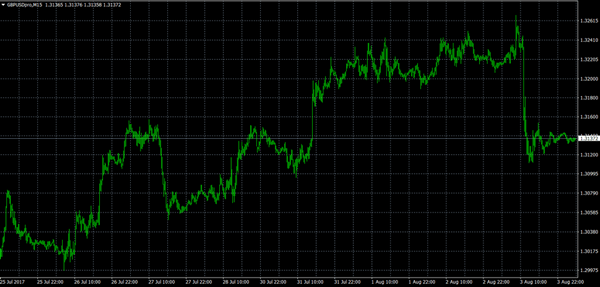
The British pound retreated from yearly highs on Thursday, as the Bank of England (BOE) rate decision undermined the bulls. Cable was last seen trading in the mid-1.31 region. The GBP/USD lost around half a percent Thursday and faces immediate support at the 10-day simple moving average (1.3124). On the opposite side of the spectrum, immediate resistance is seen at 1.3266, the high from 3 August.
USD/CAD
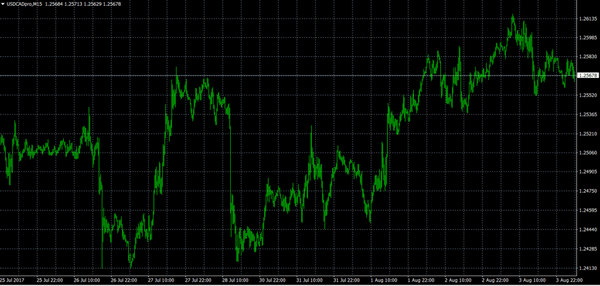
The USD/CAD spent the majority of Thursday's session trading sideways, as markets braced for monthly jobs data. The technical outlook continues to favour the Canadian dollar. The USD/CAD faces immediate support at 1.2550, followed by the psychological 1.2500 level. On the other hand, immediate resistance will likely be met at 1.2650, the high from 19 July.
EUR/JPY Daily Outlook
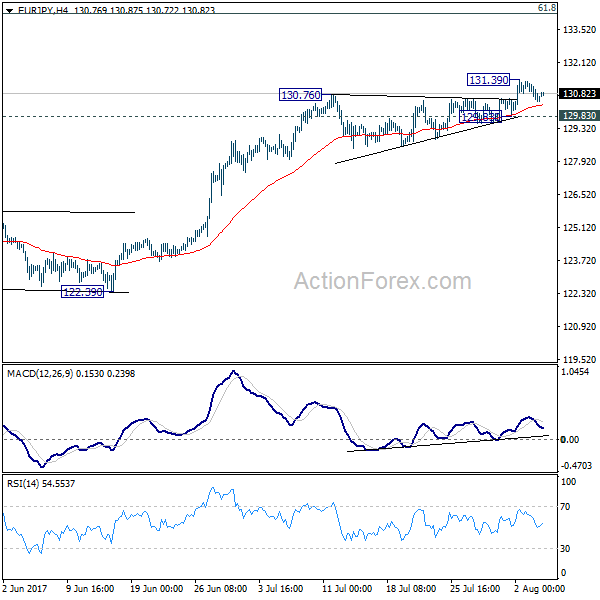
Daily Pivots: (S1) 130.26; (P) 130.79; (R1) 131.13; More...
Intraday bias in EUR/JPY is turned neutral as the cross lost momentum after hitting 131.39. On the downside, break of 129.83 support will indicate short term topping, on bearish divergence condition in 4 hour MACD. This will be supported by the wave four like triangle consolidation from 130.76 to 129.83. In that case, intraday bias will be turned back to the downside for pull back to 55 day EMA (now at 127.37). On the upside, above 131.39 will extend recent rally to long term fibonacci level at 134.20.
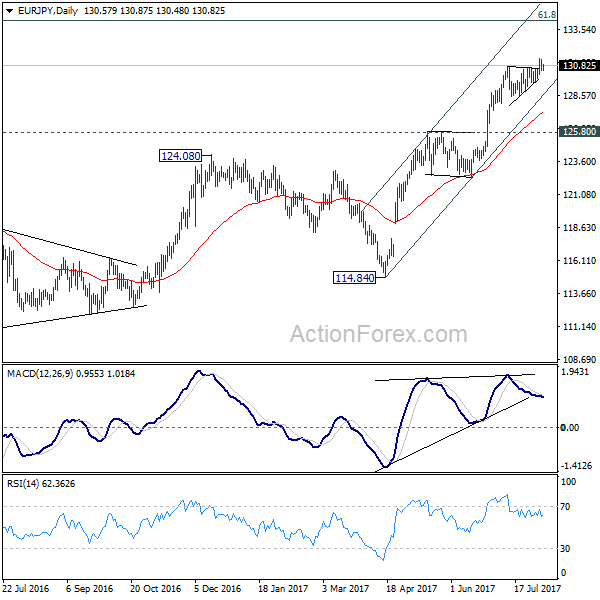
In the bigger picture, the down trend from 149.76 (2014 high) is completed at 109.03 (2016 low). Current rally from 109.03 should be at the same degree as the fall from 149.76 to 109.03. Further rise is expected to 61.8% retracement of 149.76 to 109.03 at 134.20. Sustained break there will pave the way to key long term resistance zone at 141.04/149.76. Medium term outlook will remain bullish as long as 125.80 resistance turned support holds.
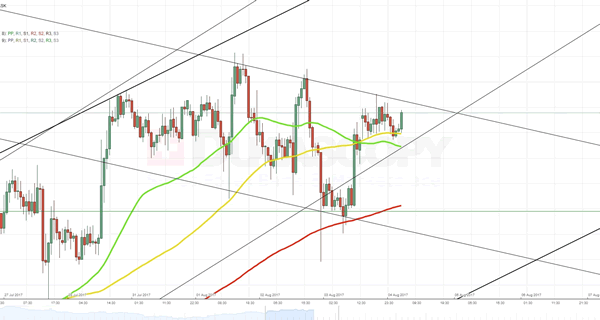
XAU/USD Analysis: Grows On Weak US Data
Yesterday the pair, indeed, made an attempt to return into preceding ascending channel. The fact the bullion managed to bypass and stay above a combination of the 55- and 100-hour SMAs is, generally, attributed to the weak US figures that were released yesterday. However, the above impulse was not enough the force the pair to soar towards the 61.8% Fibonacci retracement level. As a result, this third unsuccessful attempt points out on formation of a short-term descending channel. If this assumption is true, the pair should make a rebound somewhere between the 1,269 and 1,271 levels and slip back to the 200-hour SMA and the weekly PP at 1,261.80. However, the ultimate outcome will also heavily depend on result of the released US macroeconomic data today at 12:30 GMT.
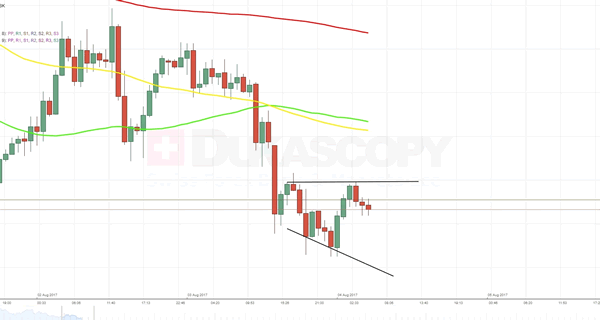
USD/JPY Analysis: Drops To 110.11
Unfortunately for the Greenback, none of the US macroeconomic data released yesterday did not justify analysts' expectations. As a result, the pair, firstly, slipped below the 55- and 100-hour SMAs and, secondly, below the weekly S1 at 110.11. However, after the second data release the currency rate became substantially oversold and, for this reason, no further drop has followed. Most probably, during Friday's trading session the buck is going to try to restore lost positions. If the pair succeeds to gain a foothold at the above weekly S1, it might obtain a necessary impulse to try to reach the 200-hour SMA near the 110.87 mark. Nevertheless, this attempt might be easily undermined by another release of a set of the US data at 12:00 GMT.
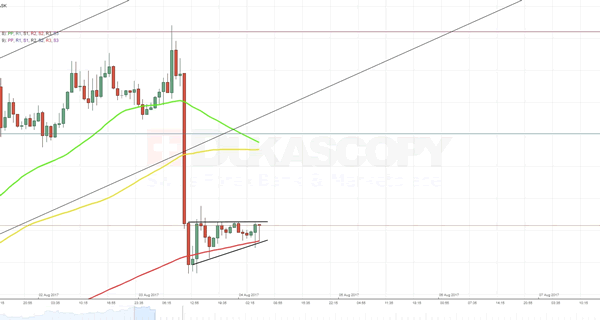
GBPUSD Analysis: Pound Loses 0.9% Against Greenback
In line with expectations, an announcement of the UK Official Bank Rate and the following Governor Carney's press-conference have heavily affected value of the given currency pair. Namely, the 94-pip depreciation of the Pound has pushed the rate out of a weekly ascending channel. The fall continued until the pair found support in the face of the 200-hour SMA near 1.3130. Shortly after that the Sterling tried to restore some of the lost positions, but failed to climb above the 1.3144 level. Today it is expected to continue to climb to the top. However, even if succeeds to overcome the above resistance, the surge should be limited by a combination of the 55- and 100-hour SMAs as well as the weekly R1. If it fails, the slide most likely will be stopped by the weekly or monthly PP near 1.3090.
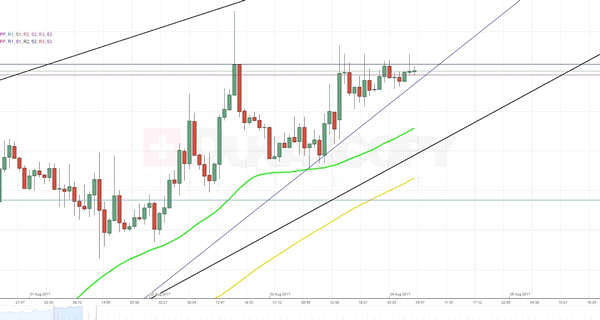
EUR/USD Analysis: Stuck At 1.1878
Second half of the previous trading session the currency exchange rate spent in an expected advance towards the closest resistance level formed by the weekly R2 at 1.1878. An especially high impulse was provided shortly after release of information on the US Non-Manufacturing PMI that did not justify experts' expectations. For the moment, it is not clear yet, whether the pair will continue the surge or fall out from the wedge. On the one hand, a four-hourly chart shows that the rate has been soaring precisely along the pattern's southern boundary. In addition, a number of technical indicators reveal that the pair has not become overbought yet. On the other hand, narrowing fluctuations of the rate more and more remind formation on an inner ascending triangle with the upper trend-line located near the 1.1883 level.
GBP/JPY Daily Outlook
Daily Pivots: (S1) 143.69; (P) 145.24; (R1) 146.11; More
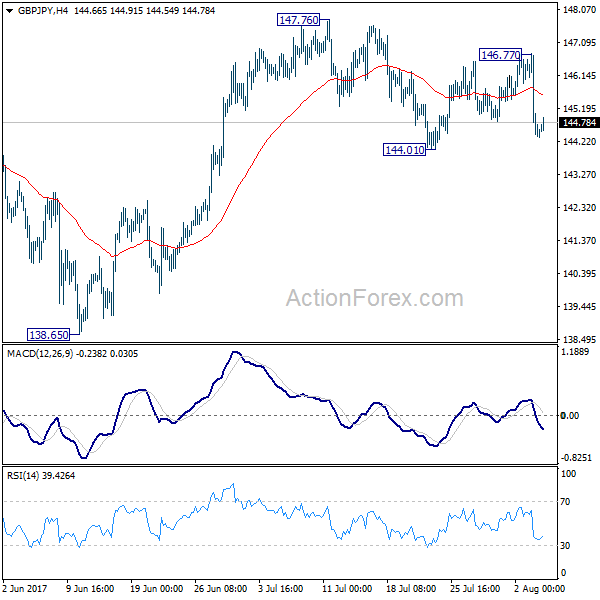
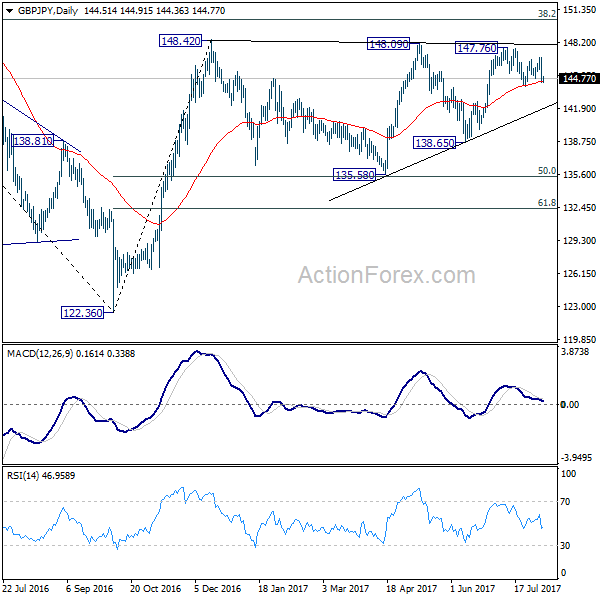
GBP/JPY drops sharply after hitting 146.77 but it's staying above 144.01 support. Intraday bias remains neutral first. On the downside, break of 144.01 will extend the sideway pattern from 148.20 with another fall back to 135.58/65 support zone. On the upside, above 146.77 will turn bias to the upside. Further break of 147.76/148.42 key resistance zone will resume larger rebound from 122.36.
In the bigger picture, rise from medium term bottom at 122.36 is expected to continue to 38.2% retracement of 196.85 to 122.36 at 150.43. Decisive break there will carry long term bullish implications and pave the way to 61.8% retracement at 167.78. In case the sideway pattern from 148.42 extends, we'd be looking for strong support from 135.58 and 50% retracement of 122.36 to 148.42 at 135.39 to contain downside.