
Sample Category Title
Trade Idea Wrap-up: USD/JPY – Sell at 112.00
USD/JPY - 111.25
Most recent candlesticks pattern : N/A
Trend : Near term down
Tenkan-Sen level : 111.54
Kijun-Sen level : 111.73
Ichimoku cloud top : 112.10
Ichimoku cloud bottom : 111.99
New strategy :
Sell at 112.00, Target: 111.00, Stop: 112.35
Position : -
Target : -
Stop : -
As the greenback has fallen gain after brief bounce above 112.00 level, adding credence to our view that recent decline from 114.50 top is still in progress and downside bias is seen for this move to extend weakness to 110.90-95 (50% projection of 114.50-111.55 measuring from 112.42), however, loss of downward momentum should prevent sharp fall below 110.60-65 (61.8% projection and previous support) and reckon 110.35 would hold from here, bring rebound later.
In view of this, would not chase this fall here and would be prudent to sell dollar on recovery as 112.08 resistance should cap upside, bring another decliner. Only break of resistance at 112.42 would abort and signal low is formed, bring retracement of recent decline towards resistance at 112.87 later.

Canadian Dollar Rallied to the Session Lows at 1.2554 Against the Greenback
Canadian dollar rallied to the session lows at 1.2554 against the greenback after data. Retail sales in Canada rose by 0.6% in May, well above expected 0.2% rise.
At the same time, inflation came along with expectation at -0.1% in June m/m, while annual inflation slowed to 1.0%, the lowest since Oct 2015, holding well below central bank's target at 2.0% .
Better than expected retail sales results supported Lonnie which remains in steep uptrend against the US dollar since early May.
Technicals remain firmly bearish for USDCAD pair and favor final push towards 1.2459 (03 May 2016 low), as descend from 1.3793 (05 May low) has nearly fully retraced 1.2459/1.3793 ascend.
Sustained break below 1.2459 would trigger significant downside and expose targets at 1.2159 (50% retracement of 0.9631/1.4688 ascend and psychological 1.2000 support in extension
Meanwhile, corrective action on strongly overextended daily studies could be anticipated ahead of 1.2459 but no firmer bullish signals being generated so far.
Falling 10SMA marks initial resistance (currently at 1.2700) ahead of descending 20SMA (1.2859).
Res: 1.2600; 1.2640; 1.2700; 1.2741
Sup: 1.2539; 1.2500; 1.2459; 1.2363
Canadian Retail Sales Continue to Rise Strongly in May
Highlights:
- Nominal retail sales in May rose a stronger than expected 0.6% following gains of 0.7% and 0.6% in April and March, respectively.
- The increase was boosted by a stronger-than-expected 2.4% surge in motor vehicles sales that more than offset gasoline station receipts dropping a smaller than expected 0.6%.
- Sales volumes rose 1.1% following a 0.2% drop in April and a 1.3% surge in March.
Our Take:
The 0.6% monthly gain in May retail sales extends the pace of solid increases to three consecutive months. This has contributed to the nominal value of sales rising a strong 7.3% over the past year and compares to the average increase in 2016 of a little over 5%. Part of this strengthening is attributable to higher energy prices that sent gasoline station receipts up by a double digit rate over the past year. However, the overall volume of May retail sales, which eliminates the impact of higher prices, is up a solid 6.4% from a year ago and compares to a 2016 average increase of 4%. This strengthening in consumer spending growth is clearly benefitting from sustained gains in employment over the first half of this year along with low financing costs.
Strength in consumer spending has been a factor contributing to overall GDP rising at an above-average pace from the third quarter of 2016 through the first quarter of this year. Partial second quarter data is indicative of this pace being sustained for a fourth consecutive quarter. This strength in growth, and seemingly easing concerns about "external impediments" such as aggressive U.S. trade protectionism, contributed to the Bank of Canada hiking the overnight rate 25 basis points to 0.75% earlier this month. Our forecast assumes that with growth continuing at an above average pace, official rates will rise a further 75 basis points by the end of 2018 to 1.50%.
Canadian Inflation Showed Some Signs of Stabilization in June
Highlights:
- The year-over-year rate of headline CPI inflation fell to its lowest level since October 2015 at 1.0%.
- Energy prices declined as the price of gasoline fell.
- Year-over-year food price growth inched back into positive territory for the first time last September.
- Excluding the food and energy components, annual price growth held steady at 1.4% marking the first time in five months the measure has not moved lower.
- Two of the Bank of Canada's three preferred core measures ticked higher but all remained below the bank's 2% inflation target
Our Take:
Price growth continued to moderate in June but with, perhaps, some early evidence of firming in underlying details. Headline CPI growth fell to its lowest level since October 2015 at 1.0% but held steady at 1.4% excluding the volatile food and energy components. That is still an admittedly very modest pace but marks the first month of the last five that the year-over-year rate of ex-food & energy prices has not moved lower. As well, two of the Bank of Canada's three preferred 'core' measures ticked higher in June although the 'CPI-Trim' measure held at a very low 1.2%.
Modest price growth continues to contrast sharply with what increasingly would otherwise look to be an economy that is operating very close to its long-run capacity. More recent comments from the Bank of Canada - including in justifying July's interest rate hike - have argued that sub-trend price growth is more a reflection of a number of transitory factors and the lagged impact of past weakness in the economy. Today's report is not likely to change that view significantly, particularly given a strong increase in the separately released May retail sales report this morning. While there is little consensus on what is behind recent slow price growth, a lack of consumer demand does not appear to be the problem. Consumer expenditures accounted for a record share of GDP last year and have continued to grow strongly over the first half of 2017.
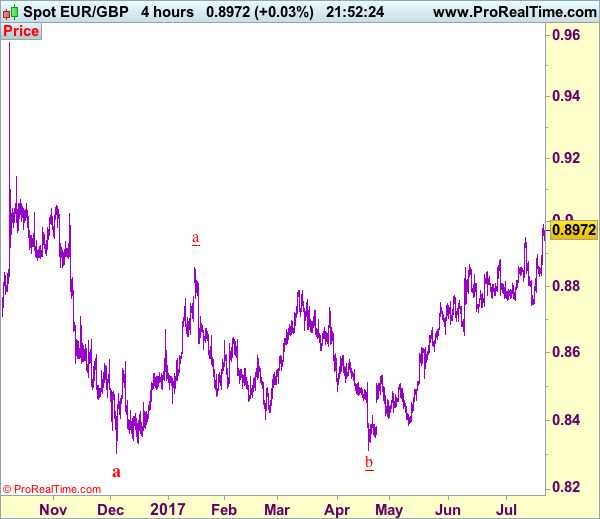
Trade Idea: EUR/GBP – Buy at 0.8915
EUR/GBP - 0.8972
Recent wave: Major double three (A)-(B)-(C)-(X)-(A)-(B)-(C) is unfolding and 2nd (A) has possibly ended at 0.6936.
Trend: Near term up
New strategy :
Buy at 0.8915, Target: 0.9015, Stop: 0.8875
Position : -
Target : -
Stop : -
As the single currency has maintained a firm undertone after breaking resistance at 0.8950, confirming our view that recent upmove has resumed and upside bias remains for test of psychological resistance at 0.9000, break there would encourage for headway to 0.9020 and possibly towards 0.9050, however, near term overbought condition should prevent sharp move beyond latter level, risk from there has increased for a retreat later.
In view of this, would not chase this rise here and would be prudent to buy euro on pullback as 0.8900-10 should limit downside. Below previous resistance at 0.8899 would defer and risk correction to 0.8870-75 but only break of support at 0.8829 would confirm top is formed instead, bring correction to 0.8800 first.
Our preferred count is that, after forming a major top at 0.9805 (wave V), (A)-(B)-(C) correction is unfolding with (A) leg ended at 0.8400 (A: 0.8637, B: 0.9491 and 5-waver C ended at 0.8400. Wave (B) has ended at 0.9413 and impulsive wave (C) has either ended at 0.8067 or may extend one more fall to 0.8000 before prospect of another rally. Current breach of indicated resistance at 0.9043 confirms our view that the (C) leg has ended and bring stronger rebound towards 0.9150/54, then towards 0.9240/50.
Trade Idea: USD/CAD – Sell at 1.2765
USD/CAD - 1.2565
Recent wave: Only wave v of c has ended at 0.9407 and wave C of major A-B-C correction is underway with wave iii ended at 1.4690, wave v of C may bring one more marginal rise probably in 2018
Trend: Down
Original strategy :
Sell at 1.2765, Target: 1.2565, Stop: 1.2825
Position: -
Target: -
Stop: -
New strategy :
Sell at 1.2765, Target: 1.2565, Stop: 1.2825
Position: -
Target: -
Stop:-
The greenback has continued trading defensively after recent selloff, adding credence to our view that recent downtrend is still in progress, we took the count that wave v as well as wave (C) ended at 1.3794 and impulsive wave (i ii, i ii) is now unfolding with minor wave iii still in progress, hence bearishness remains for this fall to extend weakness to 1.2500-10, however, oversold condition should prevent sharp fall below 1.2440-50 and reckon 1.2400 would hold, risk from there is seen for a rebound later.
In view of this, would not chase this fall here and would be prudent to sell the pair again on recovery as 1.2760-70 should limit upside. Above 1.2800-10 would defer and risk a stronger rebound to 1.2850-60 but only break of latter level would signal a temporary low is formed instead, bring retracement of recent decline to 1.2900-10, then 1.2940-50, however, price should falter below 1.3000 and the greenback shall head south again from there.
To recap, wave B from 1.3066 is unfolding as an a-b-c and is sub-divided as a: 1.2192, b: 1.2716 and wave c is a 5-waver with i: 1.1983, ii: 1.2506, extended wave iii with minor iii at 1.0206, wave iv ended at 1.0781 and wave v as well as wave iii has ended at 0.9931, hence the subsequent choppy trading is the wave iv which is unfolding as (a)-(b)-(c) with (a) leg of iv ended at 1.0854, followed by (b) leg at 1.0108 and (c) leg as well as the wave iv ended at 1.0674. The wave v is sub-divided by minor wave (i): 0.9980, (ii): 1.0374, (iii): 0.9446, (iv): 0.9913 and (v) as well as v has possibly ended at 0.9407, therefore, consolidation with upside bias is seen for major correction, indicated target at 1.3700 and 1.4000 had been met and further gain to 1.4700 would be seen later.

Canada: Consumer Price Inflation Eases in June as Energy Prices Pull Back
Consumer price inflation decelerated to just 1.0% (year-on-year) in June (from 1.3% in May) – a touch softer than the consensus forecast of 1.1%. Prices were flat on the month after seasonally adjusting.
Once again it was a goods story pulling down inflation. Goods prices were down 0.5% year-on-year, the biggest decline in over two years. Services inflation on the other hand accelerated to 2.4% y/y from 2.3% in May.
Falling energy (-1.3% y/y) and passenger vehicle prices (-0.2% y/y) weighed on the headline number, while food prices (+0.6% y/y) contributed positively to inflation for the first time in nine months.
Two of the Bank of Canada's three core measures edged up on the month. CPI-median accelerated to 1.6% from 1.5%, while CPI-common was up to 1.4% from 1.3%. CPI-trim was unchanged at 1.2%.
Key Implications
The Bank of Canada's decision to raise the overnight rate last week cited temporary factors restraining price growth. These were evident in June with gasoline, electricity, and passenger vehicle prices all weighing on the headline number.
The Bank of Canada was likely to see through this print, whatever it came in at. Having said that, the Bank did communicate that it expects the weakness in the core measures to firm, and the June data suggests a break from the several month downward trend. This may provide confidence that as slack diminishes, inflation should begin moving toward the 2% target.
Canada: Retail Sales Extend Gains in May
Retail sales continued to gain ground in May, rising by 0.6% during the month. In real terms, the picture was even better, with volumes up 1.1%.
May's increase stemmed largely from sales at motor vehicle and parts dealers (2.4%), as total retail sales excluding autos were down 0.1%. Other areas of strength during the month included electronics and appliance stores (+1.2%) and food and beverage stores (0.9%). Most other subsectors reported declines during the month, led by general merchandise (-1.3%) and health and personal care (-1.3%) stores.
Regionally, the gains were broad based, led by B.C. (+2.6%) and Alberta (+1.6%). Only Quebec (-0.8%) and P.E.I. (-2.9%) recorded a drop in retail sales during the month.
Key Implications
The string of higher retail sales volumes recorded over the last few months certainly bodes well for overall growth during the second quarter, which is tracking just above 3%.
While a solid labour market performance should help to keep household spending at healthy levels, momentum is expected to fade over the second half of the year, as a cooling housing market in Ontario is likely to constrain demand for housing related items while rising interest rates take some steam out of consumer spending overall.
Indeed, despite a soft inflation backdrop, the better-than-expected performance of the Canadian economy – particularly on the domestic front – should allow the Bank of Canada to follow through will another rate hike in October, fully unwinding the emergency cuts that were put in place following the oil price collapse.
Canadian Dollar Higher as Retail Sales Soar
- Canadian inflation slows
- Canadian retail sales soar
Data this morning showed that Canada's inflation rate in June decelerated for the fourth time in five-months and rose at its slowest pace since the fall of 2015.
Like other G7 nations, Canada continues to deal with the challenge of weak pricing pressure amid improving growth prospects.
Canada's all-items consumer-price index in June increased +1% y/y, following a +1.3% advance in May. The market was expecting a +1.1% gain.
On a month-over-month basis, CPI in June declined -0.1%.
Lower energy and gasoline prices from a year ago were the main downward contributors on June CPI.
Note: The average rate of annual core inflation, based on three gauges used by the BoC, rose +1.4% in June vs. +1.3% in May.
Retail Sales
Canadian retail sales climbed in May for a third consecutive month, powered by demand for new and used cars.
Ex-autos, retail receipts fell a tad.
The value of retail sales in May rose +0.6% on a seasonally adjusted basis to +C$48.91B. That exceeded market expectations for a +0.3%.
In volume terms, total retail sales rose by a faster +1.1% in May.
The loonie has taken flight and is currently trading atop of the overnight highs at C$1.2554, up +0.35%
The BoC expects household expenditures to remain robust in the near term, supported by job gains and firmer wage growth.
However, consumption is expected to ease as housing activity slows down, and consumers deal with elevated debt loads amid an environment of rising borrowing costs. Governor Poloz hiked rates +25 bps to +0.75% for the first time in seven years this month on an improving economy.
Gold Climbs to 3-Week High on US Political Risk
Gold has posted gains in the Friday session. In the North American session, spot gold is trading at $1250.50, up 0.49% on the day. On the release front, there are no US indicators on the schedule. On Thursday, US indicators were mixed. Unemployment claims dropped to 233 thousand, marking a 9-week low. The news was not as positive on the manufacturing front, as the Philly Fed Manufacturing Index slowed down to 19.5, its weakest reading since November 2016.
With the Trump administration beset by investigations and allegations of wrongdoing, investor risk appetite has decreased, boosting gold prices. Gold is up 1.7% this week and is trading at its highest level since June 29. It has been a brutal week for President Trump. Early in the week, Trump's cherished flagship healthcare proposal, which aims to replace Obamacare, stalled in the Senate after two Republican senators said they would not support the bill. Trump has failed to pass any significant legislation so far in his term, and investors are becoming more skeptical as to whether Trump will have any more success with his tax reform and fiscal spending plans. With the Democrats forming a rock-solid wall of opposition, dissension among Republican lawmakers, many of whom are uneasy about Trump, could doom attempts by the White House to get bills through Congress. There was more bad news as Robert Mueller, the special counsel who is investigating alleged collusion between Trump and Russian officials during the US election, said he would review business transactions involving Trump as well as his associates. Trump has said that Mueller's scope is limited to Russia, so the stage could be set for a Nixon-type showdown between the president and the special counsel investigating wrongdoing by the president.
Gold prices moved higher on Thursday after the European and Japanese central banks announced that they would continue their accommodative monetary policy. As well, the ECB and BoJ maintained the current policy of ultra-low interest rates, at 0.00% and 0.10% respectively. With the economies in the eurozone and Japan both showing improvement, their has been pressure on policymakers to reduce stimulus. However, inflation levels in the eurozone and Japan are well below the target of 2%, and the banks have reiterated that they will not taper asset-purchases until inflation levels move higher. The ECB is expected to revisit its monetary stance at its September meeting, and if policymakers decide to tighten monetary policy, gold prices could head lower.