Sample Category Title
FOMC Policy Gathering, Key Economic Data in Focus
Next week's market movers
- In the US, the highlight will probably be the FOMC policy decision. Even though no change in policy is expected, investors may focus on any signals regarding the timing of the next rate hike.
- In Australia, CPI data for Q2 could shed some light on whether the RBA will officially turn hawkish soon. That said, comments from RBA's Debelle suggest that rate-hike talk may still be premature.
- We also get key economic data from the Eurozone, Germany, the UK, the US, and Japan.
On Monday, we get the preliminary manufacturing and services PMIs for July from many European nations and the Eurozone as a whole. The forecast is for the bloc's manufacturing index to decline slightly, but for the services print to tick up, something that would leave the composite figure unchanged. We think that relatively unchanged prints would still be encouraging news for ECB policymakers, considering that all of these indices are expected to remain at elevated levels, consistent with robust growth in the Eurozone. Solid PMIs could enhance speculation that the ECB may continue shifting to a more hawkish stance at its upcoming meetings, and that the Bank could make a formal announcement as early as October that the pace of QE purchases may be reduced by the turn of the year.
On Tuesday, we have a relatively quiet day, with no major events or indicators due to be released.
On Wednesday, the highlight of the day will be the FOMC rate decision and the forecast is for no change in policy. This is one of the smaller meetings that are not accompanied by updated forecasts or a press conference by Chair Yellen. As such, all of the action will come from the language of the statement accompanying the decision. What should investors expect from this meeting? Not much, we think.
Economic data following the Fed's June policy meeting have been disappointing, on balance. The headline CPI rate declined again in June for the 4th consecutive month, casting doubts as to whether the recent softness in inflation is indeed transitory. Meanwhile, retail sales for the month surprisingly tumbled. What's more, even though the labor market posted another month of solid jobs gains in June, we doubt that will be enough to comfort policymakers, considering that wage growth remains lackluster.
Bearing all these in mind, we think that the statement accompanying the decision may have a somewhat more cautious tone than previously, acknowledging the recent softness in the data. Even though the Committee could signal once more that it views this weakness as transitory and that it expects the indicators to recover soon, we find it difficult to envision a scenario in which policymakers appear optimistic enough to bring rate-hike expectations forward and boost USD. Market pricing currently suggests that the probability for another hike this year is roughly 50%. We believe investors may need to see a material rebound in inflation and GDP data, before that probability rises notably.
From Australia, we get CPI data for Q2. In the absence of any forecast, we see the case for the nation's inflation rate to have ticked up from +2.1% yoy in Q1. We base our view on the Melbourne Institute inflation gauge, which rose to +2.3% yoy in June. Even though a potential acceleration in inflation could enhance speculation regarding a rate hike by the RBA in the foreseeable future, we remain doubtful on that prospect. Recent comments from RBA Deputy Governor Debelle suggest that rate-hike talk may still be premature. His remarks signaled that the Bank may be somewhat uncomfortable with the recent rise in Australian yields, as well as AUD appreciation. As such, we would like to hear from Governor Lowe, or wait for the next RBA meeting, before we become confident that the Bank may turn hawkish soon.
In the UK, the 1st estimate of GDP for Q2 will take center stage, though no forecast is available yet. Our own view is that growth may have accelerated somewhat from an anemic +0.2% qoq in Q1. We base this assessment on the nation's NIESR GDP estimate, which shows growth ticked up to +0.3% qoq in Q2. Even though accelerating growth would be encouraging news for the BoE, we don't think that +0.3% qoq is robust enough to boost market expectations regarding a hike in the near term.
On Thursday, from the US, we get durable goods orders for June. The forecast is for both the headline and the core rates to have risen. This would mark a rebound for the headline print, which has fallen for two consecutive months now. The case for solid durable goods is supported by the nation's ISM manufacturing PMI for June, the new orders sub-index of which rose notably, indicating accelerating growth in orders.
On Friday, during the Asian morning, Japan's CPIs for June will be in focus. No forecast is available for the headline rate, while the core rate is expected to have held steady at +0.4% yoy. We view the risks surrounding both rates as skewed to the downside, considering that the nation's forward-looking Tokyo CPI rates declined notably in June. A potential pullback in the nationwide rates as well could amplify our view that even though many of its foreign counterparts have turned hawkish, the BoJ is likely to keep its ultra-loose QQE with yield-curve control framework intact for the foreseeable future. Given that under this framework the BoJ keeps yields on longer-dated JGBs fixed near 0%, we maintain our broader view that JPY may continue to underperform EUR and CAD, given that the ECB and the BoC have turned optimistic.
From Germany, we get preliminary CPI data for July, ahead of Eurozone's figures that are due to be released the following Monday. The forecast is for the nation's inflation rate to have ticked down. Even though such a decline could be seen as a somewhat discouraging development for ECB policymakers, we would like to stress that Germany reports only a headline, not a core, inflation rate. This implies that a small slide in this rate may be owed mainly to movements in the prices of volatile items, and may not necessarily be descriptive of underlying inflationary pressures in Eurozone's largest economy. We think that investors will focus primarily on Eurozone's core CPI print in order to gauge when and how the ECB may act next.
From the US, we get the 1st estimate of GDP for Q2. The forecast is for economic growth to have accelerated to +2.5% qoq SAAR from +1.4% qoq SAAR in Q1. The forecast is supported by the Atlanta Fed GDPNow model, which at the time of writing estimates Q2 growth at +2.5% qoq SAAR. We believe this indicator will be closely watched, as it may prove critical with regards to market expectations regarding the timing of the next Fed rate hike. Looking back at the June FOMC meeting, where the Committee raised rates, policymakers noted that even though growth was soft in Q1, they expected it to rebound soon. Therefore, if growth regains momentum as anticipated, that would confirm the Fed's view that the slowdown in Q1 was only transitory, and is likely to heighten speculation regarding another rate hike this year.
US Dollar Set To Weaken Again
- Draghi Backs Away From Reflation Story - Peter Rosenstreich
- US Dollar Set To Weaken Again - Yann Quelenn
- Dark Clouds Ahead For US Car Traditional Industry - Arnaud Masset
- Curing Cancer
Economics - Draghi Backs Away From Reflation Story
With the summer trading fully upon us we don't expect any single driver to get to far ahead. This includes the central bank "normalization" theme. The ECB vs. Fed divergent normalization policy trade has already run a far distance, increasing the likelihood of a USD bullish correction. Weakness in the US economic backdrop and lingering reputation for the economic data to underperform the Fed own forecasts has prompted traders to push out the next Fed rate hike. Expectations for a December interest rate increased has gone from 55% to 35% in a few weeks while since April the USD has lost nearly 9.5% against the Euro. Yet beyond speculation, Europe data and the ECB have not provided a convincing argument that tighten will occur at any quicker pace.
Last Thursday ECB meeting was a tame event providing limited new information. The ECB held operations unchanged while not proving any real insight when tapering of asset purchases would begin. Draghi stated that no precise date was given to ending asset purchased, going further communicating that discussion would take place in the autumn. Draghi sounded dovish stating that inflation "is not where we want it to be". Taking a clear step back from Sintra speech which highlighted the reflation story. He also mention that exchange rate has gathered some attention and would effect decisions on formulating policy.
The steady appreciation of the EUR and increase in bund yields recently is a likely a worry for the central bank. Draghi is clearly interested in avoiding aggravating the ensuing tightening of financial conditions and slowing inflation further. Draghi saying vaguely that "autumn" would be appropriate for discussion on exit he limited expectations for the Jackson Hole confidence. Overall we suspect that the ECB will use the September meeting to set the stage for an October announcement.
This strategic delay should allow a level of uncertainty to creep in and bullish EURUSD momentum to subside. Especially since Fed 16th September meeting is highly likely to bring a critical announcement on re-balancing. The US incoming data continue to indicate solid activity and solid labor markets with inflation rebounding. Supporting the theory of an earlier then expected Fed announcement (26th July meeting). We see EURUSD key resistance at 1.1716 to cap current bullish extension with a likely downside correction on fundamentals factors.
Economics - US Dollar Set To Weaken Again
Last week, at the Fed's semi-annual monetary policy, Janet Yellen admitted that stocks markets are overheated. She declared that there are strong "valuation pressures" across a range of assets. Despite that, Fed Chair Yellen appeared… dovish while markets were expecting hints about further rate hike before year-end. It is ironic as over the last eight years, during the zero-interest rate policy time, the US central bank boosted stocks higher through liquidity and strong verbal interventions.
We now believe that the Fed wants to leave inflation running. To do so, the Fed won't drain liquidity from its balance sheet and rates are not going to be increased above 2%. Yellen and the Fed knows anyway that increasing rates above 2% would likely trigger a massive recession as the US debt is too massive and the service of the debt would not be sustainable. We strongly believe in this hypothesis knowing the level of indebtness of the North-American country. A snowball effect could be disastrous.
The normalization of the monetary policy is definitely going to take longer. The dilemma is getting worse for US policymakers. The stock bubble is underpinned by the Fed monetary policy but increasing rates would trigger a recession.
Next Thursday, the US rates are then not going to be increased and we consider that the US central bank wants to kill its debt through inflation. The greenback should further weaken against the single currency and reaching $1.17 for 1 euro definitely represents a short-term target. The greenback is getting weaker against major G10 currencies and the euro dollar is now trading at levels unseen since May 2016. The bullish trend seems very deep.
For the time being, we still consider that the true state of the US economy is overestimated. Economic fundamentals are mixed. Import prices for June have been released and have declined by 0.2%. In May imports price already declined by 0.3% m/m. Excluding Oil, import prices have slightly increased. On top of that, the US CPI recoded four successive declining monthly print. The Fed target seems less and less attainable in a reasonable timeframe. As a result, we firmly believe that reloading bearish positions on the dollar is a good bet within the next few months. There is no evidence at the moment that the greenback will strengthen in the medium run.
Economics - Dark Clouds Ahead For US Car Traditional Industry
Over the last few years, the pace of new car selling went through the roof in the US, fuelled by subprime loan. The shares of car manufacturers enjoyed a decent ride as low income borrowers were given the opportunity to acquire a brand new car despite weak financial means.
First have a look at the recent development in the secondary market. The average transaction price of pre-owned cars rose to $19.2k dollar in the first quarter of 2017 compared to $18.8k a year earlier, which may suggest that the demand is solid and that the second-hand market still has beautiful days ahead. However, do not get misled, this increase comes essentially from rising MSRP (Manufacturer's Suggested Retail Price) and the effect of a persistent decrease in the average age of pre-owned cars. Indeed, the average age of a retail used vehicle was 4.4 years in the first quarter, compared to 4.5 years twelve months ago, while the average initial MSRP rose to $34.2k from $32.9k.Taken together, these developments result into a consistently widening spread between MSRP and retained value of pre-owned cars. In other words, owners of a new car have to take a bigger hit when they are selling their asset on the secondary market. This trend should even accelerate in the future amid rising supply of second-hand vehicles in the market, reducing substantially the incentive to buy a new car as cheaper alternatives are available in the pre-owned market.
Unfortunately this phenomena is definitely not about to reverse as the US auto market is facing a new crisis. The auto loan market - and more specifically subprime loans - has come under the spotlight recently amid surging default rate. Indeed, similarly to what happened during the US housing market a decade ago - when lenders didn't even care about verifying incomes or job histories of borrowers - the history repeats itself but this time with the auto industry. Low income borrowers were able to drive new cars but were charged high interest rate, making the investment very interesting, especially against the backdrop of ultra-low interest rates.
As expected, low income borrowers cannot afford such a drain on the long-term and therefore default on the loan and trigger the usual mechanism: the lender seize the car and tries to sell it on the secondary market, thus inflating the supply of pre-owned car. Without going too much into the details, the bottom line is that after years with record sales volumes, the US auto industry is ahead of years of low entries. The top brands in market share in the US will inevitably take a hit. Ford, Toyota, Honda, Nissan and General Motors are the first in line. Therefore it is likely that the price of those companies will sooner or later start moving south as sales volumes shrink.
Themes Trading - Curing Cancer
According to cancer.org, it is estimated that 21.7 million new cases of cancer will be diagnosed in 2030. Thirteen million cancer deaths are forecast that same year. And with new lifestyles already suspected to increase cancer risk, these figures are likely to be underestimated. As a result, there are important discoveries to be made, and many companies - including start-ups - are investing time and money to find treatments.
Of course, finding a cure for cancer takes time, dedication and knowledge. Today's investment is tomorrow's cure. It is also difficult to know just what research is being done: findings often appear in confidential reviews. We have therefore selected 12 stocks where research and development is focused on a wide range of medications. Our main diversification is between start-ups and revenue-generating companies.
We have selected five recent start-ups that completed IPOs in 2015 but have yet to release any products. These companies are candidates to become future pharmaceutical blue chips. Beigene and Syndax are focusing their research on developing cancer treatment drugs, while Edita
Week Ahead Dollar Under Political Pressure Ahead of July Fed Meeting
Political uncertainty sinking Dollar
The US dollar is weaker against most of majors after a week where there was little on the US economic calendar with the spotlight on Washington's rising political tensions. The investigation into Russian ties during the presidential election, the lack of momentum in policy reform put the emphasis on political uncertainty that punished the US dollar. Next week will offer a chance to return to trading on fundamentals with the release of consumer confidence, the Fed's July rate statement and the preliminary second quarter gross domestic product GDP.
The U.S. Federal Reserve will publish the statement from its Federal Open Market Committee (FOMC) meeting on Wednesday, July 26 at 2:00 pm EDT. There is a low probability of a rate hike in July with the CME FedWatch tool showing a 96.9 percent probability of the Fed funds rate staying at 100–125 basis points. With no press conference following the statement the market will be going through the document for insights into how weaker sales and inflation impact their assessment of the economy. The US central bank is still forecasted to raise interest rates once more before the end of the year.
The Conference Board will release the US consumer confidence survey on Tuesday, July 25 at 10:00 am EDT. Consumers have remained confident through the first half of the year, but the paradox between confidence and spending remains as sales have been disappointing. The US Bureau of Economic Analysis will publish the first estimate of GDP for the second quarter on Friday, July 28 at 8:30 am EDT. The first quarter ended up with a 1.4 percent gain thanks to a rise in consumer spending. The NY Fed recently downgraded its second quarter estimate to 1.90 percent.
The EUR/USD gained 1.543 percent in the last five days. The single currency is trading at 1.1637 in a week that saw the European Central Bank (ECB) deliver a dovish statement by not offering further details on its exit from its quantitive easing program saying only that it will do so with extreme caution. The EUR climbed higher as the overall message was still monetary policy would be shifting in the future, but ECB President Mario Draghi did little to stop the rise of the currency by showing little concern with slowing inflation.
Dollar weakness due to political reasons combined with a less dovish than anticipated rhetoric from the ECB drove the EUR higher with 1.20 not an unreasonable target if economic indicators in the US continue to disappoint. This week there were few fundamentals to build a case for dollar strength, but next week will give the Fed a chance to boost the dollar although its effect could be limited as there are no big changes expected aside from some minor change in the language of the FOMC statement. The first estimate of GDP will come later in the week but has the power to dramatically shift the dollar trend by beating expectations, on the flip side it could accelerate the downward trajectory the greenback is currently on if momentum was lost in the second quarter.
The USD/CAD lost 1.232 during the last five trading sessions. The currency is trading at 1.2558 with the loonie rising against the buck after the release of strong Canadian retail sales. Auto sales helped sales beat the 0.2 percent forecast with a final figure of 0.6 percent. Removing sales of new and used automobiles told a less optimistic picture with a drop of 0.1 percent. Inflation also appears to be slowing down with a loss of 0.1 percent in June. Annual inflation was 1 percent and below the 2 percent target by the Bank of Canada (BoC).
Overall the positive retail sales validate the actions of the central bank who hiked rates earlier in the month by 25 basis points. The Canadian benchmark rate is now 0.75 percent and the BoC is not alone in moving ahead with tighter monetary policy despite low inflation. Forecasters still see a second interest rate hike before the end of the year, with October the most likely candidate.
Stable oil prices and US dollar weakness have amplified the positive effect of the Canadian rate hike for the loonie. The currency has appreciated touching an important psychological 80 cents versus the dollar. NAFTA negotiations are expected to kick off in August and so far there is optimism on the trade deal being tweaked instead of an intensive reworking. Elections in Mexico and the US also incentivize the two nations to expedite the talks.
Market events to watch this week:
Tuesday, July 25
- 10:00 am USD CB Consumer Confidence
- 9:30 pm AUD CPI q/q
- 9:30 pm AUD Trimmed Mean CPI q/q
Wednesday, July 26
- 4:30 am GBP Prelim GDP q/q
- 10:30 am USD Crude Oil Inventories
- 2:00 pm USD FOMC Statement
- 2:00 pm USD Federal Funds Rate
Thursday, July 27
- 8:30 am USD Core Durable Goods Orders m/m
- 8:30 am USD Unemployment Claims
Friday, July 28
- 8:30 am CAD GDP m/m
- 8:30 am USD Advance GDP q/q
*All times EST
RBA’s Neutral is Too High; Minutes Do Not Signal a Tightening Bias
Week beginning 24 July 2017
- RBA's neutral is too high; minutes do not signal a tightening bias.
- RBA: Governor Philip Lowe speaks.
- Australia: Q2 CPI, import/export price indices.
- NZ: trade balance.
- UK: Q2 GDP advance.
- FOMC: July policy decision.
- US: Q2 GDP advance, employment cost index.
- Markit flash PMIs.
- Key economic & financial forecasts.
RBA's neutral is too high; minutes do not signal a tightening bias
Interest rate markets have reacted marginally to the Reserve Bank's minutes of its July Board meeting. Despite the Bank setting out a 200 basis point profile for the required move back to neutral, markets priced the "target" rate at August next year up from 1.73%, before the release of the minutes, to 1.84% (close of business) with May now priced at 1.74% compared to 1.64%.
Without doubt the most important result from the minutes of the monetary policy meeting of the RBA Board was to finally nominate the Bank's estimate of the "new neutral real interest rate for Australia". In other countries it has been recognised for some time that the neutral rate has fallen particularly since the global financial crisis in 2007.
Prior to that, it had generally been accepted that the neutral nominal cash rate for Australia was around 5%. In those pre GFC days, various Bank speakers would refer to "average" being around 5%. This was a curious approach given that, for Australia, the effective interest rate is the mortgage rate so the "average" cash rate had limited significance given that the mortgage margin had been quite unstable.
The minutes highlight that the Bank now believes that the neutral nominal cash rate is around 3.5% indicating a neutral real rate of 1% on the basis that medium term inflation expectations are around 2.5%. Consequently any move back to neutral would involve around 200 basis points in tightening.
Note that the analysis refers to the "neutral nominal cash rate". So, for instance, the increases in mortgage rates that we have recently seen (average of 0.28% across the whole book including 0.76% for interest-only investors) would not be taken into account as part of the 200 basis points in tightening. If the mortgage rate increased by a further 200bps, the evidence of 2011 suggests that house prices would likely fall, as they did under weight of the 200 basis point increase in the mortgage rate in 2011.
That increase coincided with "only" a 175 basis point increase in the cash rate. In short, the evidence of 2011 showed that a 175 basis point increase in the cash rate produced a marked fall in house prices. That would hardly qualify as a neutral stance - falling house prices could be reasonably associated with a wealth and financial stability shock that would push an economy off any stable equilibrium.
Arguably, the discussion around the neutral rate can be interpreted as laying the foundation for a tightening cycle. However with uncertainty around wages and inflation; the consumer; and, of course, the labour market and housing it would be inappropriate to over interpret this signal.
Other central banks have assessed "real neutral". The Federal Reserve believes near term neutral real is "zero" with medium term neutral being 1% real - same as the RBA's assessment.
Clearly the Bank would accept that "finding" neutral would be an aspect of the policy challenge. As Chairman Greenspan used to note," you will know neutral when you are there." Or Chair Yellen who notes that moves are "data dependent".
The minutes themselves emphasised uncertainty, particularly around the labour and housing markets.
The commentary around the labour market was definitely more confident and the Employment Report for June, that was released two days after the minutes, was also encouraging. Not only do the minutes refer to "employment growth had been strong in May for the third consecutive month" but it is also noted that "forward looking indicators of labour demand … had remained positive and generally consistent with the patterns of employment across states and industries". This commentary suggests that the Board is reasonably comfortable that the recent upswing in employment can be sustained. The only note of caution around the recent developments is that "the underemployment rate … had remained elevated".
We are aware that subdued wages growth is a significant concern for the Bank. That remains a consideration. However, the minutes did point out that the recent Fair Work Commission decision to increase award wages and the national minimum wage by 3.3% (affecting around 40% of workers) was markedly higher than the 2.4% awarded in 2016.
Commentary around the housing market continued to note that conditions vary across the country, although the "auction clearance rates in Sydney and Melbourne had softened recently suggesting that conditions in these markets had eased somewhat". It was also noted that the impact of the prudential supervision measures were yet to have their full effect.
At the time of the board meeting, the Australian Dollar was trading at around USD 0.76. Not surprisingly, the minutes therefore retain the standard terminology "an appreciating exchange rate would complicate this adjustment". With the currency now at USD 0.79, the Board is likely to be more concerned about its impact on the rebalancing process.
The Bank's thinking about the AUD is measured. The increase in the AUD from USD0.76 to USD0.79 (4%) has been partly due to USD weakness. But the trade weighted Index has also appreciated from 65.1 to 67.3 (3.4%) so the majority of the boost has been commodity prices and this perceived hawkish stance from the RBA. The Bank will regret the degree to which the latter is a factor while also eschewing higher commodity prices since the major beneficiaries (the mining companies) are not expected to boost investment or employment in the wake of higher expected profits. In effect there is no offset to the reduced competitiveness stemming from a higher AUD.
The higher AUD will impact the perceived risks around the Bank's inflation and growth forecasts.
As the minutes point out, financial market pricing for RBA policy has "shifted to indicate some probability of an increase in the cash rate by mid-2018". The most important development behind this outlook is the improved conditions in the labour market.
The implications for policy from the housing market are less clear. The macroprudential policies have already resulted in higher mortgage rates, and as noted in the minutes, pressures in the housing market appear to be easing.
Recall that the Bank's current forecasts for GDP growth in 2018 are an above trend 3.25%. That contrasts with our own forecast of only 2.5%. Our forecasts envisage ongoing caution from the consumer; no significant recovery in non-mining investment and detraction in growth from housing construction.
Furthermore, the growth profile which we described is unlikely to be consistent with sustained improvement in the labour market. The short-term outlook for employment growth is positive. However we expect that, around year end, the unemployment rate will turn and will edge back towards 6% over the course of 2018.
Despite a more confident Bank and its decision to set out its new so-called "neutral target", our forecasts remain consistent with the cash rate staying on hold throughout 2017 and 2018.
Furthermore the evidence, particularly around the housing market, suggests that "neutral" is closer than 200 basis points away.
Data wrap
Jun Westpac-MI Leading Index
- The six month annualised growth rate in the Westpac- Melbourne Institute Leading Index, which indicates the likely pace of economic activity relative to trend three to nine months into the future, fell sharply from 0.51% in May to -0.76% in June.
- The index is pointing to a slowdown in momentum in Australia's growth profile with the first below trend reading since July 2016. The deterioration mainly reflects international factors including a sharp turnaround in Australia's commodity prices in Australian dollar terms.
- The Leading Index growth rate has slowed from 1.61% above trend in January to 0.76% below trend in June (a deterioration of 2.37ppts). Two components account for all of the reversal: commodity prices and the yield spread. After surging 42% over the second half of 2016, Australia's commodity prices have fallen 17% over the first half of 2017 in AUD terms. The swing has seen this component alone go from adding 1.26ppts to the Leading index growth rate in January to subtracting 0.71pts off in June, a reversal worth 1.97ppts. Some of this reflects the unwinding of temporary policy and weatherrelated spikes in coal prices. However, a strong rally in iron ore prices through much of last year also moved into reverse from early 2017 through mid-June.
Jun labour force
- Total employment rose 14k compared the market's forecast for 15k. In the month unemployment was flat a 5.6% (May was revised up from 5.5%) as the participation rate nudged up 0.1ppt driving a rise in the labour force; at two decimal places the unemployment rate was 5.65%.
- The Australian labour market went through a soft patch in 2016, particularly from August to November, but there has been a solid uplift as we moved through 2017. The annual pace accelerated from 0.9%yr in Feb to 2.0%yr in May holding that pace in June. In the year to Feb total employment grew 106.9k which has since lifted to 240k in the year to June. The 14k gain in June represents an average of 33.7k per month.
- Full-time employment surged 62.0k in June following on from a 53.4k gain in May. In the year full-time employment gained 175.4k/2.1yr. Part-time employment fell 48k following a -15.4k in May. In the year to June, part-time employment lifted 64.8k running at a slower pace than full-time employment for the first time since Mar 2015.
- By state, there were solid gains in NSW (+3.6k), Vic (+3.7k), SA (4.6k) and WA (6.9k). The only mainland state to report a decline was Qld (-1.0k). Unemployment was flat in NSW (4.8%), it fell in Vic (5.9% from 6.0%) and SA (6.6% from 6.9%) while the unemployment rate lifted in Qld (6.5% from 6.1%) and WA (5.6% from 5.5%).
- A further sign of the overall strength of this report was the 0.5% lift in hours worked following the 1.7%mth jump in May. The annual pace for total hours worked lifted to 3.3%yr which is the fastest pace seen since Dec 2015.
New Zealand: week ahead & data wrap
Old school
This week's inflation report confirmed that prices in New Zealand were subdued in the June quarter, and in fact even softer than expected. While technological change has played some part, the recent weakness in inflation seems to be largely for old-fashioned reasons.
Consumer prices overall were flat in the June quarter, following a surprisingly large 1% increase in the March quarter. That saw the annual inflation rate slow from 2.2% to 1.7%. Both of the last two quarters were affected by what we expect to be temporary factors, so these numbers probably overstate the degree to which inflation has swung around lately. But a broad range of measures of underlying inflation also point to a slowdown in the annual rate.
New Zealand is far from alone in that regard. Many of our trading partners - most of whom report their inflation figures monthly, rather than quarterly - have already seen a pullback in both headline and underlying inflation measures in recent months, after a strong pickup in the early part of this year. The common thread is oil prices, which rose sharply between early 2016 and early 2017 but have dropped back a bit since then.
As for New Zealand specifically, we can break the trends in inflation down to two broad themes. First, most of the slowdown in the inflation rate over the June quarter was in the tradables component. That includes the drop in fuel prices, but there were also some big price drops for import-heavy items such as home furnishings and electronics.
The electronics components of the CPI - such as TVs, computers and smartphones - need to be read with caution, as the prices are heavily quality-adjusted to take account of improving technology. So while there was a particularly large drop in these prices in the June quarter, they've been falling rapidly for many years now. And their deflationary influence is no greater now than it was in the 2000s, when inflation overall was persistently testing the top end of the Reserve Bank's target.
The more significant factor that has weighed on tradables inflation was the strong rise in the New Zealand dollar over 2016 - up around 12% in trade-weighted terms. Exchange rate movements flow through to the retail prices of imported goods with a typical lag of two to three quarters, reflecting importers' stock turnover rates and/or exchange rate hedges. The lag isn't precise - there was less exchange rate passthrough than we expected in the March quarter, but more than expected in the June quarter. But if we take the two quarters together, the strength of the relationship between the NZD and tradables inflation seems to be much the same as it ever was.
The second theme is that non-tradables inflation, while up from its lows, is still running substantially below where it was in the years before the Global Financial Crisis. This group includes government charges and other non-market prices, which on balance have actually been less of an inflationary force in recent times.
But for the most part, non-tradables inflation reflects the strength of domestic demand and the extent of domestic capacity constraints. And here, the reason for low inflation is simple: the local economy just isn't growing fast enough to see it overheat. Strong population growth means that New Zealand's GDP is growing faster than many of our peers, but in per capita growth terms we're distinctly in the middle of the pack. The unemployment rate has been declining, and at around 5% it's arguably no longer in disinflationary territory, but it's not in what most economists would consider to be in inflationary territory either.
The notable exception to the domestic inflation story is in housing. Prices for newly built homes (excluding the land value) rose 6.4% in the year to June; in Auckland they rose by 8.1%. But we note that this component of the CPI has been rising strongly for several years, with no sign of these price pressures spilling over into other areas. Rising prices and the slow supply response seem to be very much a product of the structure of the homebuilding industry, which is understandably coming in for increased scrutiny.
For the Reserve Bank, the policy prescription remains the same. The economy needs to be allowed to continue to grow and gradually use up its spare capacity, in order for inflation to settle around the 2% target midpoint on a sustained basis. And that means keeping interest rates at low levels for an extended period.
The June quarter CPI is the last major piece of data before the RBNZ starts to prepare its August Monetary Policy Statement. (The June quarter labour market figures are released in early August, but not in time to make it into their forecasting process.) Recent developments have generally been of the soft side: inflation was lower than forecast, the New Zealand dollar has strengthened, and the housing market is cooling down much faster than the RBNZ expected.
If the RBNZ was "firmly neutral" in its last review, it is hardly going to be mulling the timing of interest rate hikes this time around. We think that the market is off-base in pricing in an OCR hike for next year, even if the timing has been pushed out from June to August since the CPI figures. In contrast, we don't expect an OCR hike before 2019, and that sort of horizon is too far out to be specific about the timing.
Data previews
Aus Q2 Consumer Price Index
Jul 26 Last: 0.5%, WBC f/c: 0.6%
Mkt f/c: 0.4%, Range: 0.2% to 0.8%
- The Q1 CPI printed 0.5% for an annual rate of 2.1%yr compared to 1.5%yr in Q4, 1.3%yr in Q3 and 1.0%yr in Q2. The June quarter 2016 was the lowest rate of annual inflation since June 1999.
- The core measures, which are seasonally adjusted and exclude extreme moves, rose 0.4% on average compared to the market's expectation of 0.5% rise. The annual pace of the average of the core measures is now 1.8%yr from 1.5%yr in Q4 and Q3.
- In the June quarter, a large Debbie boost to fruit plus a recovery in dwellings are offset by falling auto fuel. Westpac's forecast for the headline CPI is 0.6%qtr lifting the annual pace to 2.4%yr from 2.1%yr. Core inflation is forecast to print 0.5%qtr (0.54% at two decimal places) holding the annual rate flat at 1.8%yr.
Aus Q2 import price index
Jul 27, Last: 1.2%, WBC f/c: 0.7%
Mkt f/c: 0.7%, Range: -1.0% to 2.0%
- Import goods prices were little changed over the past year, with a Q1 result of +1.2%qtr, -0.6%yr.
- For the June quarter, the price of imported goods is expected to edge higher, increasing by 0.7%, reflecting the impact of the weaker currency. That would have import prices 1% above the level of a year ago.
- The Australian dollar weakened during the June quarter, declining by 2.2% on a TWI basis, reversing the gain in the previous three months. Over the past year, the dollar is 3% higher on a TWI basis.
- Global energy prices fell in the June quarter, declining by around 5%. Lower fuel prices partially offset the impact on import prices of the weaker dollar.

Aus Q2 export price index
Jul 27, Last: 9.4%, WBC f/c: -5.5%
Mkt f/c: -5.5%, Range: -12.0% to -2.9%
- Export prices increased sharply over the past year, rebounding as commodity prices bounced off the lows prevailing early in 2016.
- In Q1, the export price index increased by 9.4%qtr, 29.1%yr.
- However, the tide turned in the June quarter. Commodity prices eased back in the period, falling by about 8% in AUD terms, driving a fall in export prices.
- For Q2, the export price index is expected to decline by 5.5%. Annual growth moderates to 20%.
- The terms of trade for goods, on these estimates, fell by 6.2% in the quarter, trimming annual growth from 30% to 18.5%.
US FOMC July meeting
Jul 26, Last: 1.125%, WBC 1.125%
- In their June meeting communications, the FOMC remained resolutely positive on the outlook for the economy. This was principally owing to the strength of the labour market and a belief that, inevitably, this would translate into stronger wages growth and consumption. Their view of business investment was also constructive.
- A degree of unease however emerged in the minutes, with fiscal policy shifting from a solely positive risk to an either or proposition; the potential negative impact on investment of fiscal impasse was also noted. Since then, some members of the FOMC have also questioned the potential impact of balance sheet normalisation on the Fed Funds Rate path.
- Absent Q&A and forecasts, the July meeting offers limited scope to provide detailed guidance. But you can expect the statement to contain a positive view to keep the FOMC's options open, particularly given the market's sombre view.
US Q2 GDP
Jul 28, Last: 1.4%, WBC 2.5% (annualised)
- Q1's 1.4% annualised outcome was a disappointment for a number of reasons, but most notably because of the weakness evident in consumption. To an extent this was due to unseasonal weather which limited demand for services - two-thirds of total consumption.
- However, durables and non-durables demand also experienced a material deterioration in Q1. Come Q2, the demand pulse for these categories is again likely to underwhelm. Partial data also suggests services will struggle to accelerate materially. Given confidence and jobs growth, spending should be much stronger.
- Business investment rebounded in Q1, but Q2 will see slower growth; the public sector's contribution will also be negligible. All told, a 2.5% gain is most likely. Risks are skewed to the downside and centred on the consumer.
US Q2 Employment Cost Index
Jul 28, Last: 0.8%, WBC 0.6%
- Q1 finally saw a stronger wage outcome, total compensation rising 0.8% in the three months to March. This was driven by a 0.8% gain for wages, although benefits also rose 0.7%. Compensation is up 2.4%yr; wages 2.5%yr.
- The strength shown in the labour market should see wages growth accelerate. However, the pass through has been underwhelming to date, hence further progress is likely to be slow going.
- It is important to note that an eye also needs to be kept on benefits growth, with private-sector employers clearly using this component of consumption to offset demands for stronger wages from workers.
- Given the above, we look for a 0.6% rise for total compensation, though the wage gain could be stronger. That will keep the annual rate for compensation unchanged.
Dollar at 13-Month Lows; Loonie Gains on Rising Hike Prospects; Euro at Fresh High
Barring inflation and retail sales data out of Canada, today's European session was a rather quiet one in terms of data releases. In the absence of data during the rest of the session, forex market participants placed their orders having in mind developments from yesterday's European Central Bank meeting, as well as developments on the US political front.
The dollar index, which gauges the greenback against the currencies of six major US trading partners, fell to 93.99 today, a 13-month low. It last traded 0.3% down on the day, close to the aforementioned low. Expanding investigations into potential ties between US President Donald Trump and Russia seem to be weighing on the US currency as they're interpreted as posing another hurdle to the promotion of pro-growth policies by the Trump administration. Dollar/yen posted a more than three-week low of 111.14 in today's trading – it was last down 0.7%, looking set for its fourth straight day of declines. The dollar was also slightly down relative to sterling in afternoon European trading hours, with pound/dollar trading at 1.2990.
The euro built on momentum from yesterday's rally earlier in the session, rising to a fresh 23-month high of $1.1676. The single currency later eased to last trade slightly up on the day versus the greenback. ECB head Mario Draghi not directly talking the currency down during yesterday's press conference was seen as a positive sign by investors. The euro also hit an eight-and-a-half-month high relative to sterling as euro/pound reached 0.8990. The pair was last up 0.1% on the day.
Turning to today's main data releases, the Canadian annual inflation rate fell relative to May's 1.3% to reach 1.0% in June, as expected. June's figure constitutes a 20-month low and stands at a distance in relation to the Bank of Canada's 2% target. Falling gas prices contributed to the decline. Month-on-month, inflation was at -0.1%, again in line with projections and below May's 0.1%. The core inflation measures that are closely monitored by the BoC didn't fare as badly – specifically, CPI-common grew to 1.4% from 1.3% in May. When delivering its first rate hike in roughly seven years last week, the Canadian central bank expressed its view that recent weak inflation is of temporary nature.
Canadian retail sales rose by 0.6% month-on-month in May to hit a record C$48.91 billion. Sales comfortably exceeded expectations for an increase by 0.2% but grew less strongly than the 0.8% of the previous month. This is the third straight monthly increase in retail sales.
Market participants interpreted the above data as supporting the case for another rate hike by the BoC during its October meeting. Consequently, the Canadian dollar strengthened upon the release of the above data relative to its US counterpart with dollar/loonie eventually falling to 1.2548, close to the 15-month low from yesterday. The pair was last down 0.2% on the day.
Concluding with a glance at commodities, oil prices declined as a report indicated that supply by OPEC members will increase this month. WTI and Brent crude last traded at $46.15 and $48.59 a barrel, down 1.6% and 1.4% on the day respectively. Greenback weakness, helped push dollar-denominated gold higher. The precious metal recorded a fresh three-week high of $1251.99 an ounce during today's trading – it traded close to this level in afternoon European trading hours.
USDJPY: Bearish, Faces Further Weakness
USDJPY: The pair continues to hold on to its downside pressure weakening further on Friday. On the downside, support comes in at the 111.00 level where a break if seen will aim at the 110.50 level. A cut through here will turn focus to the 110.00 level and possibly lower towards the 109.50 level. Its daily RSI is bearish and pointing lower suggesting further weakness. On the upside, resistance resides at the 111.50 level. Further out, we envisage a possible move towards the 112.00 level. Further out, resistance resides at the 112.50 level with a turn above here aiming at the 113.00 level. On the whole, USDJPY looks to pullback further in the days ahead.
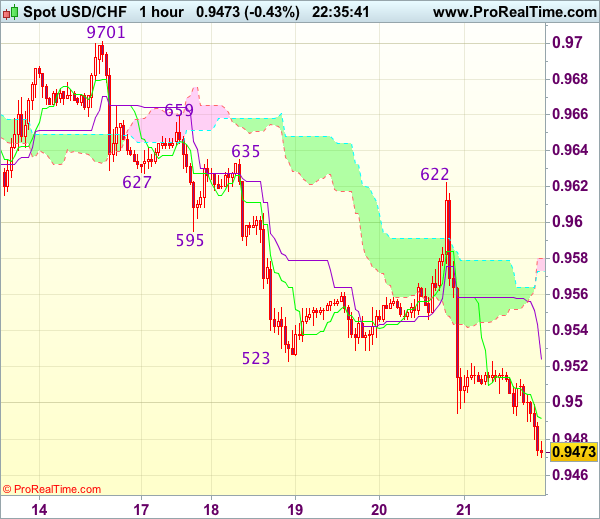
Trade Idea Wrap-up: USD/CHF – Sell at 0.9555
USD/CHF - 0.9475
Most recent candlesticks pattern : N/A
Trend : Near term down
Tenkan-Sen level : 0.9490
Kijun-Sen level : 0.9523
Ichimoku cloud top : 0.9580
Ichimoku cloud bottom : 0.9573
Original strategy :
Sell at 0.9555, target: 0.9455, Stop: 0.9590
Position : -
Target : -
Stop : -
New strategy :
Sell at 0.9555, target: 0.9455, Stop: 0.9590
Position : -
Target : -
Stop : -
The greenback ran into renewed selling interest at 0.9622 yesterday and has dropped sharply since, confirming recent decline has resumed and bearishness remains for further weakness to 0.9460, however, near term oversold condition should prevent sharp fall below previous support at 0.9440-44 and price should stay above 0.9400-10, risk from there is seen for a rebound later.
In view of this, we are looking to sell dollar on recovery as 0.9550-55 should limit upside and bring another decline. Above 0.9580-85 would suggest an intra-day low is formed, bring a stronger rebound towards resistance at 0.9622 which is likely to hold from here.
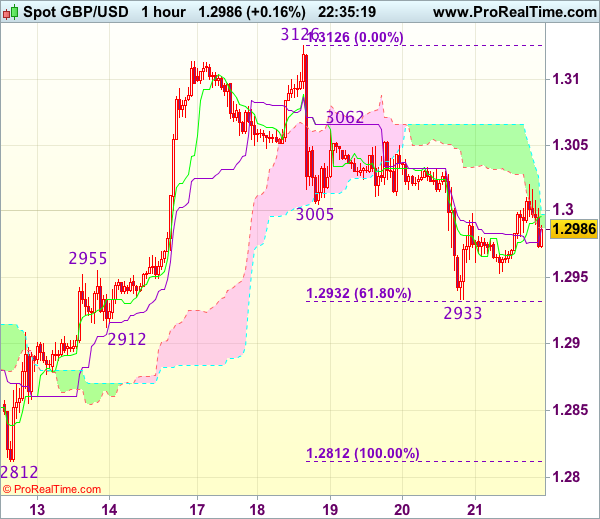
Trade Idea Wrap-up: GBP/USD – Sell at 1.3040
GBP/USD - 1.2989
Most recent candlesticks pattern : N/A
Trend : Near term up
Tenkan-Sen level : 1.2996
Kijun-Sen level : 1.2987
Ichimoku cloud top : 1.2998
Ichimoku cloud bottom : 1.2987
Original strategy :
Sell at 1.3030, Target: 1.2930, Stop: 1.3065
Position : -
Target : -
Stop : -
New strategy :
Sell at 1.3040, Target: 1.2940, Stop: 1.3075
Position : -
Target : -
Stop : -
Cable recovered after falling to 1.2933 yesterday and minor consolidation would be seen, however, as the drop from 1.3126 signals a temporary top has possibly been formed there, reckon upside would be limited to 1.3025-30 and bring another decline later, below 1.2932-33 (61.8% Fibonacci retracement of 1.2812-1.3126 and said support would bring test of previous support at 1.2912 but break of latter level is needed to retain bearishness and extend the fall from 1.3126 top to 1.2880-85 first.
In view of this, we are looking to sell cable on recovery as 1.3035-40 should limit upside. Only break of resistance at 1.3062 would abort and signal an intra-day low is formed instead, bring a stronger rebound towards 1.3090-00 but resistance at 1.3126 should remain intact.
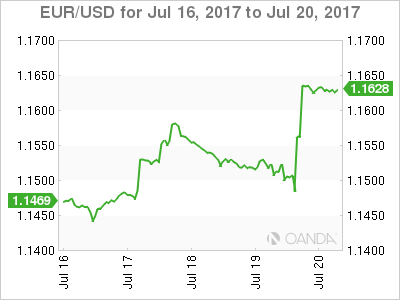
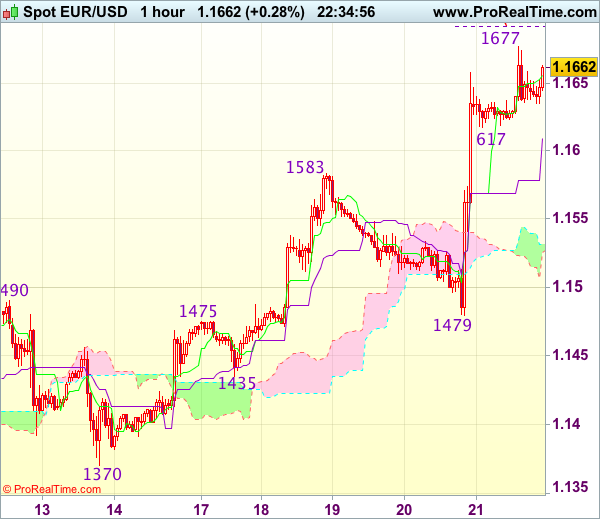
Trade Idea Wrap-up: EUR/USD – Buy at 1.1580
EUR/USD - 1.1660
Most recent candlesticks pattern : N/A
Trend : Near term up
Tenkan-Sen level : 1.1656
Kijun-Sen level : 1.1609
Ichimoku cloud top : 1.1531
Ichimoku cloud bottom : 1.1525
Original strategy :
Buy at 1.1580, Target: 1.1680, Stop: 1.1545
Position : -
Target : -
Stop : -
New strategy :
Buy at 1.1580, Target: 1.1680, Stop: 1.1545
Position : -
Target : -
Stop : -
Yesterday’s rally after finding renewed buying interest at 1.1479 signals recent upmove has resumed and bullishness remains for this move to extend further gain to indicated upside target at 1.1680, then towards previous chart resistance at 1.1714, however, break there is needed to retain bullishness for the rise from 1.0340 low to head towards 1.1750.
In view of this, we are looking to buy euro on pullback as previous resistance at 1.1583 should limit downside. Below the upper Kumo (now at 1.1531) would abort and suggest an intra-day top is formed, bring correction to 1.1510-15 but said support at 1.1479 should remain intact.
Elliott Wave Analysis: German DAX Looking Down
Dax is unfolding a sharp decline on intra-day chart, which we now see it as part of a bigger wave C. Specifically we see price trading in the steepest and strongest sub-wave three, which can extend its gains towards the Fibonacci ratio of 161.8, before make a three wave temporary correction into the following wave iv. Resistance for the upcoming wave four can later be around the 12306 level.
German dax, 1h