Sample Category Title
GBP/USD Weekly Outlook
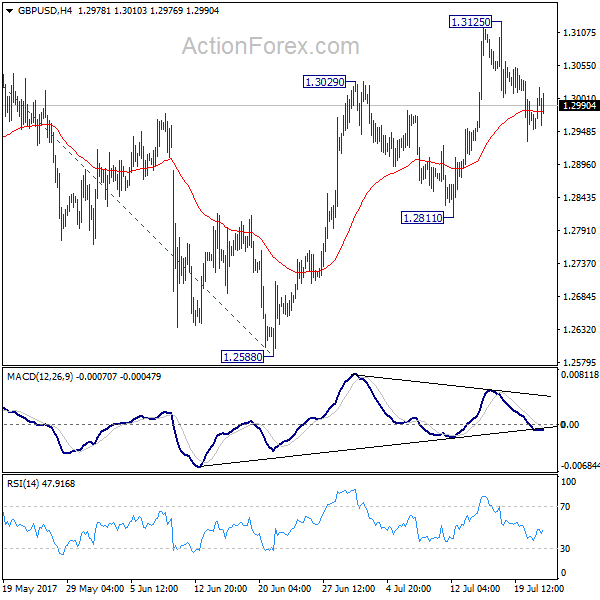
GBP/USD edged higher to 1.3125 last week but retreated sharply since then. With 1.2811 support intact, there is no indication of trend reversal yet. Initial bias stays neutral this week first. On the upside, break of 1.3125 will target 61.8% projection of 1.2108 to 1.3047 from 1.2588 at 1.3168. Overall, choppy rebound from 1.1946 is seen as a corrective pattern, hence, we'd be cautious on strong resistance from 1.3168 to limit upside. But firm break of 1.3168 will bring further rise towards 1.3444 key resistance. Meanwhile, break of 1.2811 support will be the first sign of reversal and will turn bias to the downside to target 1.2588 key support next.
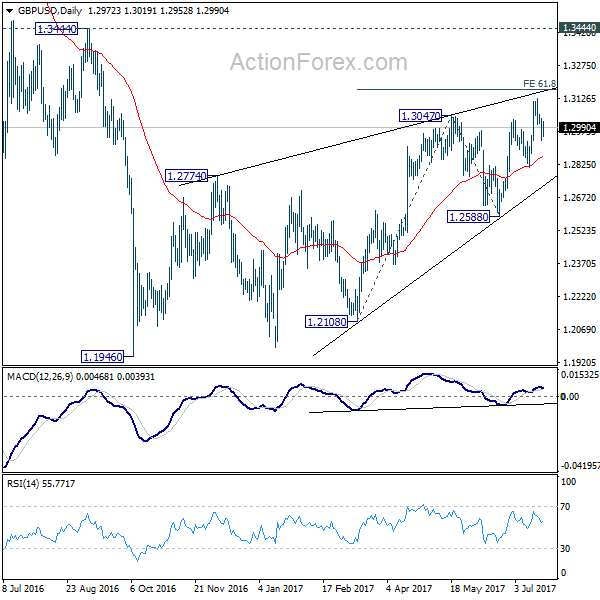
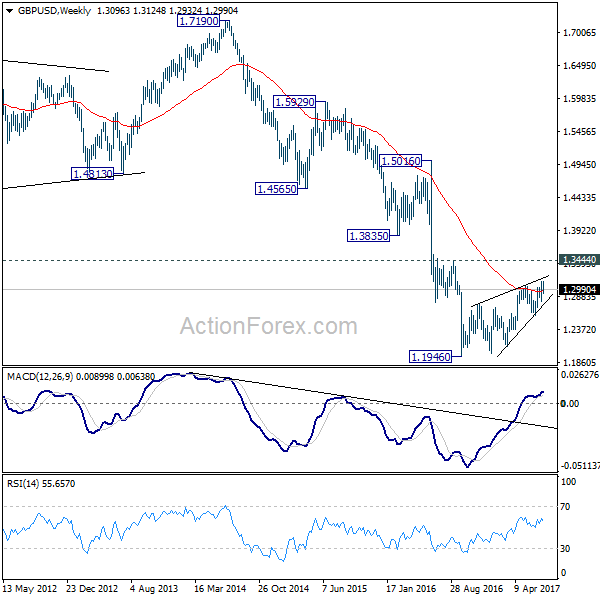
In the bigger picture, overall, price actions from 1.1946 medium term low are seen as a corrective pattern that is still in progress. While further upside is expected, overall outlook remains bearish as long as 1.3444 key resistance holds. Larger down trend from 1.7190 is expected to resume later after the correction completes. And break of 1.2588 will indicate that such down trend is resuming.
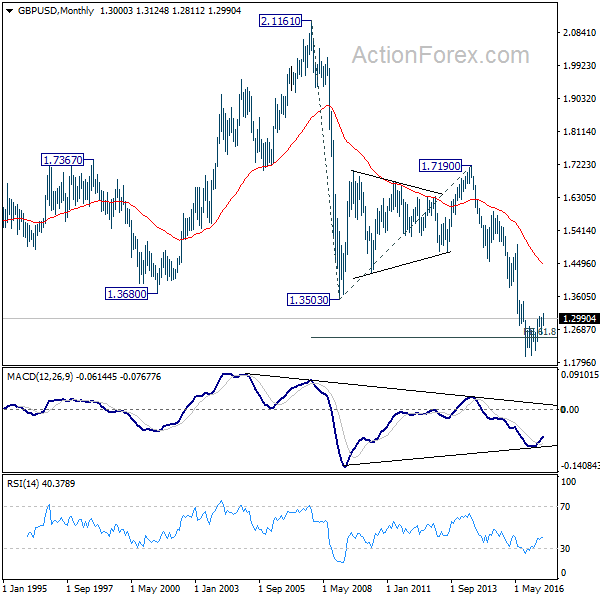
In the longer term picture, no change in the view that down trend from 2.1161 is still in progress. On resumption, such decline would extend deeper to 100% projection of 2.1161 to 1.3503 from 1.7190 at 0.9532. However, firm break of 1.3444 should confirm reversal and turn outlook bullish.
USD/CHF Weekly Outlook
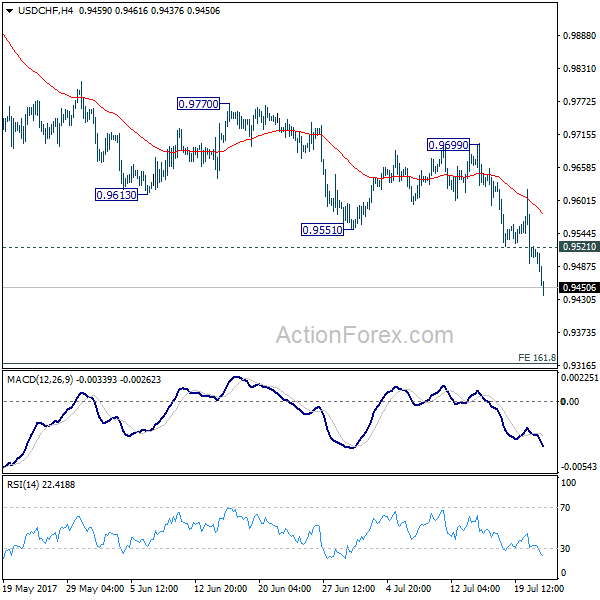
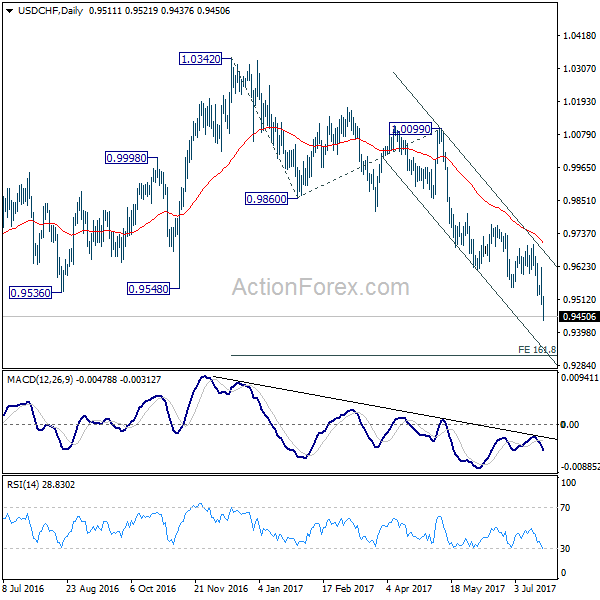
USD/CHF's fall accelerated to as low as 0.9437 last week and breached 0.9443 key support. There is no sign of bottoming yet. Initial bias remains on the downside. Firm break of 0.9443 key support will extend the down trend from 1.0342 to 161.8% projection of 1.0342 to 0.9860 from 1.0099 at 0.9319. On the upside, above 0.9521 minor resistance will turn bias neutral. But outlook will remain bearish as long as 0.9699 resistance holds.
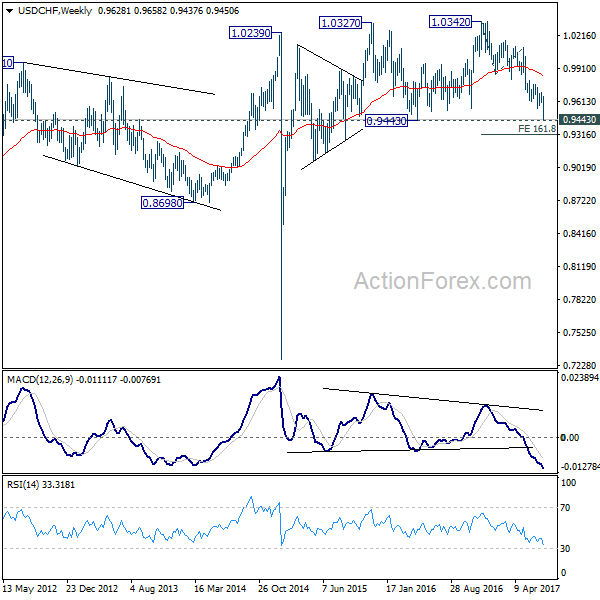
In the bigger picture, focus is now back 0.9443 key support level. Sustained break there indicate underlying bearish momentum and would target 0.9 handle and possibly below. Meanwhile, strong rebound from current level and break 0.9699 resistance will extend long term range trading between 0.9443/1.0342.
AUD/USD Weekly Outlook
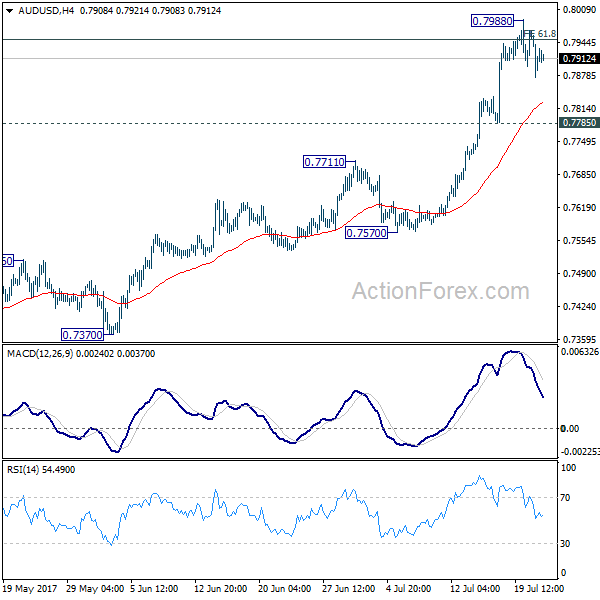
AUD/USD's rally continued last week and reached as high as 0.7988, meeting 61.8% projection of 0.6826 to 0.7833 from 0.7328 at 0.7950. A temporary top is formed there. Initial bias is neutral this week for consolidation first. Near term outlook will remain bullish as long as 0.7785 support holds and another rise is expected. Break of 0.7988 will target 100% projection at 0.8335 next. However, break of 0.7785 will argue that deeper pull back in under way and could target 55 day EMA (now at 0.7628).
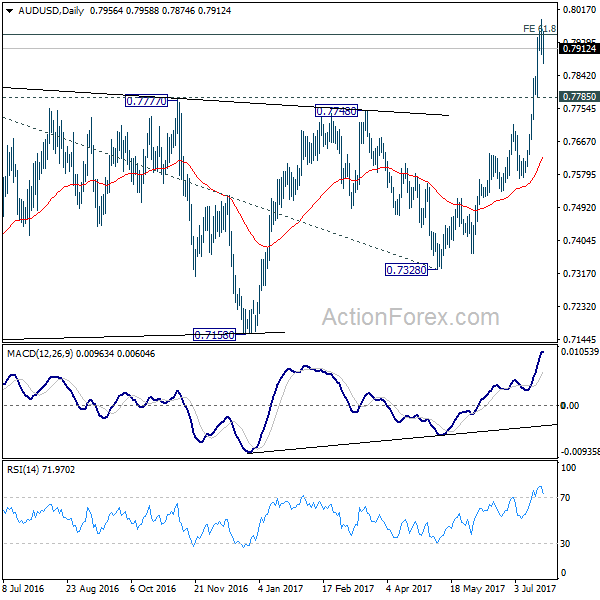
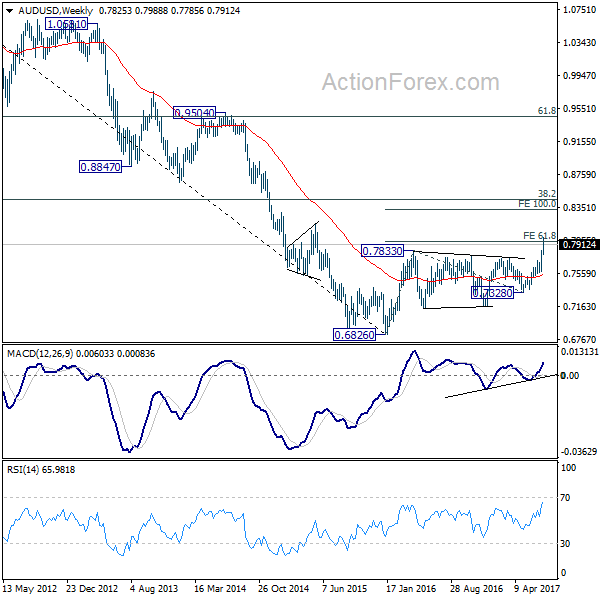
In the bigger picture, current development suggests that rebound from 0.6826 is developing into a medium term rise. There is no confirmation of trend reversal yet and we'll continue to treat such rebound as a corrective pattern. But in any case, further rise is now expected to 55 month EMA (now at 0.8100) or even further to 38.2% retracement of 1.1079 to 0.6826 at 0.8451. Break of 0.7328 support is needed to confirm completion of the rebound. Otherwise, further rise is now expected.
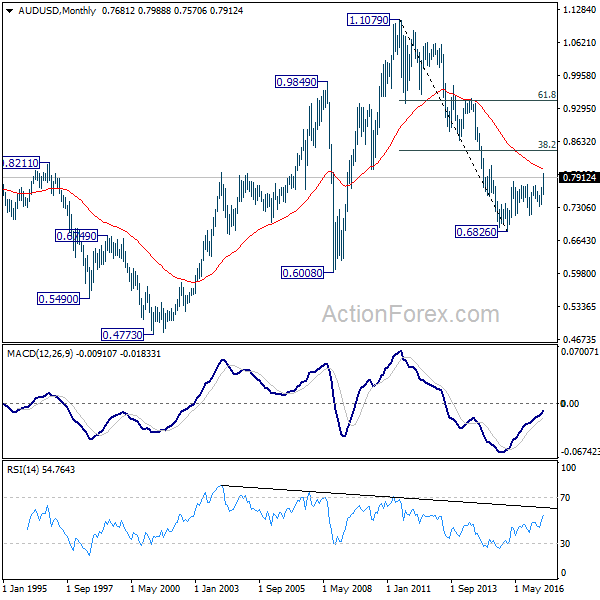
In the longer term picture, 0.6826 is seen as a long term bottom. Rise from there could either reverse the down trend from 1.1079, or just develop into a corrective pattern. At this point, we're favoring the latter. And, as long as 38.2% retracement of 1.1079 to 0.6826 at 0.8451 holds, we'd anticipate another decline through 0.6826 at a later stage.
USD/CAD Weekly Outlook
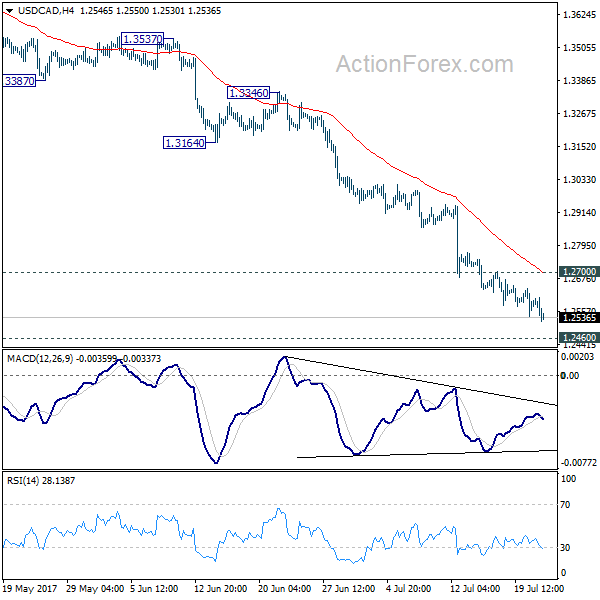
USD/CAD continued to lose downside momentum last week. But after all, the down trend still extended. Initial bias stays on the downside this week for 1.2460 low. Considering bullish convergence condition in 4 hour MACD, we'll be cautious on strong support from there to contain downside and bring rebound. On the upside, break of 1.2700 resistance will indicate short term bottoming and turn bias back to the upside for 1.2968 support turned resistance.
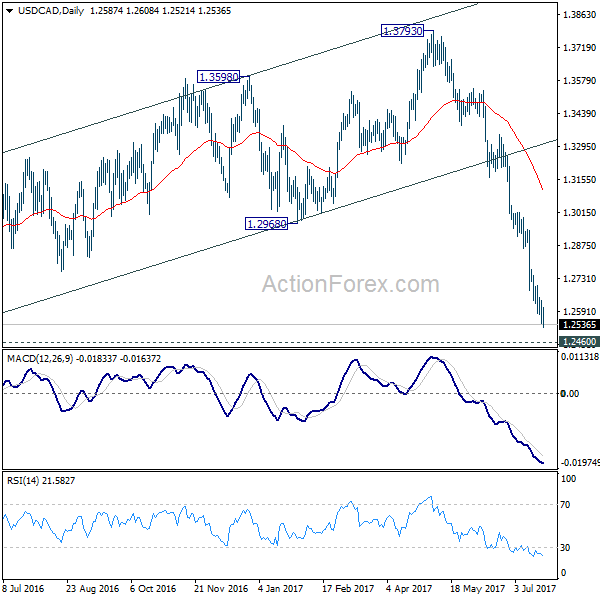
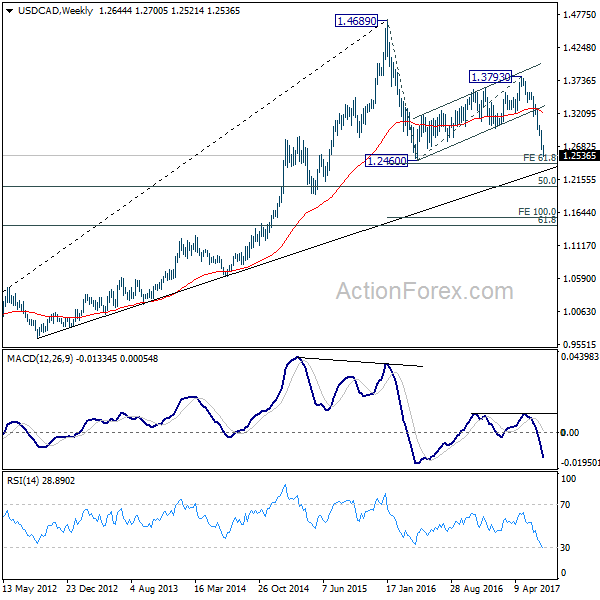
In the bigger picture, price actions from 1.4689 medium term top are seen as a correction pattern. Fall from 1.3793 is seen as the third leg and should target 50% retracement of 0.9406 to 1.4869 at 1.2048. At this point, we'd look for strong support from there to contain downside and bring rebound. However, firm break there will target 100% projection of 1.4689 to 1.2460 from 1.3793 at 1.1564.
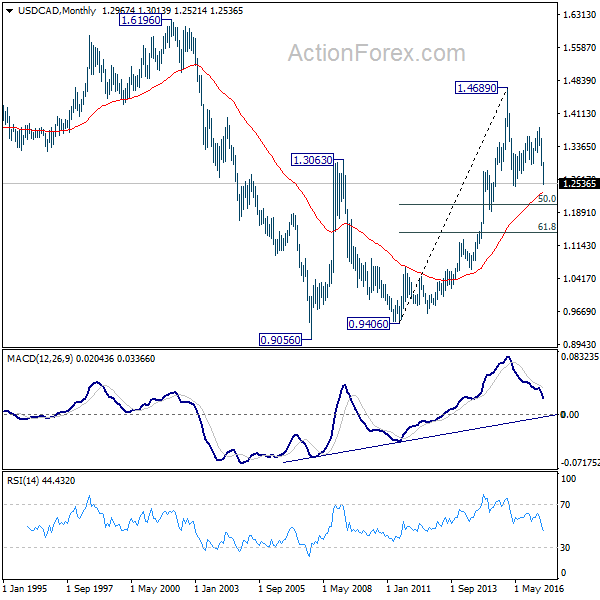
In the longer term picture, rise from 0.9056 (2007 low) is viewed as a long term up trend. It's taking a breath after hitting 1.4689. But such rise expected to resume later to test 1.6196 down the road. But firm break of 50% retracement of 0.9406 to 1.4869 at 1.2048 will raise doubt over this view.
GBP/JPY Weekly Outlook
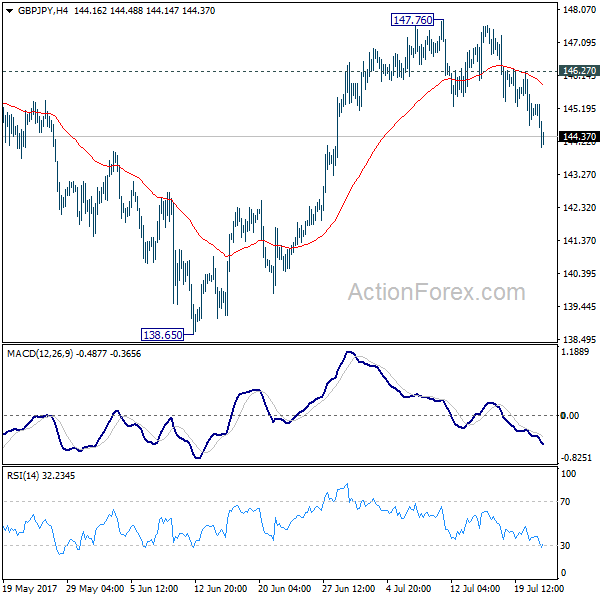
GBP/JPY's decline and break of 145.25 support last week clear up the outlook. Rise from 1.3865 should have completed at 147.76 after failing 148.09/42 resistance zone. Initial bias stays on the downside this week. Sustained trading below 55 day EMA (now at 144.04) will target 138.65 support and below. But we'd expect strong support from 135.58 to contain downside and bring rebound. On the upside, above 146.27 minor resistance will turn bias back to the upside for 147.76 instead.
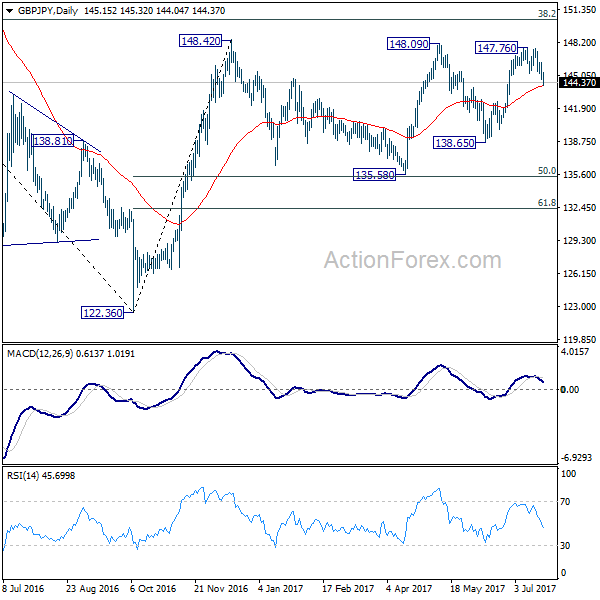
In the bigger picture, rise from medium term bottom at 122.36 is expected to continue to 38.2% retracement of 196.85 to 122.36 at 150.43. Decisive break there will carry long term bullish implications and pave the way to 61.8% retracement at 167.78. In case the sideway pattern from 148.42 extends, we'd be looking for strong support from 135.58 and 50% retracement of 122.36 to 148.42 at 135.39 to contain downside.
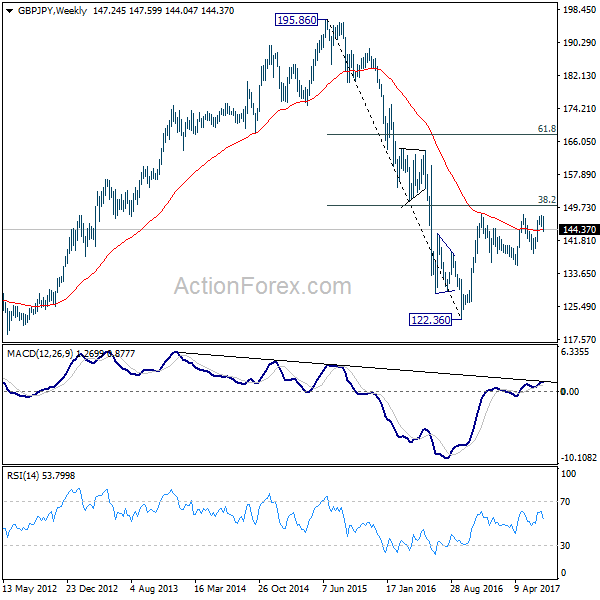
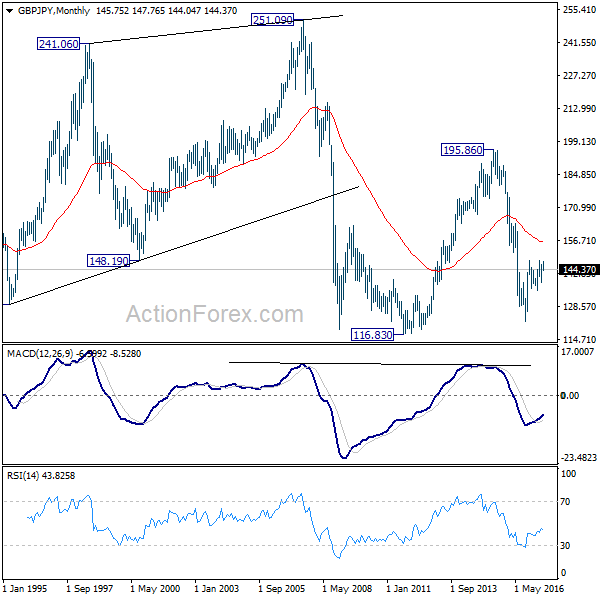
In the longer term picture, it remains to be confirmed is whole down trend from 195.86 has completed at 122.36 already and there is no confirmation yet. But in any case, firm break of 38.2% retracement of 195.86 to 122.36 at 150.43 would pave the way to 61.8% retracement at 167.78. And with that, the 55 month EMA will be firmly taken out which suggests that price actions from 116.83 is indeed a sideway pattern that could last more than a decade.
EUR/JPY Weekly Outlook
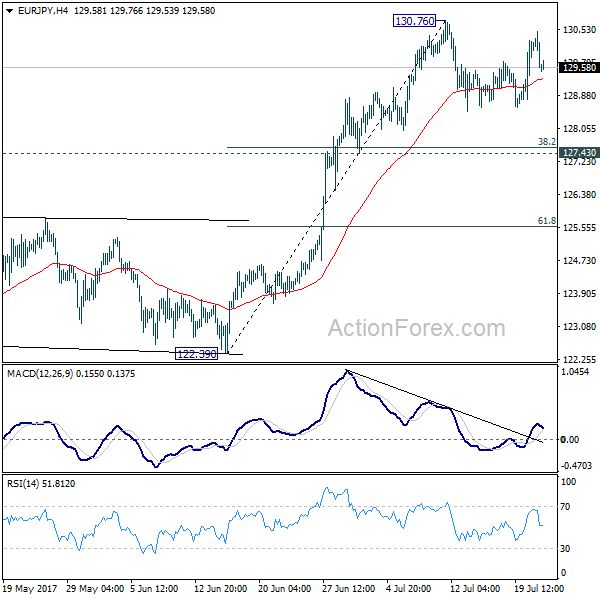
EUR/JPY continued to engage in consolidation below 130.76 last week and outlook is unchanged. Initial bias remains neutral this week first. In case of another fall, downside should be contained by 127.43 cluster support (38.2% retracement of 122.39 to 130.76 at 127.56) and bring rebound. Above 130.76 will extend the larger rally to next key fibonacci level at 134.20.
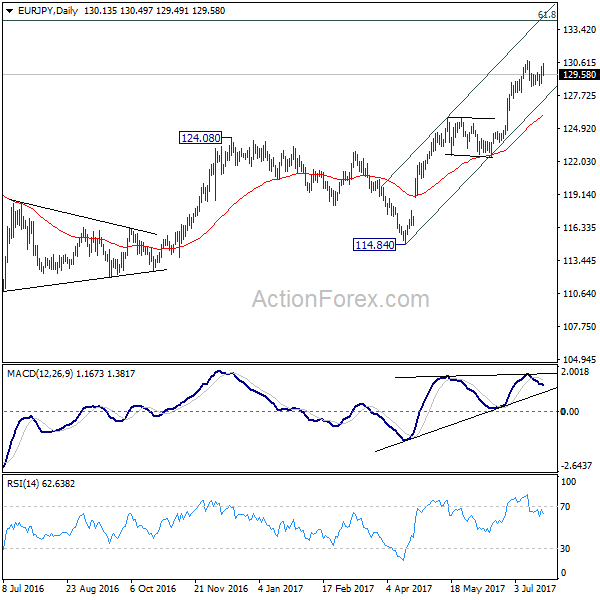
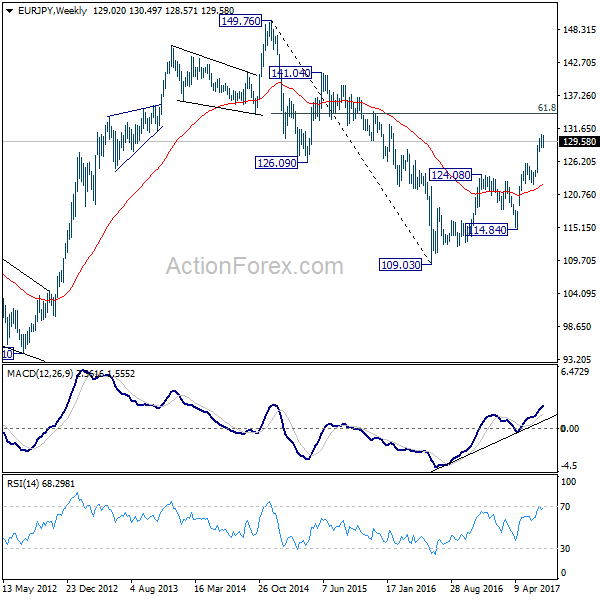
In the bigger picture, the down trend from 149.76 (2014 high) is completed at 109.03 (2016 low). Current rally from 109.03 should be at the same degree as the fall from 149.76 to 109.03. Further rise is expected to 61.8% retracement of 149.76 to 109.03 at 134.20. Sustained break there will pave the way to key long term resistance zone at 141.04/149.76. Medium term outlook will remain bullish as long as 124.08 resistance turned support holds.
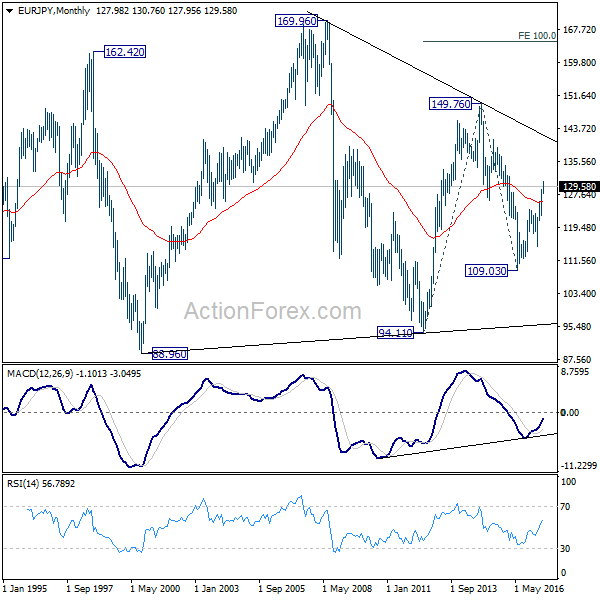
In the long term picture, at this point, there is no clear indication that rise from 109.03 is resuming that from 94.11. Hence, we'd be cautious on topping below 149.76 to extend range trading. Nonetheless, firm break of 149.76 will indicates strong underlying buying. In such case, EUR/JPY will target 100% projection of 94.11 to 149.76 from 109.03 at 164.68.
EUR/GBP Weekly Outlook
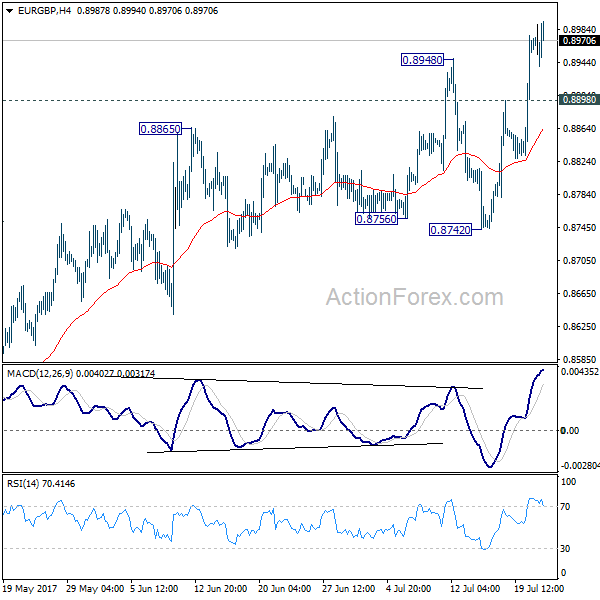
EUR/GBP's rally and break of 0.8948 resistance last week indicates resumption of whole rally from 0.8312. Initial bias stays on the upside this week. Current rise would now target a test on 0.9304 high. There is no clear sign of up trend resumption yet. Hence, we'll be cautious on strong resistance from 0.9304 to limit upside and bring another fall. On the downside, below 0.8898 minor support will turn intraday bias neutral first. But near term outlook will remain mildly bullish as long as 0.8742 support holds.
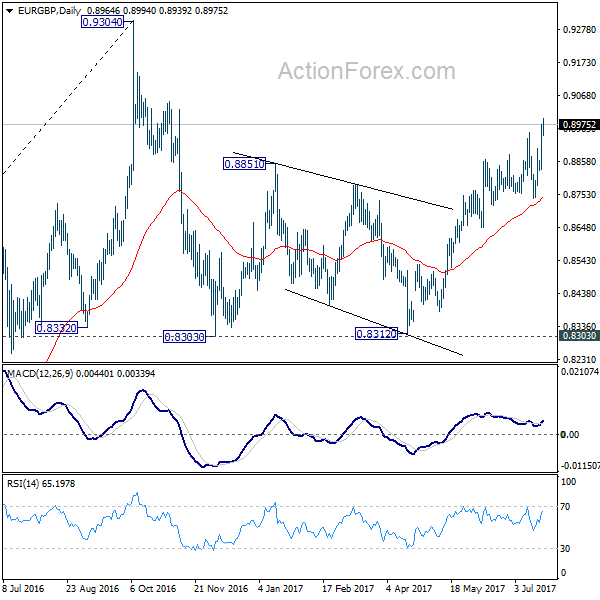
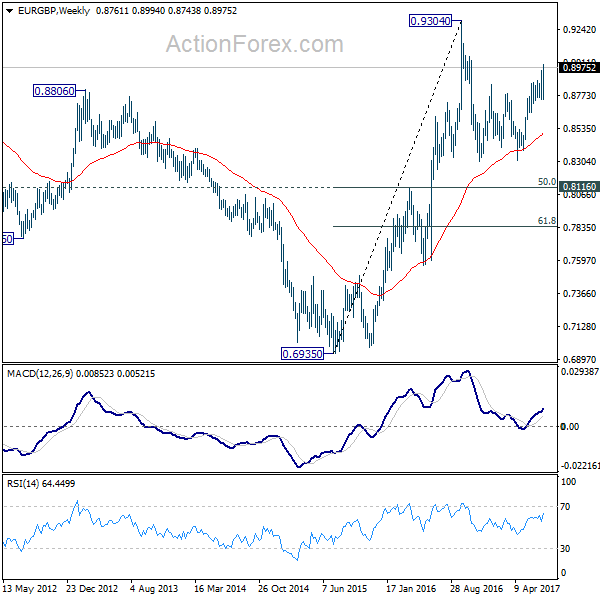
In the bigger picture, price actions from 0.9304 are viewed as a medium term corrective pattern. It's uncertain whether it is finished yet. But in case of another fall, we'd expect strong support from 0.8116 cluster support (50% retracement of 0.6935 to 0.9304 at 0.8120) to contain downside and bring rebound. Whole up trend from 0.6935 is expected to resume after consolidation from 0.9304 completes.
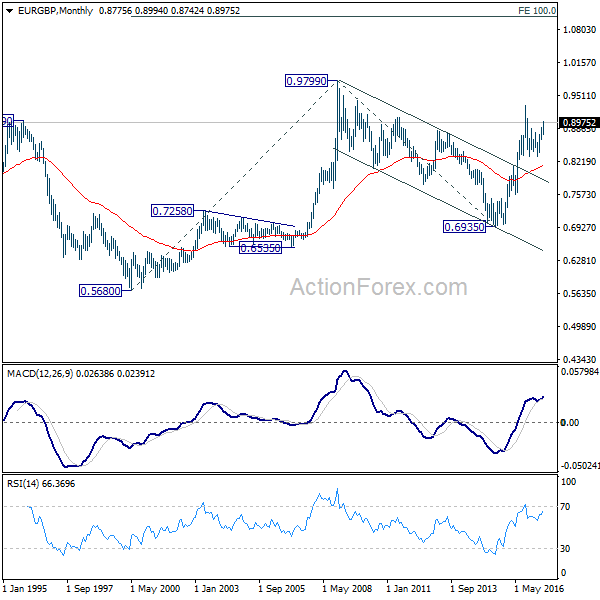
In the long term picture, firstly, price action from 0.9799 (2008 high) is seen as a long term corrective pattern and should have completed at 0.6935 (2015 low). Secondly, rise from 0.6935 is likely resuming up trend from 0.5680 (2000 low). Thirdly, this is supported by the impulsive structure of the rise from 0.6935 to 0.9304. Hence, after the correction from 0.9304 completes, we'd expect another medium term up trend to target 0.9799 high and above.
EUR/AUD Weekly Outlook
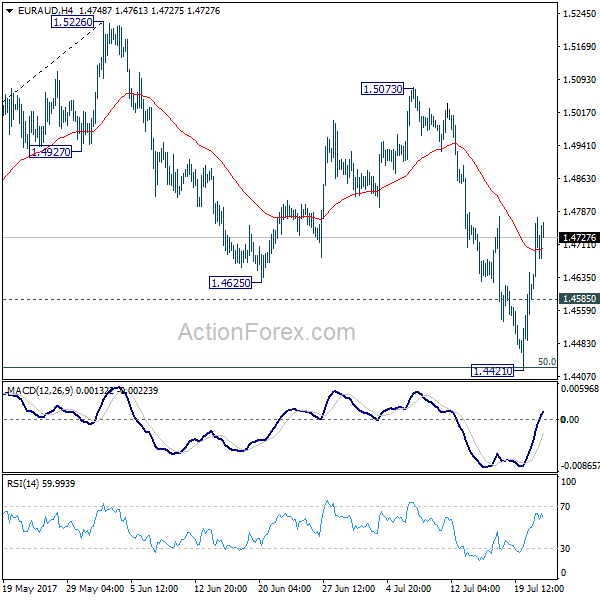
EUR/AUD dived to as low as 1.4421 last week but recovered strongly since then. The development argues that corrective pull back from 1.5226 has completed with three waves down to 1.4421, after hitting 50% retracement of 1.3624 to 1.5226 at 1.4225. Initial bias remains on the upside this week for 1.5073 resistance first. Break there will indicate resumption of whole rise from 1.3624 through 1.5226. On the downside, below 1.4585 minor support will turn focus back to 1.4421 instead.
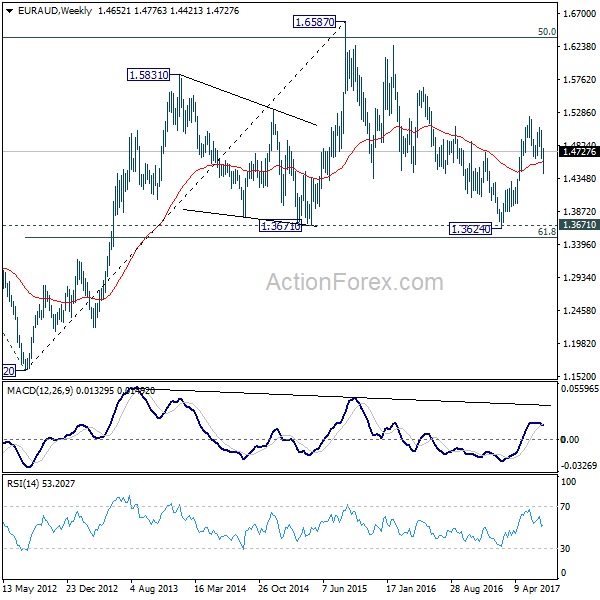
In the bigger picture, we're holding on to the view that corrective decline from 1.6587 medium term has completed at 1.3624. Rise from 1.3624 is expected to resume to retest 1.6587. The corrective structure of the fall from 1.5226 is affirming this view. Above 1.5226 will target a test on 1.6587 key resistance. However, another decline will dampen our view and would drag EUR/AUD lower to retest key support zone around 1.3624.
In the longer term picture, the rise from 1.1602 long term bottom isn't over yet. We'll keep monitoring the development but there is prospect of extending the rise to 61.8% retracement of 2.1127 to 1.1602 at 1.7488 and above. However, sustained trading below 1.3671 should confirm trend reversal and target 1.1602 long term bottom again.


EUR/CHF Weekly Outlook
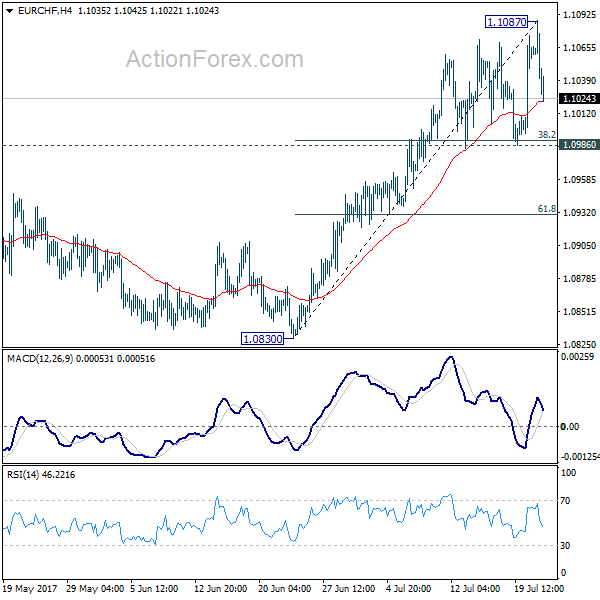
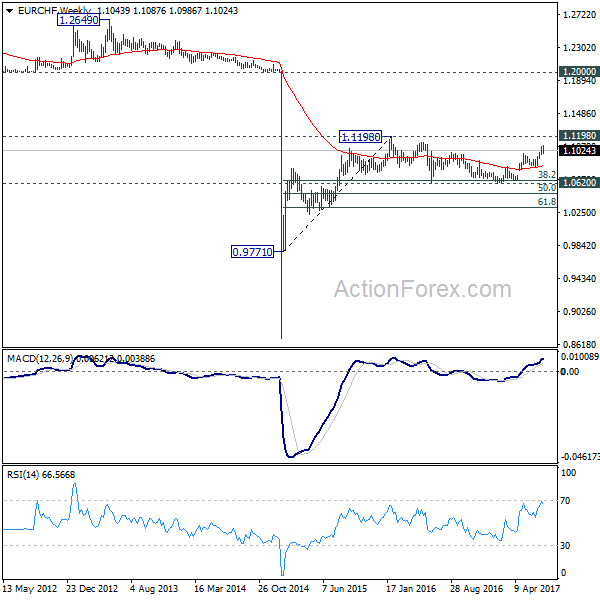
EUR/CHF edged higher to 1.1087 last week but quickly lost momentum. Initial bias is neutral this week first for consolidation. Downside of retreat should be contained by 1.0986 cluster support (38.2% retracement of 1.0830 to 1.1087 at 1.0989) and bring rise resumption. Break of 1.1087 will target key resistance at 1.1127/98. However, break of 1.0986/89 will indicate short term topping, possibly on bearish divergence condition in dail MACD. In such case, deeper fall would be seen back to 55 day EMA (now at 1.0918) and below.
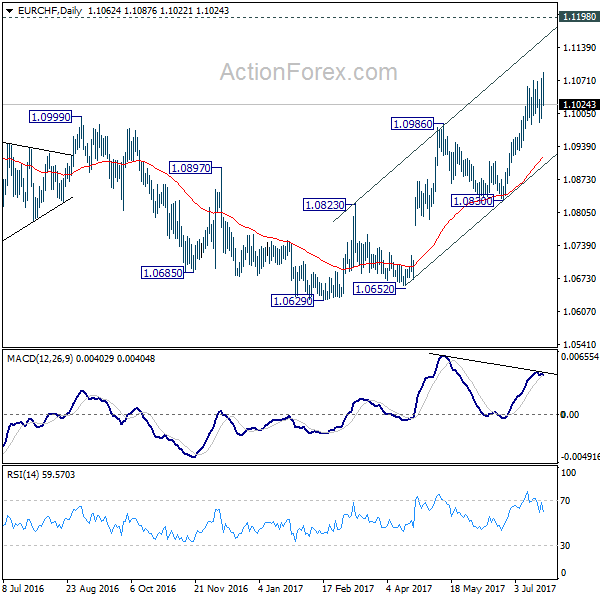
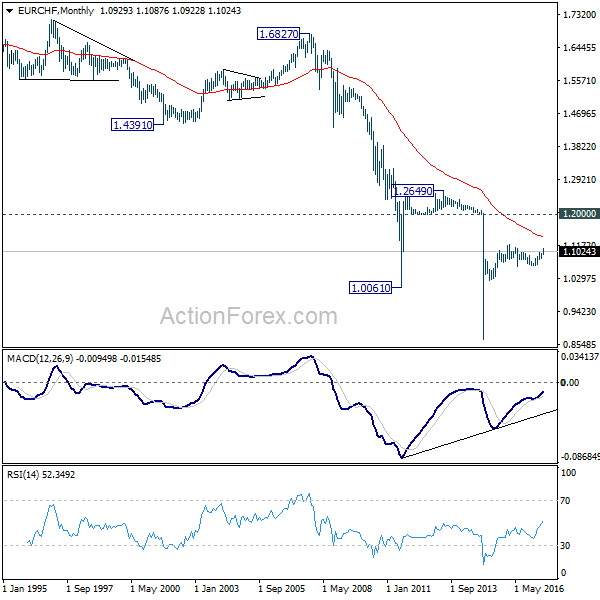
In the bigger picture, the price actions from 1.1198 are seen as a corrective move. Such correction could have completed after defending 38.2% retracement of 0.9771 to 1.1198 at 1.0653. Decisive break of 1.1198 will resume the long term rise from SNB spike low back in 2015. In such case, EUR/CHF could eventually head back to prior SNB imposed floor at 1.2000. We'll favor this bullish case as long as 1.0830 support holds. However, rejection from 1.1198 will extend the multi-year range trading with another fall.
Euro Surged to Two Year High on ECB, Dollar Looks to FOMC for Rescue
Another week of much volatility in the forex markets. Euro surged to two year high against Dollar as markets took ECB's message as a nod to stimulus withdrawal down the road. The common currency ended as the second strongest one, just next to it's cousin Swiss Franc. On the other hand, Sterling fell broadly as rate hike speculations were dented by much lower than expected CPI reading. Dollar followed closely as markets were getting more dissatisfied with US President Donald's lack of progress in tax reforms. Much volatility was also seen in Australian Dollar on RBA rhetorics. Canadian Dollar also gained against the greenback but is seen as losing momentum.
Dollar broadly lower as markets continued to lose faith on Trump
Dollar has been under much selling pressure last week since the collapse of Trumpcare, which would suppose replace Obamacare, in Senate in the early part of the week. Selling intensified partly due to Euro's strength. But more importantly, markets were getting increasing impatient with the lack of progress in US President Donald Trump's work on the economy, due to persistent political distractions. Failure to repeal Obamacare despite majority in the Congress was seen as a proof of lack of political leadership. In addition, the expansion of probe of possible Russian tie during last years campaign suggests that such distraction is not going to end soon. The news on Friday that White House press secretary Sean Spicer resigned certainly wouldn't steady the ship.
FOMC meeting will be a key to watch this week. While markets are not expecting any change in monetary policies, they will, for sure, be eager to get hints on what Fed would do in the September meeting. Fed could either raise federal fund rates by another 25bps to 1.25-1.50%, or announce the plan to shrink the balance sheet, or do nothing. Fed fund futures continue to price in less than 10% change of a September hike. But, the Fed might only have minor tweak in the languages on the economy and leave itself with the flexibility until September. If that's the case, markets will look into GDP report to be released on Friday for more guidance.
Dollar index's fall accelerated to as low as 93.85 last week and closed there. Decline from 103.82 is seen as correcting the long term up trend from 2011 low at 72.69, no change in this view. We are expecting strong support from 91.91 key cluster level, 38.2% retracement of 72.69 to 103.82 at 91.93 to contain downside and bring rebound. But the current downside acceleration is making this level vulnerable. For now, near term outlook will stay bearish as long as 96.32 resistance holds. Sustained break of 91.913, could open up deeper fall to next cluster level at 61.8% retracement at 84.58 before completion. Meanwhile, break of 96.32 will be the first sign of reversal and will turn focus to 55 week EMA (now at 98.05).
Euro surged but DAX dive on ECB
To recap ECB kept the main refi rate, the marginal lending rate and the deposit rate unchanged at 0%, 0.25% and -0.40% respectively. The central bank also affirmed that the QE program would be maintained at the monthly pace of 60B euro, which is "intended to run until the end of December 2017, or beyond, if necessary, and in any case until the Governing Council sees a sustained adjustment in the path of inflation consistent with its inflation aim". While leaving the policies and statement unchanged, Draghi promised QE discussions to begin in autumn. However, he refused to comment whether it means the September 7 meeting. That is seen as the main driver of Euro's rally. More in EURUSD Rallied to Fresh 14-Month High as Draghi Promised QE Discussions in Autumn.
While ECB is believed to be on course to withdraw monetary stimulus, or least, taper asset purchase next year, the surge in Euro could complicate the picture. European investors were clearly unhappy with Euro's appreciation with consideration that it could hurt exports. This could easily be seen in the selloff in German DAX towards the end of the week. The decline from 12951.54 resumed last week and closed at 122.40.06 after steep fall. For the moment, such fall is viewed as a corrective move only. And strong support is expected strong 11941.57 cluster (38.2% retracement of 10402.59 to 12951.54 at 11977.84) to contain downside and bring rebound. However, firm break of the level would be a sign of trend reversal. That could be an indication that the economy is not ready for stimulus withdrawal yet and could derail ECB's path.
AUD/JPY closed higher but after RBA minutes and BoJ, but lost momentum
BoJ left monetary policies unchanged as widely expected. Short term policy interest rate was held at -0.1%. The central bank also maintained the annual pace of asset purchase at JPY 80T to keep 10 year JGB yield at around 0%. Meanwhile, BoJ noted in the quarterly report that "recent price developments have been relatively weak, as companies remained cautious in raising wages and prices." And, "risks to the economy and price outlook are skewed to the downside." Also as widely expected, BoJ lowered inflation projections and raised growth projections. The timing for meeting 2% inflation target is pushed back for the sixth time. BoJ now expects inflation to hit target in the fiscal year ending March 2020. More in BOJ Left Rates and Asset Purchases Unchanged. Pushed Back Timing to Reach +2% Inflation.
Australian dollar was boosted earlier in the week as RBA minutes revealed discussion that the neutral nominal rate should be at 3.50%. The minutes was taken by the markets as a hawkish turn in the central bank. However, Aussie then reversed after RBA Deputy Governor Guy Debelle urged the markets not to read too much into the board's discussion on neutral rate. He said that "no significance should be read into the fact the neutral rate was discussed at this particular meeting" And, "most meetings, the board allocates some time to discussing a policy-relevant issue in more detail, and on this occasion it was the neutral rate."
It should be noted that the discussion within the RBA board looked rather academic. They pointed out that the neutral real rate fell by around 150 bps to 1.00% after the global financial crisis in 2007/8. And with that, the neutral nominal rate is believed to be at 3.50%. And with easing risk aversion and improvement in potential growth rate, there is chance that the neural real rate will climb back to a more normal level.
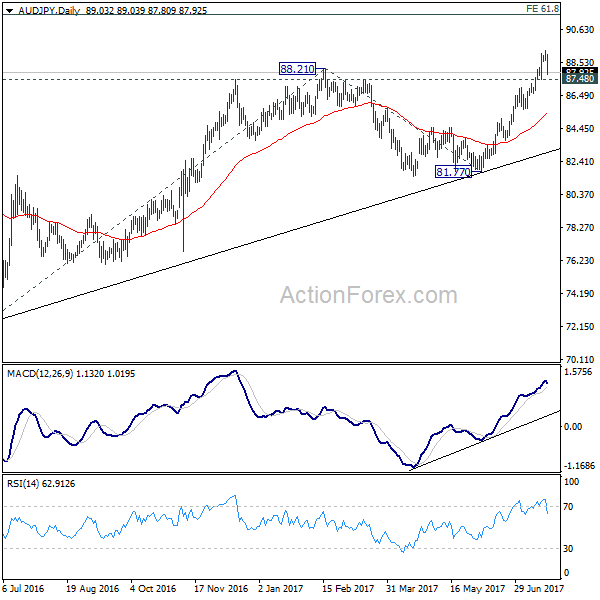
AUD/JPY surged to as high as 89.31 last week but reversed since then. Some consolidations would be seen but outlook will stay bullish as long as 87.48 support holds. We're still taking the break of 88.21 key resistance as resumption of the whole rise from 2016 low at 72.39. And further rally is expected to 61.8% projection of 72.39 to 88.21 from 81.77 at 91.54. However, break of 87.48 will dampen in the immediate bullish will and could drag AUD/JPY back to 55 day EMA (now at 85.43) first.
Canadian Dollar pull back possibly due
Canadian Dollar traded mixed last week but managed to extend gain against Dollar. The Loonie stayed firm after mixed inflation and retail sales data. There is, so far, no evidence to claim that BoC's decision to raise interest rate earlier this month was wrong. But there is no additional support for further rate hike yet. Indeed, USD/CAD is seen losing downside momentum in 4 hour MACD, as it approaches 1.2460 key support level.
In addition, WTI crude oil failed to sustain above 55 day EMA once again last week and the sharp fall on Friday carries some bearish implication. The structure of the rebound from 42.5 is so far corrective looking. And there was not enough follow through buying to keep it above 55 day EMA this time. The development is raising the risk of revisiting 42.5 low. Or even extending the large corrective fall from 55.24 to 50% retracement of 26.05 to 55.24 at 40.65. Overall, the risk of a pull back in Canadian Dollar, rebound in USD/CAD, is increasing.
Trading Strategy
Our GBP/CHF order was entered at 1.2610 last week stopped out at 1.2450, losing 160 pts. The strategy was totally wrong as the anticipated strength in Sterling didn't happen. We'll keep our hands off this week first and look at other opportunities later.
EUR/USD Weekly Outlook
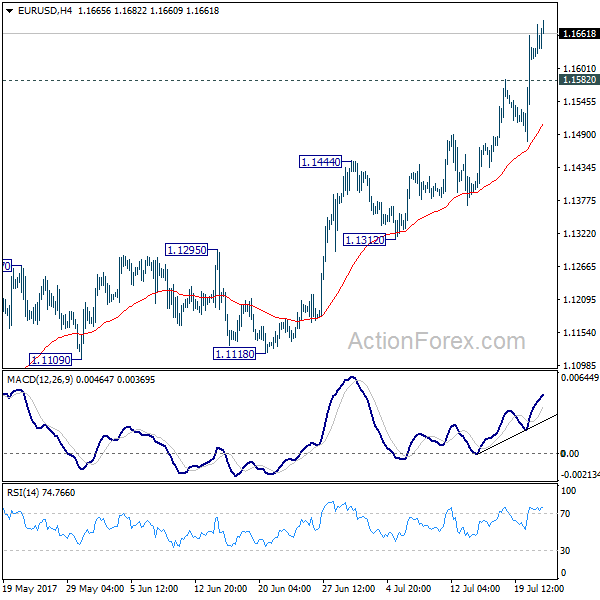
EUR/USD's rally accelerated to as high as 1.1682 last week and took out 1.1615 resistance. There is no sign on topping yet and initial bias remains on the upside. Current rise should now extend to 1.2 handle next. On the downside, below 1.1582 minor support will turn intraday bias neutral and bring consolidations. But downside should be contained by 1.1444 resistance turned support and bring rise resumption.
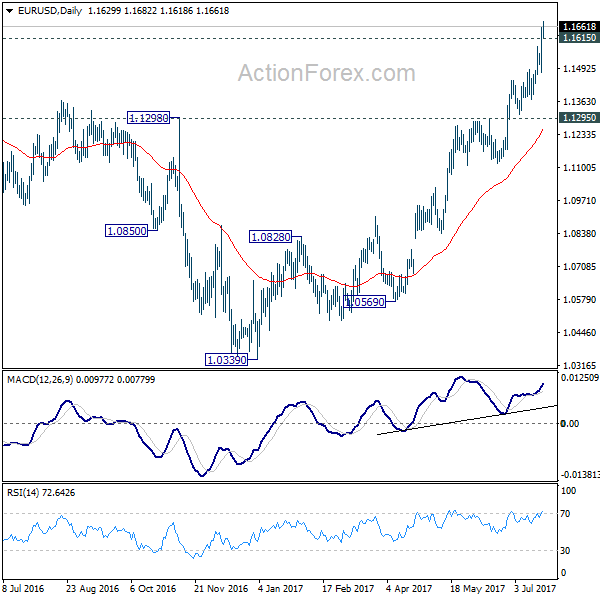
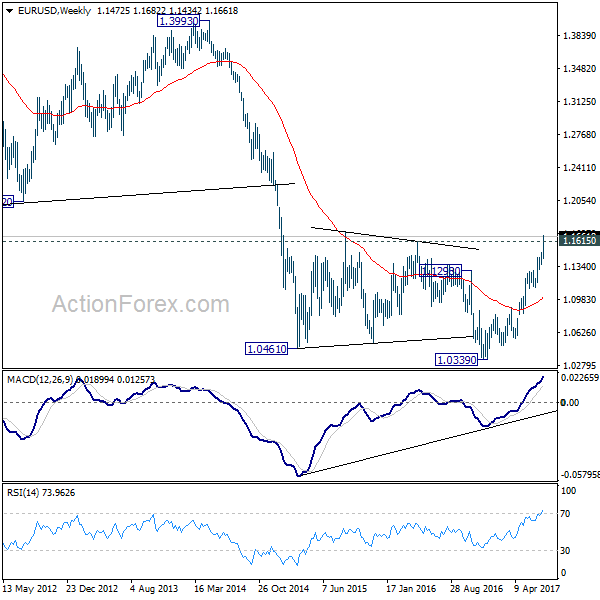
In the bigger picture, an important bottom was formed at 1.0339 on bullish convergence condition in weekly MACD. Sustained break of 55 month EMA (now at 1.1760) will pave the way to key fibonacci level at 38.2% retracement of 1.6039 (2008 high) to 1.0339 (2017 low) at 1.2516. While rise fro 1.0339 is strong, there is no confirmation that it's developing into a long term up trend yet. Hence, we'll be cautious on strong resistance from 1.2516 to limit upside. But for now, medium term outlook will remain bullish as long as 1.1295 support holds, in case of pull back.
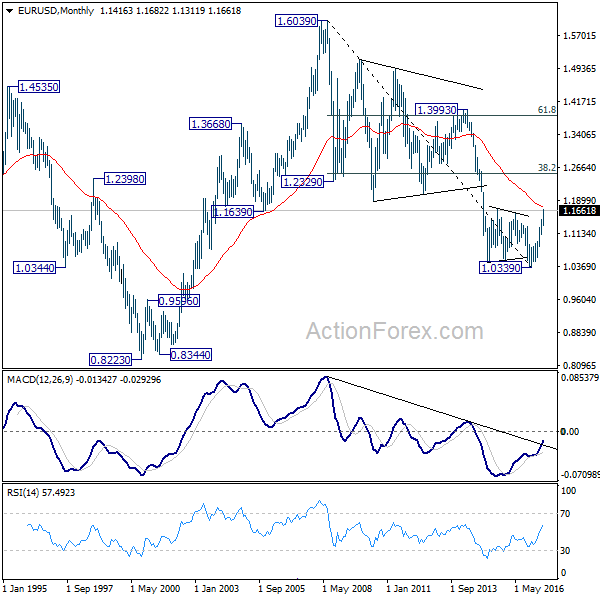
In the long term picture, 1.0339 is now seen as an important bottom as the down trend from 1.6039 (2008 high) could have completed. It's still early to decide whether price action form 1.0339 is developing into a corrective or impulsive move. But in either case, further rally would be seen to 38.2% retracement of 1.6039 to 1.0339 at 1.2516