
Sample Category Title
GOLD Short-Term Bullish Momentum Continues, SILVER Bullish, CRUDE OIL Upside Pressures Continue To Grow.
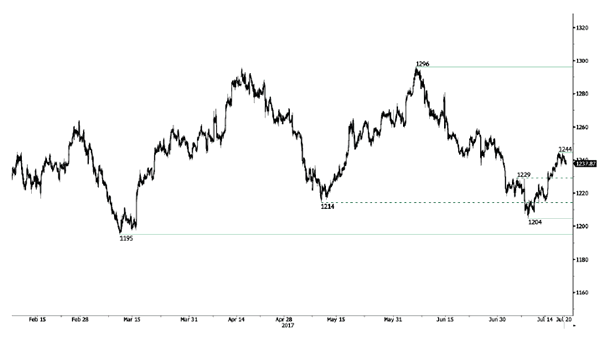
GOLD Short-term bullish momentum continues.
Gold's is trading higher after the precious metal reached the $1200 level. Hourly support is now given at $1204 (10/07/2017 high). Hourly resistance lies at 1244 (18/07/2017 high). Expected to show further strengthening.
In the long-term, the technical structure suggests that there is a growing upside momentum. A break of 1392 (17/03/2014) is necessary ton confirm it, A major support can be found at 1045 (05/02/2010 low)
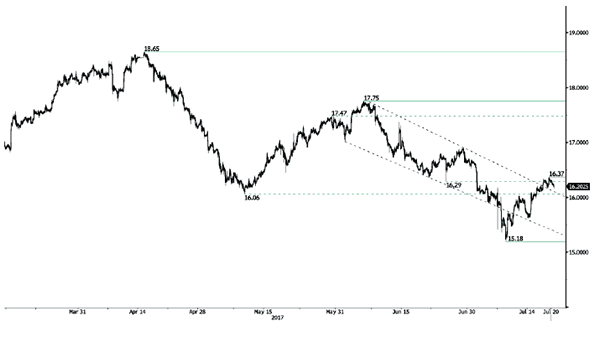
SILVER Bullish.
Silver is pushing higher after the bounce still bouncing from hourly support given at 15.18 (10/07/2017 low). Key resistance is given at a distance at 17.75 (06/06/2017 high). The commodity has broken the 16-mark. Expected to inch higher.
In the long-term, the death cross indicates that further downsides are very likely. Resistance is located at 25.11 (28/08/2013 high). Strong support can be found at 11.75 (20/04/2009).
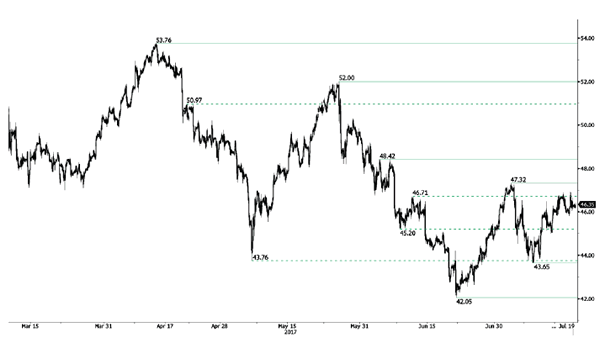
CRUDE OIL Upside pressures continue to grow.
Crude Oil is trading higher. Hourly support is given at 43.65 (10/07/2017 low). Expected to monitor resistance given at 47.32 (04/07/2017).
In the long-term, crude oil has recovered after its sharp decline last year. However, we consider that further weakness are very likely. Strong support lies at 35.24 (05/04/2016) while resistance can now be found at 55.24 (03/01/2017 high)
EUR/GBP Sideways Price Action, EUR/CHF Selling Pressures Arise, BITCOIN Moving Sideways.
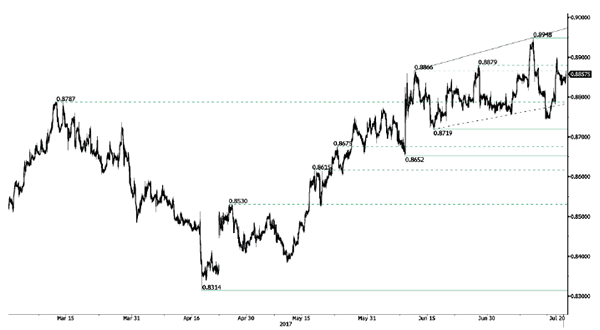
EUR/GBP Sideways price action.
EUR/GBP has failed to monitor strong support at 0.8719 (16/06/2017 low). The pair is moving sideways. Yet, expected to show renewed monitoring of support given at 0.8719.
In the long-term, the pair has largely recovered from recent lows in 2015. The technical structure suggests a growing upside momentum. The pair is trading above from its 200 DMA. Strong resistance can be found at 0.9500 psychological level.
EUR/CHF Selling pressures arise.
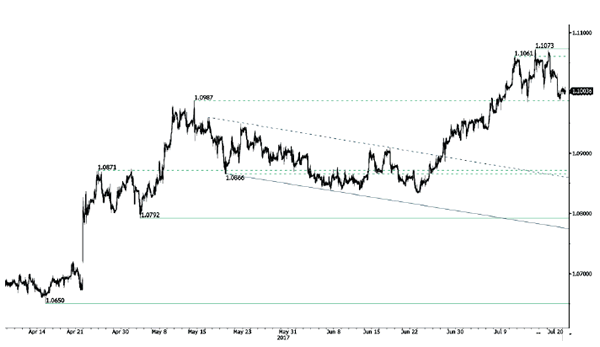
EUR/CHF is still trading above psychological level at 1.1000. Selling pressures are growing at the moment. Hourly support is located at a distance at 1.0922 (30/06/2017 low). Expected to inch higher.
In the longer term, the technical structure is mixed. Resistance can be found at 1.1200 (04/02/2015 high). Yet,the ECB's QE programme is likely to cause persistent selling pressures on the euro, which should weigh on EUR/CHF. Supports can be found at 1.0184 (28/01/2015 low) and 1.0082 (27/01/2015 low).
BITCOIN Moving sideways.
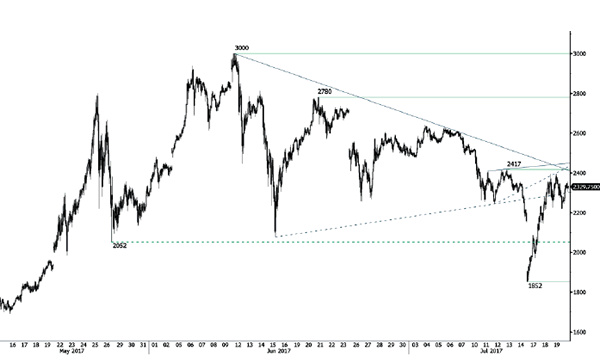
Bitcoin has well recovered after the sell-off this weekend. Strong hourly resistance can be found at 2417 (13/07/2017 high) and hourly support is now given at 1852 (14/07/2017 low). Expected to show some sustained short-term bullish momentum.
In the long-term, the digital currency has had an exponential growth. There are decent likelihood that the asset will consolidate above $1500. Long-term support is given at $1464 (04/05/2017 low).
Trade Idea: GBP/USD – Sell at 1.3050
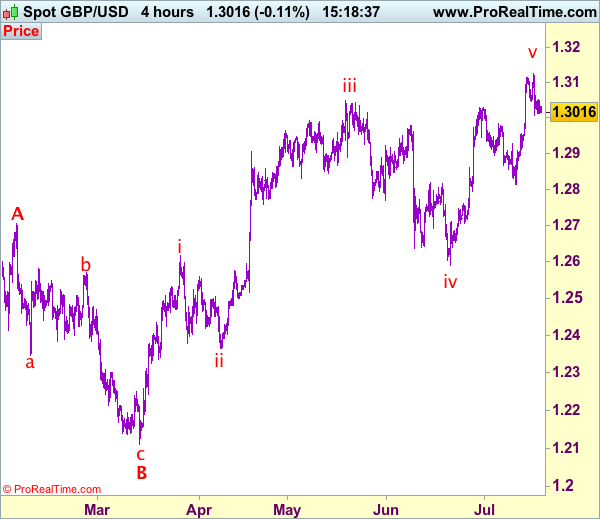
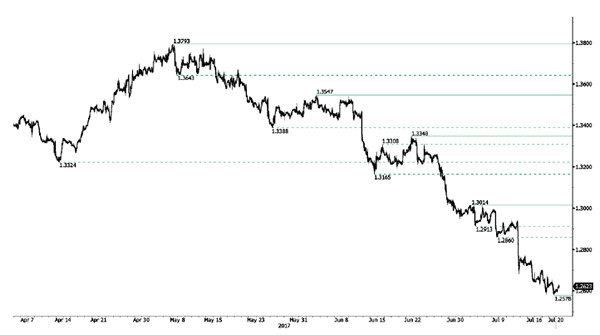
GBP/USD – 1.2970
Recent wave: Wave V of larger degree wave (III) has ended at 1.1986 and major correction has commenced from there for gain to 1.3000 and 1.3140-50
Trend: Near term up
Original strategy :
Sell at 1.3080, Target: 1.2880, Stop: 1.3140
Position: -
Target: -
Stop: -
New strategy :
Sell at 1.3050, Target: 1.2850, Stop: 1.3110
Position: -
Target: -
Stop:-
Cable’s retreat after early brie rise to 1.3126 has retained our view that a temporary top is possibly formed there and consolidation below this level is seen with mild downside bias for weakness to 1.2950, below there would bring test of 1.2910-15,, however, break there is needed to add credence to this view, bring retracement of recent rise to 1.2870-80 but reckon support at 1.2812 would remain intact, bring rebound later.
Our preferred count on the daily chart is that cable's rebound from 1.3500 (wave (A) trough) is unfolding as a wave (B) with A ended at 1.7043, followed by triangle wave B and wave C as well as wave (B) has ended at 1.7192, the subsequent selloff is the larger degree wave (C) which is still unfolding with minor wave (III) of larger degree wave 3 ended at 1.1986, hence wave (IV) correction is in progress which could either be a triangle wave (IV) of a complex formation but upside should be limited to 1.3500 and price should falter well below 1.4000, bring another decline in wave (V) of 3 for weakness to 1.1500, then 1.1200.
On the upside, whilst recovery to 1.3010-20 cannot be ruled out, price should falter below resistance at 1.3062 and bring another retreat later. A break above this week’s high of 1.3126 would signal recent upmove is still in progress and may extend headway to 1.3150, then towards 1.3190-00 but loss of upward momentum should limit upside to 1.3250, bring another retreat later.
USD/CHF Consolidating, USD/CAD Strong Selling Pressures, AUD/USD Pausing Before Another Leg Higher.
USD/CHF Consolidating.
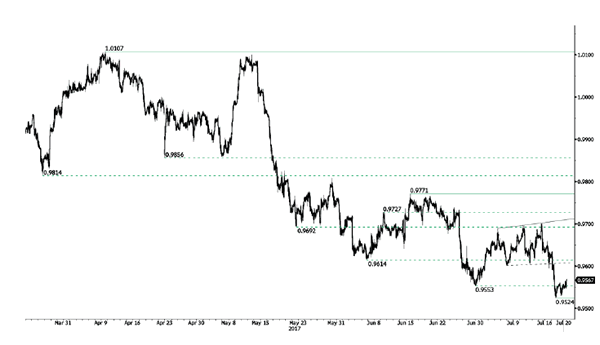
USD/CHF is pushing slightly higher since the pair broke support given at 0.9553 (30/06/2017 low). Hourly resistance can be found at 0.9696 (09/06/2017 high). Strong resistance is given at 1.0107 (10/04/2017 high). Expected to to show further weakness.
In the long-term, the pair is still trading in range since 2011 despite some turmoil when the SNB unpegged the CHF. Key support can be found 0.8986 (30/01/2015 low). The technical structure favours nonetheless a long term bullish bias since the unpeg in January 2015.
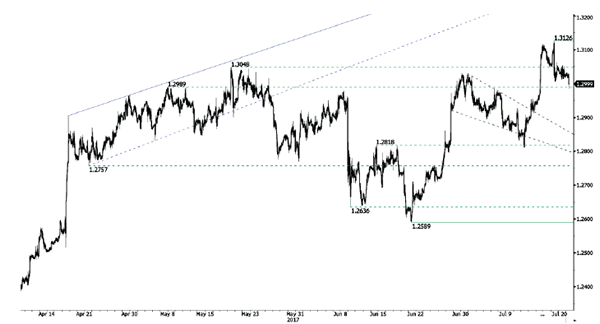
USD/CAD Strong selling pressures.
USD/CAD is going lower and the pair remains in a strong bearish momentum. Hourly support is given at 1.2578 (19/07/2017 low). Hourly resistance is given at 1.2701 (17/07/2017). Expected to show continued bearish pressures.
In the longer term, the pair lies in a bullish channel since a year. Strong resistance is given at 1.4690 (22/01/2016 high). Long-term support can be found at 1.2461 (16/03/2015 low).
AUD/USD Pausing before another leg higher.
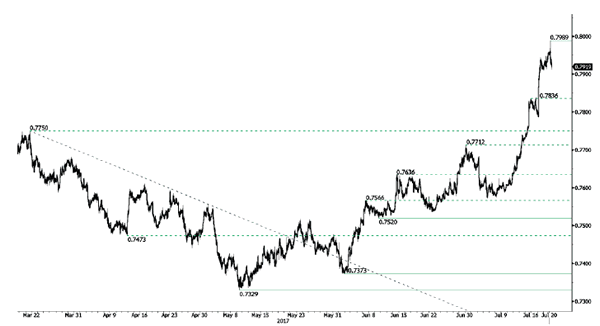
AUD/USD's technical structure is bullish since early May despite some consolidation move. Hourly resistance is given at 0.7989 (19/07/2017 high). Strong support is given at 0.7786 (18/07/2017 low).
In the long-term, we are waiting for further signs that the current downtrend is ending. Key supports stand at 0.6009 (31/10/2008 low) . A break of the key resistance at 0.8295 (15/01/2015 high) is needed to invalidate our long-term bearish view.
Trade Idea: GBP/JPY – Sell at 147.00
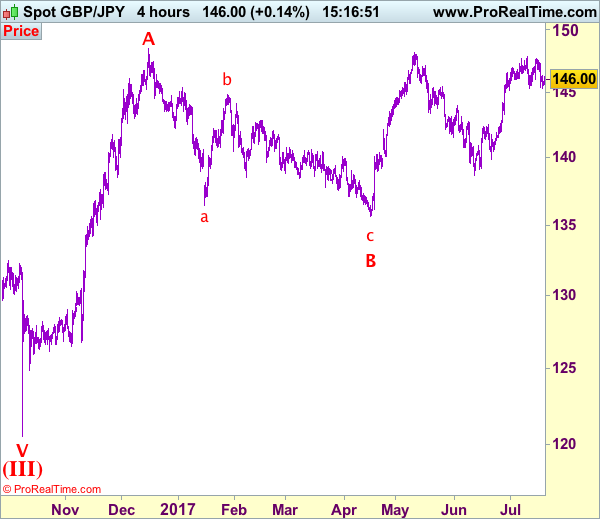
GBP/JPY - 145.66
Recent wave: Medium term low formed at 120.50 and (A)-(B)-(C) major correction has commenced with (A) leg ended at 148.45, hence wave (B) is unfolding for retreat to 131.00-10.
Trend: Near term up
Original strategy:
Sell at 147.00, Target: 145.00, Stop: 147.60
Position: -
Target: -
Stop: -
New strategy :
Sell at 147.00, Target: 145.00, Stop: 147.60
Position: -
Target: -
Stop:-
Sterling’s retreat after rising to 147.60 earlier this week suggests further consolidation below last week’s high at 147.75 would be seen and mild downside bias remains for for test of 145.30 support, however, a sustained breach below there is needed to signal top has been formed at 147.75, bring retracement of recent rise to 144.70, then 144.50 but 144.20 should limit downside and price should stay well above 143.30, bring rebound later.
In view of this, we are looking to sell sterling on recovery as 147.00 should limit upside, bring another decline. Above 147.60 would risk test of said resistance at 147.75 but break there is needed to revive bullishness and extend recent upmove to previous resistance at 148.10, above there would bring headway to 148.50, then towards 149.00.
Our preferred count is that larger degree wave V with circle is unfolding from 251.12 with wave (I) 219.34, (II): 241.38 and wave (III) is subdivided into 1: 192.60, 2: 215.89 (23 Jul 2008) and wave 3 ended at 118.87 earlier in 2009. The correction from there to 162.60 is wave 4 which itself is a double three and is labeled as first a-b-c ended at 151.53, followed by wave x at 139.03, 2nd a ended at 162.60, 2nd b at 146.75 and 2nd c leg of wave 4 ended at 163.00. Therefore, the decline from 163.00 to 116.85 is now treated as wave 5 which also marked the end of larger degree wave (III), hence wave (IV) major correction has commenced for retracement of the wave (III) from 241.38 and upside target at 183.95-00 (50% Fibonacci retracement of the wave (II) from 241.38) had been met, a drop below 160.00 would suggest wave (IV) has ended at 195.85, bring decline in wave (V) for initial weakness to 130 (already met) and 120.
EUR/USD Continued Bearish Consolidation, GBP/USD Continued Profit-Taking, USD/JPY Short-Term Rebound.
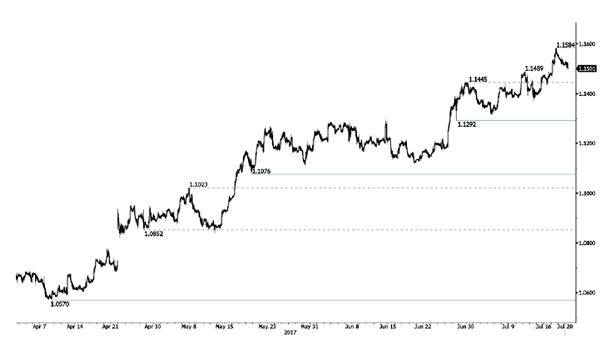
EUR/USD Continued bearish consolidation.
EUR/USD bearish pressures continue. Hourly resistance is given at 1.1584 (18/07/2017 high). Hourly support can be found at 1.1373 (13/07/2017 high). Stronger support lies at 1.1292 (28/06/2017 low). Expected to show renewed bullish pressures.
In the longer term, the momentum is clearly negative. We favour a continued bearish bias towards parity. Key resistance holds at 1.1714 (24/08/2015 high) while strong support lies at 1.0341 (03/01/2017 low).
GBP/USD Continued profit-taking.
GBP/USD has bounced below the 1.3000 mark. Hourly resistance is given at 1.3126 (16/07/2017 high). Support at 1.3047 (17/07/2017 low) has been broken. Expected to show continued bearish pressures.
The long-term technical pattern is even more negative since the Brexit vote has paved the way for further decline. Long-term support given at 1.0520 (01/03/85) represents a decent target. Long-term resistance is given at 1.5018 (24/06/2015) and would indicate a long-term reversal in the negative trend. Yet, it is very unlikely at the moment.
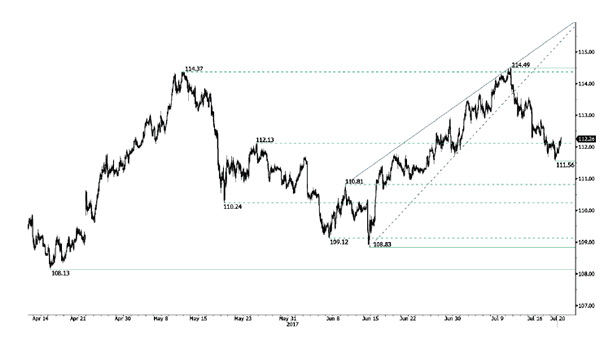
USD/JPY Short-term rebound.
USD/JPY still lies in a bearish momentum on going lower. Hourly support is given at 111.56 (19/07/2017 low). Stronger support is located at a distance at 108.13 (17/04/2017 low). Expected to show continued bearish pressures.
We favor a long-term bearish bias. Support is now given at 96.57 (10/08/2013 low). A gradual rise towards the major resistance at 135.15 (01/02/2002 high) seems absolutely unlikely. Expected to decline further support at 93.79 (13/06/2013 low).
Trade Idea: EUR/JPY – Sell at 129.70
EUR/JPY - 129.23
Recent wave: wave v of (C) ended at 94.12 and major correction in wave A has ended at 149.79
Trend: Near term up
Original strategy:
Sell at 129.50, Target: 127.50, Stop: 130.10
Position: -
Target: -
Stop: -
New strategy :
Sell at 129.70, Target: 127.70, Stop: 130.30
Position: -
Target: -
Stop:-
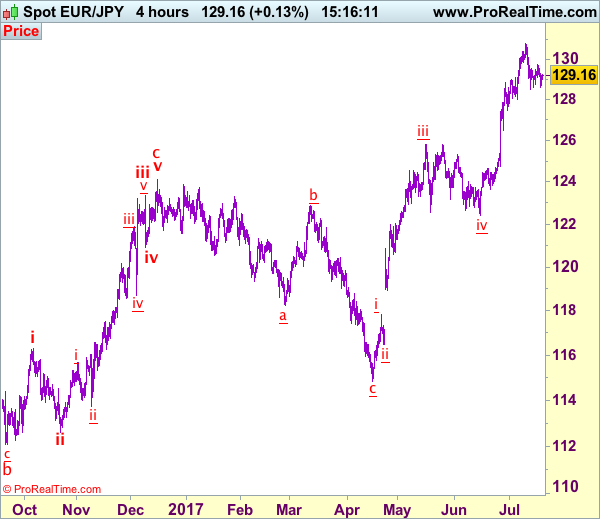
Although the single currency has rebounded after holding above indicated previous support at 128.49, suggesting further consolidation would be seen and gain to 129.50 cannot be ruled out, however, still reckon resistance at 129.75 would limit upside and bring another decline later, below said support at 128.49 would signal top has been formed at 130.77 early last week, bring retracement of recent upmove to 128.00, then towards previous support at 127.44 which is likely to hold from here.
In view of this, we are looking to sell euro on recovery as 129.75 resistance should limit upside. Above 130.10-15 would risk a stronger recovery but still reckon said resistance at 130.77 would hold from here, bring retreat later. Only break of 130.77 would signal recent upmove is still in progress and extend gain to 131.00, then 131.50-60.
Our latest preferred count is that wave (ii) is ABC-X-ABC which ended at 123.33 and wave (iii) is unfolding with wave iii ended at 100.77, followed by wave iv at 111.57 and wave v as well as the wave (iii) has ended at 97.04, followed by wave (iv) at 111.43 and wave (v) has ended at 94.12 which is also the end of the larger degree v, this also implied the major wave (C) has also ended there, hence major correction has commenced from there with (A) leg unfolding in its lower degree wave c which has possibly ended at 145.69. Under this count, A-B-C wave (B) has commenced with A leg ended at 136.23, wave B at 143.79 and wave C has possibly ended at 149.79.
Our larger degree count is that the decline from 139.26 is wave (C) and is sub-divided into a diagonal triangle i-ii-iii-iv-v with wave i - 105.44, wave ii- 123.33, wave iii - 97.03, wave iv - 111.43, followed by the final wave v as well as the end of wave (C) at 94.12, this also mark the bottom of larger degree wave B. Under this count, major rise in wave C has commenced as an impulsive wave with minor wave III ended at 145.69, wave V is still in progress for further gain to 150.00. Having said that, this so-called wave V could well be the first leg of larger degree 5-waver wave C and this wave C should bring at least a retest of wave A top at 169.97 (July 2008).
Trade Idea: AUD/USD – Buy at 0.7800
AUD/USD – 0.7920
Recent wave: Wave 5 ended at 1.1081 and major correction has commenced for fall to 0.7000 and then towards 0.6500-10
Trend: Near term up
Original strategy :
Buy at 0.7840, Target: 0.8000, Stop: 0.7780
Position: -
Target: -
Stop: -
New strategy :
Buy at 0.7800, Target: 0.7990, Stop: 0.7740
Position: -
Target: -
Stop:-
As aussie has retreated after rising to 0.7990, suggesting a minor top is possibly formed there and consolidation with initial downside bias is for correction to 0.7840-50, however, reckon downside would be limited to 0.7800 and support at 0.7786 should hold, bring another rise later, above 0.7950 would bring retest of 0.7990 but break of psychological resistance at 0.8000 is needed to retain our bullish count for recent impulsive waves (1 2, (i)(ii), i ii) to extend headway to 0.8040-50, however, price should falter below 0.8100.
In view of this, would not chase this rise here and we are looking to buy aussie on subsequent pullback as 0.7800 should limit downside, bring another upmove later. Below support at 0.7786 would defer and suggest wave iii top is formed, bring correction in wave iv to 0.7750 but wave i top at 0.7712 should remain intact.
On the 4-hour chart, the move from 0.8066 is the wave 5 with i: 0.8860, ii: 0.8315, wave iii is an extended move ended at 1.0183, iv: 0.9706 and wave v has ended at 1.1081 (also the top of entire wave 5). The subsequent selloff is the major correction which is unfolding as ABC-X-ABC and 2nd A leg has ended at 0.8848, followed by a-b-c wave B which ended at 0.9758, hence, 2nd C wave is now in progress and indicated downside target at 0.7000 and 0.6950 had been met, so further fall to 0.6710-20 cannot be ruled out.

One Hawkish Step At A Time?
Today, the spotlight will be on the ECB policy decision. Given that no change in policy is expected, market focus will probably be on whether the Bank will remove from its forward guidance the sentence that the QE programme can be expanded in terms of size and/or duration if necessary. Such a removal would likely set the stage for a formal announcement in September that QE-tapering may begin by the turn of the year.
We see three scenarios that can play out. In the hawkish one, the Bank removes that sentence altogether, heightening speculation that a tapering announcement may be looming and consequently, sending the euro higher. EUR/USD slid yesterday and is currently trading near the support of 1.1485 (S1), but the price structure still suggests a short-term uptrend. In this scenario, the pair could rebound from near 1.1485 (S1) and perhaps challenge once again Tuesday's high of 1.1585 (R1).
In the less-hawkish scenario, the ECB may decide to remove only the signal that the QE programme can be expanded in terms of size, but keep the bias that it can be extended, thereby allowing itself some room for maneuvering. Even though this would still be a hawkish shift, the euro's reaction may be negative. Investors looking for a complete removal of the QE bias may be left disappointed and perhaps lock in some profits on their prior euro long positions. EUR/USD could continue its slide and perhaps break below the 1.1485 (S1) line, aiming for the upside support line drawn from the low of the 23rd of June, or our next support of 1.1435 (S2).
Finally, in the dovish case, policymakers decide to be patient and wait for the September meeting to make any further changes to their bias. This could lead to a significant downside in EUR, as investors push back their expectations regarding the timing of QE-tapering. Something like that may cause EUR/USD to collapse and bring a short-term trend reversal. Having said that though, we don't expect this to lead to a reversal in longer-term horizons. We would treat a possible near-term reversal as a corrective phase of the longer-term upside path, as we expect the ECB to continue shifting its language to more hawkish at its upcoming meetings.
We believe that the second scenario is the most likely. We think that the Bank will remove only half of the bias, on fears that a complete removal could be over-interpreted by markets and lead to 'unwarranted movements in financial conditions, which could put the prospects of a sustained adjustment of inflation at risk', a concern mentioned in the minutes from the June meeting. Finally, there's also a risk that President Draghi points out the Bank's displeasure about the recent euro appreciation, further amplifying the case for a EUR pullback.
BoJ: Nothing to see here, move along
Overnight, the Bank of Japan kept its ultra-loose monetary policy framework unchanged, as was widely anticipated. Policymakers acknowledged that 'the recent moves in CPI have been relatively weak' and downgraded their inflation forecasts for the next three years. Meanwhile, they raised their real GDP growth forecasts for 2017 and 2018. The reaction in JPY was negative, albeit small. Importantly, the Bank provided no hints that it could alter its QQE with yield curve control framework anytime soon. As such, we maintain our broader view that JPY may continue to underperform EUR, CAD and AUD, given that the ECB, the BoC, and the RBA have turned optimistic.
As for today's economic indicators:
In the UK, retail sales for June are due out and expectations are for a rebound following a sharp decline in May. GBP/JPY traded lower yesterday, but hit the key support of 145.35 (S1) and during the Asian morning today, it rebounded on the BoJ decision. If indeed UK retail sales rebound today, the pair could extend its overnight recovery and may challenge the 146.35 (R1) resistance. A break above that level is possible to see scope for extensions towards our next resistance of 147.30 (R2). However, we would stay mindful on larger bullish extensions. On the daily chart, we see that the rate has been trading in a sideways manner since the 17th of November, with the upper bound being the 148.00 (R3) territory. We would like to see a clear break above that territory before we get confident that a long-term uptrend is forming.
EUR/USD
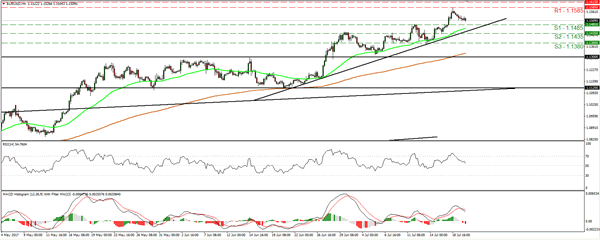
Support: 1.1485 (S1), 1.1435 (S2), 1.1380 (S3)
esistance: 1.1585 (R1), 1.1615 (R2), 1.1710 (R3
GBP/JPY
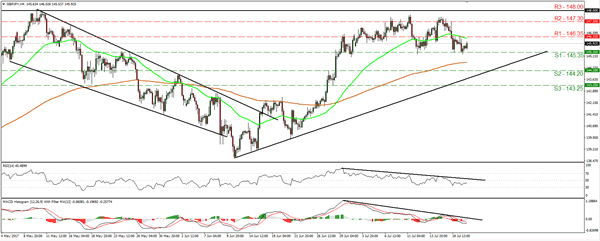
Support: 145.35 (S1), 144.20 (S2), 143.25 (S3)
Resistance: 146.35 (R1), 147.30 (R2), 148.00 (R3)
Yen Softens After Textbook BoJ Meeting
The Bank of Japan meeting contained few surprises, although not only did they lower CPI forecasts as expected but also push back the timing for it to reach their 2% goal.
- BoJ keeps policy steady
- Short-term interest rate remains at -0.1%
- 10yr JGB target remains around 0% (7-2 vote)
- Time for hitting inflation of 2% is pushed back to around FY 2019
- Pledge to buy JGBs at annual pace of around Y80trn
The meeting went broadly as expected with policy remaining unchanged, with revisions to the outlook. Growth has been upgraded in 2017 and 2018 to 1.5%-1.8% (1.4%-1.6% in April) and 1.1%-1.5% (1.1% to 1.3% in April) respectively. Inflation has been downgraded once more for 2017 and 2018 yet, once again, they maintain 2% target is viable and achievable. The market reaction was a slight reduction for the Yen, although we expect this trend to continue over the coming months as Yen bears return to the table.
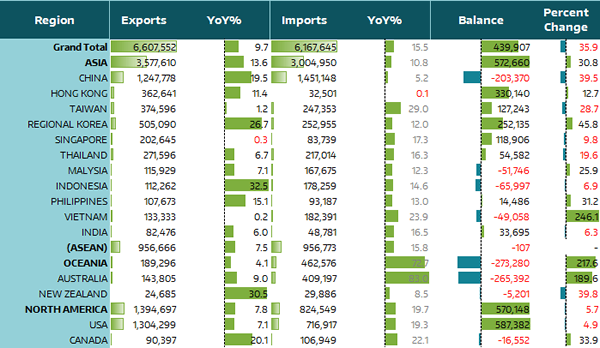
Japan's trade increased by Y644.1bn in May which took the surplus to Y439.9. Whilst this is below expectations of Y484.7B, it did drag it out of April's surplus of -Y204.2Bn. Gross exports increased to Y6.6trn, up 756.4bn from May, which annualised is 9.7% YoY (14.8% prior). Gross Imports increased to Y612trn, up by 112.3bn from May which sees the annual rate at 15.5% (17.8% prior). To the annoyance of the US, they provided the single largest portion of June's surplus with the whole of Asia coming a close second. What this will do to trade relation with the US, only time will tell, but they should take note of the hostile meeting the US had with China overnight in which Trump hinted Steel tariffs may be just around the corner. Whilst exports to US currently outstrip imports from the US by a ratio of 1.61, Japan remains a long way off from what Trump would call a 'fair deal'
USDJPY rebounded as expected, although the day's range so far has been on the subdued side. If we are to see a repeat of positive data from the US tonight then this leaves potential for gains to continue and test the 112.23 high.
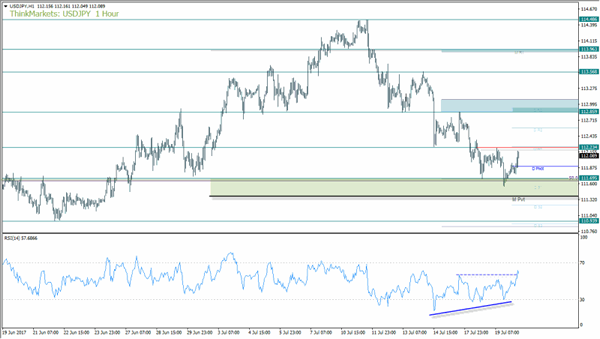
We provided an overview of Yen crosses yesterday and highlighted that downside momentum was waning, which left potential for a bullish wedge of some sorts to materialise. We printed a lower low overnight which makes the wedge from 112.86 stretched, but if we are to break above 112.23 then it warns of a deeper correction against the dominant trend. As the zone between the monthly pivot and 111.70 only tested the upper boundary, we see potential for resistance to break overnight and eventually run for the 112.86 high.
The bullish RSI divergence needs to be confirmed with a break of a prior swing (112.86), and its possible RSI has signalled this to be more likely by breaking its own prior swing in anticipation.
Quarterly Outlook Summary
- Economy is in gradual recovery
- Recent moves in CPI have been relatively weak
- Rise in medium to long term inflation expectations has been lagging somewhat
- Inflation expectations projected to rise as firms gradually raise wages
- There is uncertainty about overseas economies, which could pose downside risks
- CPI likely to continue uptrend, increase towards 2pc
- If trust in mid- to long-term fiscal policy declines this could increase uncertainty and raise long-term yields
- Projected rate of increase in CPI is lower mainly for the first half of the 3-year projection period in BoJ's quarterly report
- Risks to the economy and prices are skewed to the downside
- There is risk that household inflation expectations could be slow to rise
- Momentum towards hitting price target is maintained but not yet sufficiently firm
- There are risk household inflation expectations could be slow to rise if CPI remains weak
- BoJ to make policy adjustment as appropriate with view to maintaining momentum towards achieving price target