Sample Category Title
Trade Idea : USD/JPY – Sell at 112.80 or buy at 111.80
USD/JPY - 112.09
Most recent candlesticks pattern : N/A
Trend : Near term down
Tenkan-Sen level : 112.00
Kijun-Sen level : 111.89
Ichimoku cloud top : 112.28
Ichimoku cloud bottom : 112.02
Original strategy :
Sell at 112.70, Target: 111.70, Stop: 113.05
Position : -
Target : -
Stop : -
New strategy :
Sell at 112.80, Target: 111.80, Stop: 113.15
O.C.O.
Buy at 111.80, Target: 112.80, Stop: 111.45
Position : -
Target : -
Stop : -
As the greenback has rebounded after marginal fall to 111.55 yesterday, suggesting a daily of consolidation above this level would be seen with mild upside bias for retracement to 112.50, then towards previous resistance at 112.87 where renewed selling interest should emerge and bring another decline later. Below said support at 111.55 would signal the decline from 114.50 top is still in progress and extend further weakness to 111.20-25, however, reckon 111.00 would hold from here.
In view of this, whilst we are still looking to sell dollar on subsequent recovery, we would also turn long on dips for such a rebound. A firm break above resistance at 112.87 would defer and risk a stronger rebound to 113.10-20 but price should falter below resistance at 113.58, bring another selloff later.

EUR/USD Daily Outlook
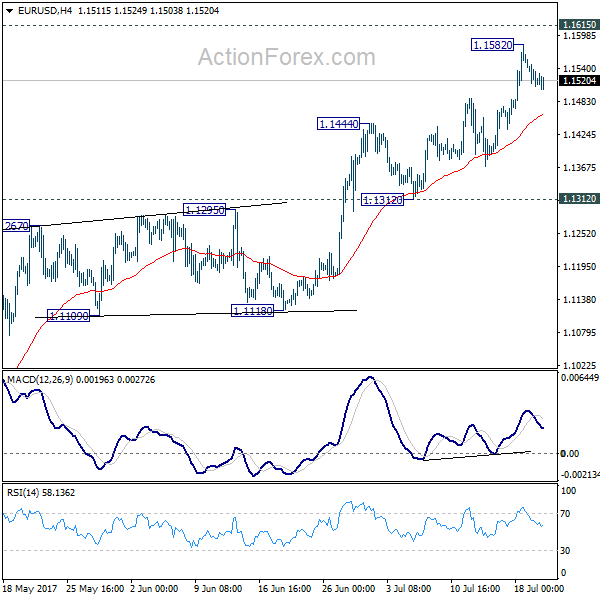
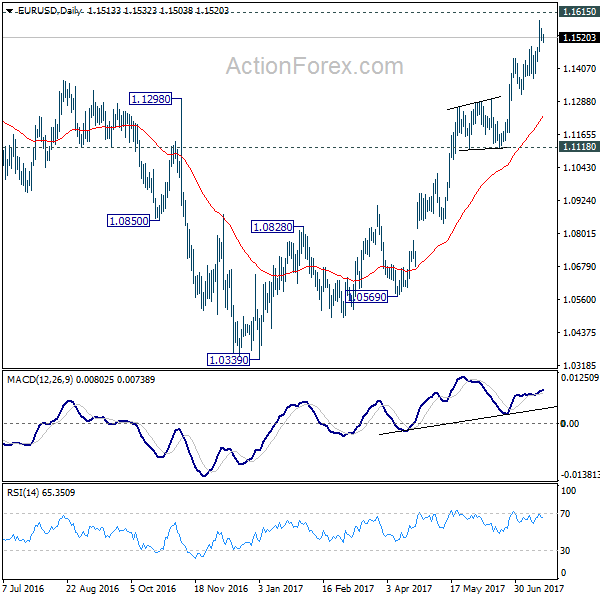
Daily Pivots: (S1) 1.1498; (P) 1.1526 (R1) 1.1544; More.....
Intraday bias in EUR/USD remains neutral for consolidation below 1.1582 temporary top. But overall, outlook will remain bullish as long as 1.1312 support holds. Above 1.1582 will target 1.1615 key resistance. Decisive break there will pave the way to 1.2 handle next.
In the bigger picture, the firm break of 1.1298 resistance further affirm medium term reversal. That is, an important bottom was formed at 1.0339 on bullish convergence condition in weekly MACD. Further rise would be seen to 55 month EMA (now at 1.1756). Sustained break there will pave the way to 38.2% retracement of 1.6039 (2008 high) to 1.0339 (2017 low) at 1.2516 next. This will now remain the favored case as long as 1.1118 support holds.
GBP/USD Daily Outlook
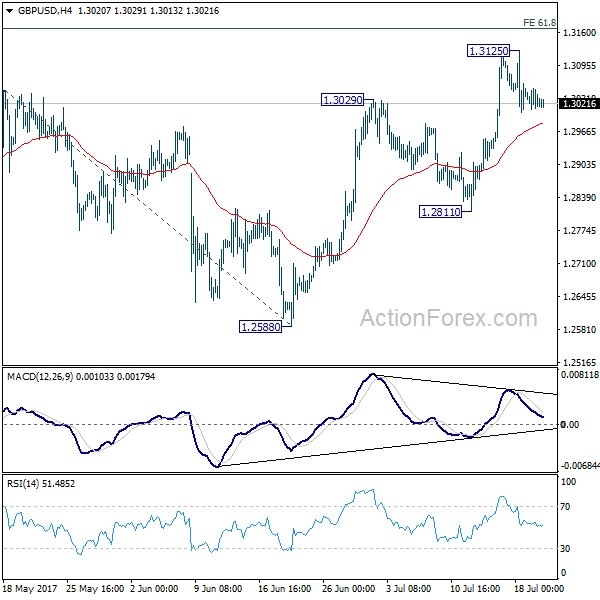
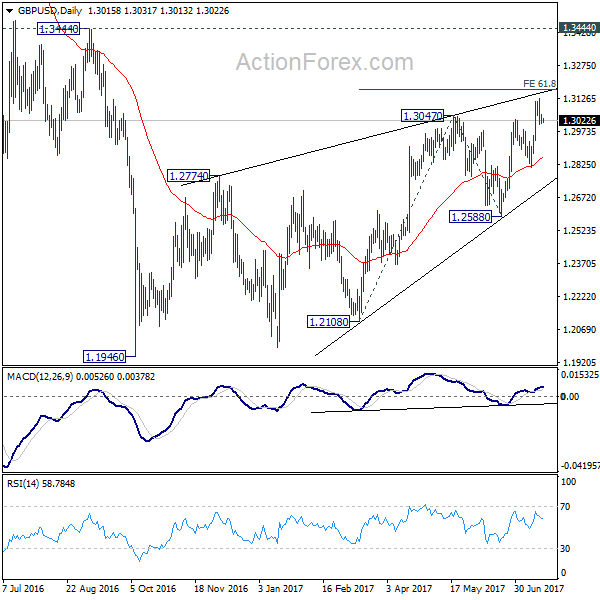
Daily Pivots: (S1) 1.3005; (P) 1.3028; (R1) 1.3047; More...
GBP/USD is staying in consolidation below 1.3125 temporary top. Intraday bias remains neutral for the moment. Another rise would be seen as long as 1.2811 support holds. Break of 1.3125 will target 61.8% projection of 1.2108 to 1.3047 from 1.2588 at 1.3168. Overall, choppy rebound from 1.1946 is seen as a corrective pattern, hence, we'd be cautious on strong resistance from 1.3168 to limit upside. But firm break of 1.3168 will bring further rise towards 1.3444 key resistance. Meanwhile, break of 1.2811 support will be the first sign of reversal and will turn bias to the downside to target 1.2588 key support next.
In the bigger picture, overall, price actions from 1.1946 medium term low are seen as a corrective pattern that is still in progress. While further upside is expected, overall outlook remains bearish as long as 1.3444 key resistance holds. Larger down trend from 1.7190 is expected to resume later after the correction completes. And break of 1.2588 will indicate that such down trend is resuming.
GBP/USD Candlesticks and Ichimoku Analysis
Weekly
• Last Candlesticks pattern: Long white candlestick
• Time of formation: 16 Jan 2017
• Trend bias: Down
Daily
• Last Candlesticks pattern: Long white candlestick
• Time of formation: 18 Apr 2017
• Trend bias: Near term up
GBP/USD – 1.020
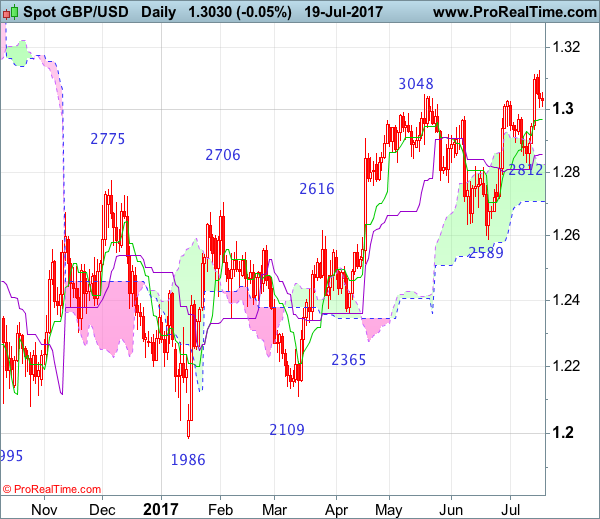
Although cable extended recent upmove to as high as 1.3126 earlier this week, the quick retreat from there suggests a week of consolidation below this level would be seen and mild downside bias is for test of the Tenkan-Sen (now at 1.2969), below there would extend weakness to the Kijun-Sen (now at 1.2858), however, only a daily close below support at 1.2812 would signal a temporary top is formed there, bring retracement of recent upmove to 1.2790-00, then towards 1.2730-35, having said that, reckon the lower Kumo (now at 1.2707) would limit downside and price should stay well above support at 1.2589, bring rebound later.
On the upside, expect recovery to be limited to 1.3050-60 and bring another retreat later. Above said resistance at 1.3126 would extend recent erratic upmove from 1.1986 low to 1.3140-45 (38.2% Fibonacci retracement of 1.5018-1.1986), then towards 1.3200, however, reckon upside would be limited to 1.3250-60 and price should falter well below 1.3300, risk from there is seen for a retreat later.
Recommendation: Sell at 1.3040 for 1.2840 with stop above 1.3140
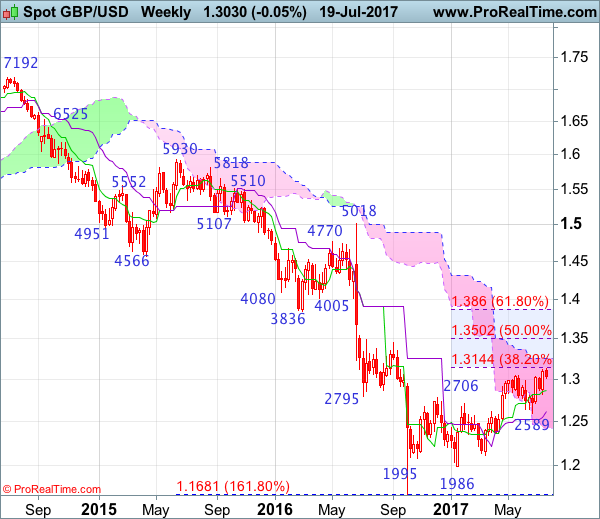
On the weekly chart, although cable continued edging higher after breaking above previous resistance at 1.3048, loss of near term upward momentum should prevent sharp move beyond 1.3140-50 (38.2% Fibonacci retracement of 1.5018-1.1986) and reckon upside would be limited to the upper Kumo (now at 1.3247), the British pound’s upside should falter below 1.3300-10, bring retreat later next month or in late Q3.
On the downside, initial pullback to 1.2960-70 and then 1.2900 is likely, however, reckon the Tenkan-Sen (now at 1.2858) would limit downside. Only a break below support at 1.2812 would suggest a temporary top is possibly formed, bring weakness to 1.2755-60, then test of support at 1.2706 but cable needs to penetrate support at 1.2589 to provide confirmation, bring retracement of recent upmove to 1.2550 and possibly towards previous support at 1.2515 which is expected to hold from here.
USD/CHF Daily Outlook
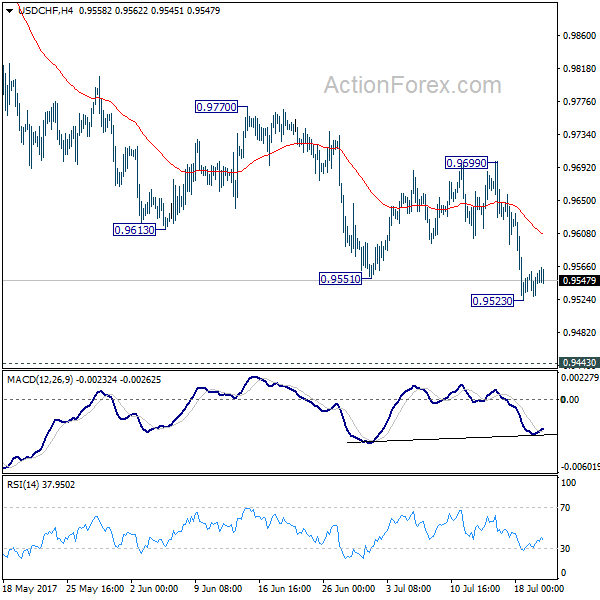
Daily Pivots: (S1) 0.9535; (P) 0.9548; (R1) 0.9567; More...
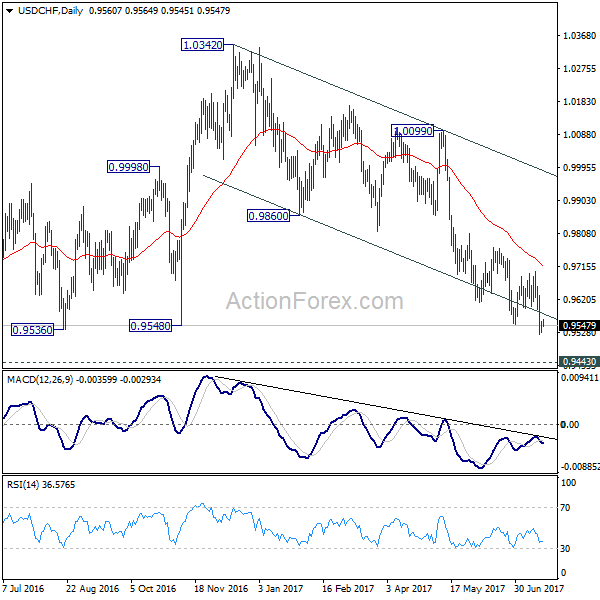
A temporary low is in place at 0.9523 and intraday bias is turned neutral first. Upside of recovery should be limited well below 0.9699 resistance and bring fall resumption. Break of 0.9523 will extend the decline from 1.0342 and target 0.9443 key support level next. At this point, we'd expect strong support from there to bring rebound.
In the bigger picture, USD/CHF is still bounded in medium term range of 0.9443/1.0342 for the moment. Consolidative trading would likely continue and medium term outlook remains neutral. Break of 1.0342 key resistance is needed to confirm underlying bullish momentum in the pair. Meanwhile, downside attempts should be contained by 0.9443 key support level. However, sustained break of 0.9443 will carry larger bearish implication and target 0.9 handle.
GOLD Rejected By Major Resistance, EUR/JPY Upside Uncertain Post BOJ
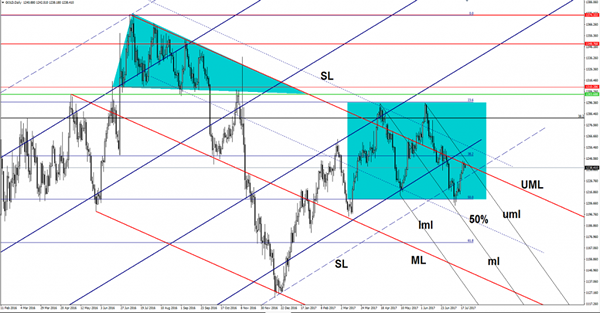
GOLD rejected by major resistance
Price retreats and resumes the yesterday's minor bearish candle, wasn't able to close above a major resistance area and now is going down. Continues to move sideways, so we are not 100% certain that will resume the downward movement, but technically is somehow expected to drop further because is trapped below a major resistance area.
Could drop much deeper if the US dollar index will have enough energy to climb in the upcoming period, the yellow metal slipped below the $1239 per ounce and could fall even below the 1200 psychological level if the USDX will jump above the 96.00 level again.
Price found strong resistance at the upper median line (UML) of the major descending pitchfork and now has turned to the downside again. Failed to close above this obstacle, signalling an exhaustion, but another leg lower will be confirmed only after a valid breakdown below the ascending sliding parallel line (SL).
I've said in the previous analysis that the rate remains under pressure and maintains a bearish perspective as long as is trading below the UML and within the minor descending pitchfork's body. A retest of the upper median line (uml) of the minor descending pitchfork will bring us a very good selling opportunity on the short term.
We'll have a clear direction once we'll have a valid breakout from the range between the 23.6% and 50% retracement level, but a rejection here, followed by a drop below the SL will send the rate much below the 50% retracement level in the upcoming period.
A buying opportunity will appear only if the rate will jump and will stabilize above the UML, outside the minor descending pitchfork's body and above the 23.6% retracement level, this scenario will take shape only if the USDX will slide further.
EUR/JPY upside uncertain post BOJ
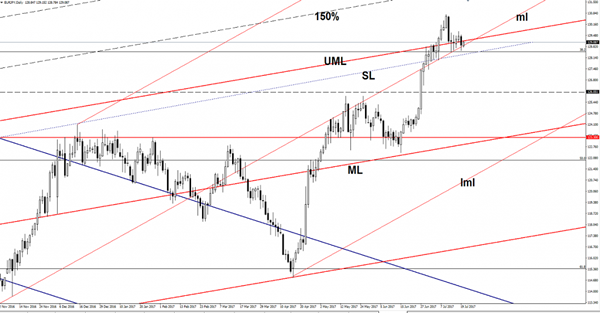
Price increased a little in the morning, but continues to trade right above a crucial support area, a breakdown below 128.30 will confirm a further drop in the upcoming period.
Price dropped after the impressive rally and now is retesting the upper median line (UML) of the major ascending pitchfork, the median line (ml) of the ascending pitchfork and the 38.2% retracement level. The perspective remains bullish as long as is trading above these levels, but a valid breakdown will attract more sellers, which will drive the rate towards the median line (ML) of the major ascending pitchfork.
NZD/USD overbought?
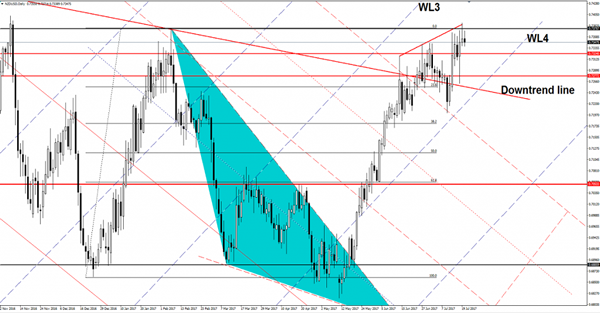
The currency pair reached new highs in the yesterday's session when jumped above the 0.7375 static resistance, but the bulls look exhausted.
Looks to overbought to climb much higher because has started to make some big upside shadows, has closed much below the 0.7375 major static resistance, a failure to close above this upside obstacle will signal a reversal on the short term.
Could develop a Rising Wedge pattern on the short term because has found strong resistance at the up sloping red line. A large decrease will come only after a valid breakdown below the WL4.
USD/JPY Daily Outlook
Daily Pivots: (S1) 111.58; (P) 111.90; (R1) 112.26; More...
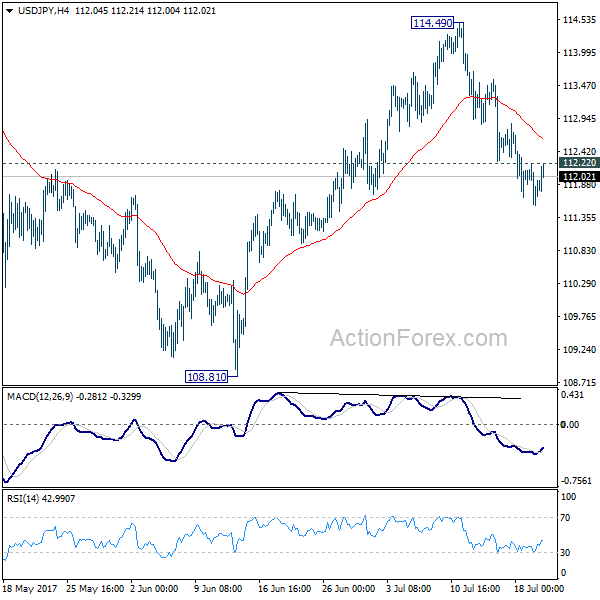
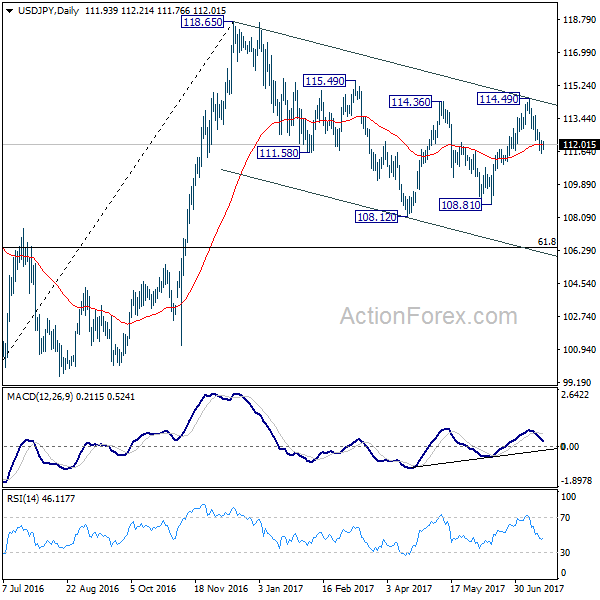
With 112.22 minor resistance intact, intraday bias in USD/JPY remains on the downside. Sustained trading below 55 day EMA (now at 112.02) will target 197.71 support. As noted before, whole correction from 118.65 is possibly still in progress. Break of 108.81 will confirm and target 61.8% retracement of 98.97 to 118.65 at 106.48. On the upside, above 112.22 minor resistance will turn intraday bias neutral first.
In the bigger picture, the corrective structure of the fall from 118.65 suggests that rise from 98.97 is not completed yet. Break of 118.65 will target a test on 125.85 high. At this point, it's uncertain whether rise from 98.97 is resuming the long term up trend from 75.56, or it's a leg in the consolidation from 125.85. Hence, we'll be cautious on topping as it approaches 125.85. If fall from 118.65 extends lower, down side should be contained by 61.8% retracement of 98.97 to 118.65 at 106.48 and bring rebound.
AUD/USD Daily Outlook
Daily Pivots: (S1) 0.7921; (P) 0.7940; (R1) 0.7971; More...
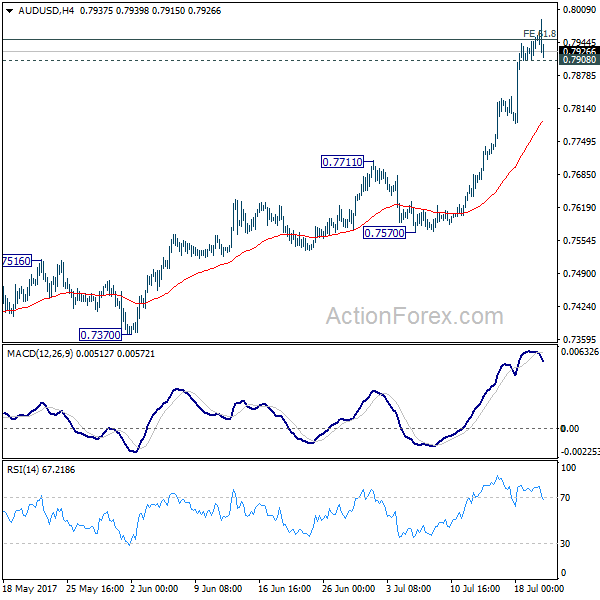
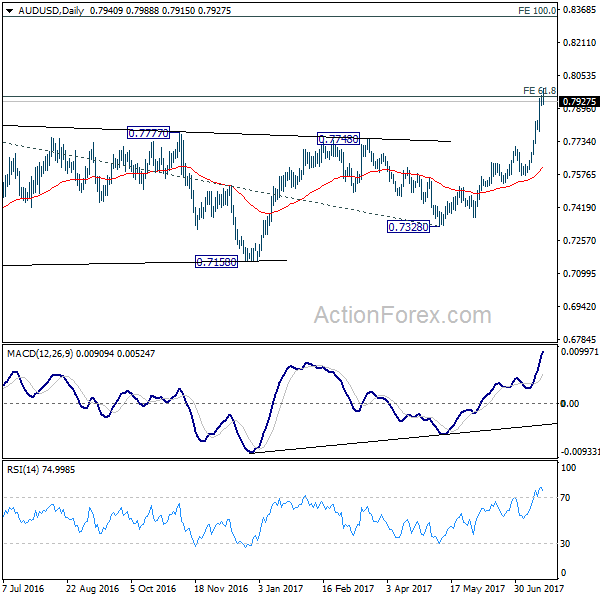
AUD/USD edges higher to 0.7988 and hit target of 61.8% projection of 0.6826 to 0.7833 from 0.7328 at 0.7950. The pair is losing some upside momentum as seen in 4 hour MACD. But intraday bias stays on the upside with 0.7908 minor support intact. Sustained trading above 0.7950 will pave the way to 100% projection at 0.8335 next. On the downside, below 0.7908 will turn intraday bias neutral and bring pull back. But downside should be contained by 0.7711 resistance turned support to bring rally resumption.
In the bigger picture, current development suggests that rebound from 0.6826 is developing into a medium term rise. There is no confirmation of trend reversal yet and we'll continue to treat such rebound as a corrective pattern. But in any case, further rise is now expected to 55 month EMA (now at 0.8100) or even further to 38.2% retracement of 1.1079 to 0.6826 at 0.8451. Break of 0.7328 support is needed to confirm completion of the rebound. Otherwise, further rise is now expected.
Market Update – Asian Session: Markets See Only Marginal Volatility Ahead Of Draghi
Asia Summary
Following Wednesday's gains in US equities, most of the Asian bourses opened the session modestly higher. The Bank of Japan's generally inline interest rate decision and commentary have had little noticeable impact on markets. Looking ahead, traders are focusing on the upcoming ECB interest rate decision and comments. Corporate earnings in focus for the New York morning include Bank of New York, Blackstone Group, Nucor, Travelers and Union Pacific
Key economic data
(JP) BANK OF JAPAN (BOJ) LEAVES INTEREST RATE ON EXCESS RESERVES (IOER) UNCHANGED AT -0.10%; AS EXPECTED; Delays reaching 2% inflation target to ~FY19 from ~FY18
(JP) JAPAN JUN TRADE BALANCE: ¥439.9B V + ¥488BE; ADJ TRADE BALANCE: ¥81.4B V ¥127.5BE
(AU) AUSTRALIA JUN EMPLOYMENT CHANGE: 14.0K V +15.0KE; UNEMPLOYMENT RATE: 5.6% V 5.6%E
(AU) AUSTRALIA Q2 NAB BUSINESS CONFIDENCE: 7 V 7 PRIOR
(AU) Australia Jun RBA Gross FX Transactions (A$): -1.12B v -735M prior
Speakers and Press
China
(CN) China expected to increasing monitoring cash flows in Macau – SCMP
(CN) FX Regulator SAFE: China Banks sold net of CNY142.5B in foreign exchange in June; Fund flows situation stabilized and improved in H1
Australia/New Zealand
(AU) Australia Treasurer Morrison: See the economy building momentum - Australian
Korea
(KR) US intel sources: North Korea is making preparations for another ICBM or intermediate missile test, possibly in two weeks – CNN
(KR) South Korea Finance Min Kim Dong-Yeon: To announce economic policy direction next week
Japan
(JP) Japan Cabinet Office (Govt) July report: Leaves economic assessment unchanged
Other
(DE) Germany Wisemen Bofinger said to recommend rate target for tapering of ECB bond purchases - German Press; Bofinger says instead of a fixed reduction in bond purchases, central bankers should use a yield target for long-term bonds.
(US) House Budget Committee releases FY18 budget with fiscal spending of $1.13T, includes $621.5B in defense spending and $511B in other discretionary spending
Asian Equity Indices/Futures (00:30ET)
Nikkei +0.6%, Hang Seng +0.2%, Shanghai Composite +0.2%, ASX200 +0.6%, Kospi +0.1%
Equity Futures: S&P500 flat; Nasdaq flat, Dax flat, FTSE100 +0.1%
FX ranges/Commodities/Fixed Income (00:30ET)
EUR 1.1533-1.1505; JPY 112.18-111.78; AUD 0.7987-0.7927; NZD 0.7371-0.7340
Aug Gold -0.3% at 1,238/oz; Aug Crude Oil flat at $47.30/brl; Sept Copper +0.4% at $2.72/lb
GLD SPDR Gold Trust ETF daily holdings fall 5.3 tonnes to 816.1 tonnes
(CN) China PBoC OMO: injects CNY60B in 7 and 14 day reverse repos v CNY140B prior
USD/CNY *(CN) PBOC SETS YUAN REFERENCE RATE AT 6.7464 V 6.7451 PRIOR
(NZ) New Zealand sells NZ$200M in 2.75% 2025 bonds; avg yield 2.8190%
AUD/USD in focus: Following the release of Australia's June employment data, the Aussie initially gained over 0.3%,but the currency has since reversed gains, as 3-year yields moved off of session highs.
Equities notable movers
Australia
Myer Holdings,MYR.AU Guides FY17 adj Net profit A$66-70M v A$71Me; deputy CEO Daniel Bracken resigns; -9.8%
Bellamy, BAL.AU To resume trading today, -9.6%
Mobile Embrace,MBE.AU Settles litigation with GBD Ventures; Under the terms of the settlement, all parties are to be responsible for payment of their own costs; +9%
Santos, STO.AU Raised FY17 production guidance; +8%
Hong Kong/China (Sunac)\
Sinotruk, 3808.HK Positive Profit alert: H1 Profit to record a substantial increase >400%; +28.8%
Sunac China Holdings, 1918.HK Reduced asset purchase with Wanda amid debt and regulator concerns; +16%
Japan
FujiFilm,4901.JP Announces results from Phase II Clinical Trial of "T-817MA" in Patients with Alzheimer's Disease in the United States; +3.8%
New Zealand
Fletcher Building, FBU.NZ Profit warning, impairment charge and management change; -6%
US markets on close: Dow +0.3%, S&P500 +0.5%, Nasdaq +0.6%, Russell +0.99%
Best Sector in S&P500: Energy
Worst Sector in S&P500: Industrials
Biggest gainers: VRTX +20.8%; SNI +14.7%; MUR +6.7%
Biggest losers: NTRS -8.4%; GWW -7.0%; NAVI -6.8%
At the close: VIX 9.79 (-0.1pts); Treasuries: 2-yr 1.36% +0.6%), 10-yr 2.27% (+0.4%), 30-yr 2.85% (-0.01%)
US Market Summary
Stocks continued their rally today, brushing aside concerns on timely implementation of economic reform policies. Nasdaq hit a new all-time high at 6385, rising 41 points. S&P also hit a new all-time close and high, rising 13 points, to close at 2473.
(US) Trump at a lunch with senators pleaded for them to come together and repeal and replace the Obama healthcare law. He said the GOP had been very close to striking a deal and that lawmakers should not leave town for the summer without reaching an agreement.
(US) Crude oil stocks declined more than expected. EIA figures showed a reduction of 4.7 million barrels; forecasts had been for a reduction of 3.2 million. WTI crude spiked higher, gaining 1.2% soon after the data release, to trade over $47/bbl for the first time in two weeks.
US Afterhours Movers
PTC Reports Q3 $0.28 v $0.28e, Rev $292M v $291Me; Guides Q4 $0.33-0.38 v $0.38e, R$303-308M v $309Me; Non-GAAP op margin 18-19% ; -10.9% afterhours
AVA HydroOne to acquire Avista for US$53/shr cash in $5.3B deal; +18.8% afterhours
HPJ Reports preliminary Q2 gross profit $11-12M v $7.6M y/y, R$50-52M v $36.7M y/y ; +18.4% afterhours
Notable US corporate earnings in the afterhours included Steel Dynamics, Qualcomm, American Express and T-Mobile US
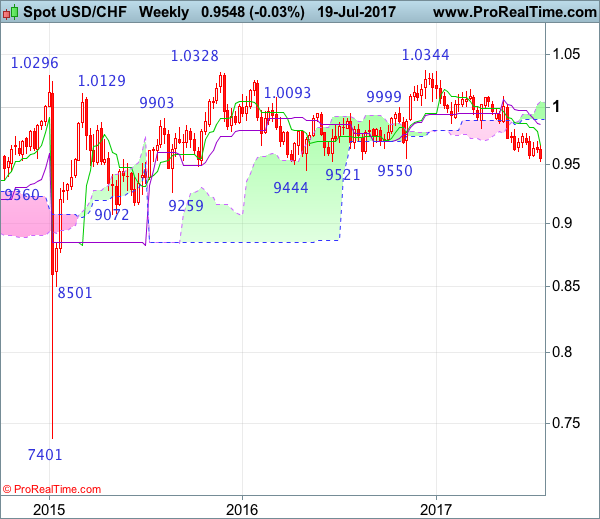
USD/CHF Candlesticks and Ichimoku Analysis
Weekly
• Last Candlesticks pattern: Shooting star
• Time of formation: 7 Mar 2017
• Trend bias: Sideways
Daily
• Last Candlesticks pattern: Morning star
• Time of formation: 9 May 2017
• Trend bias: Near term up
USD/CHF – 0.9551
Although the greenback did recover after holding above previous chart support at 0.9550, as renewed selling interest emerged again just above 0.9700 and dollar has fallen again, suggesting downside risk remains for recent decline from 1.0344 (2016 high) to extend weakness to psychological support at 0.9500, having said that, loss of downward momentum should prevent sharp fall below another previous chart support at 0.9444 and reckon 0.9390-00 would hold on first testing, risk from there has increased for a rebound later.
On the upside, whilst recovery to the Tenkan-Sen (now at 0.9612) cannot be ruled out, reckon upside would be limited to the the Kijun-Sen (now at 0.9647) and price should falter below resistance at 0.9701 (last week’s high), dollar shall head south again from there. A daily close above this level is needed to suggest a temporary low is possibly formed, bring a stronger rebound to 0.9738 resistance, break there would bring retracement of recent selloff to previous resistance at 0.9771 but reckon resistance at 0.9808 would hold from here.
Recommendation: Exit long entered at 0.9600 and stand aside

On the weekly chart, the greenback has fallen again after brief bounce to 0.9701 late last week, suggesting recent decline from 1.0344 (2016 high) is still in progress and downside risk remains for weakness to 0.9500, then towards another previous support at 0.9444, however, loss of near term downward momentum should prevent sharp fall below 0.9400 and reckon 0.9350 would hold from here, risk from there has increased for a rebound later.
On the upside, although initial recovery to 0.9600 and then the Tenkan-Sen (now at 0.9666) cannot be ruled out, reckon said resistance at 0.9701 would limit upside and bring another decline. A weekly close above this level would bring test of another previous resistance at 0.9771 but break there is needed to suggest a temporary low is possibly formed, then gain to 0.9808 resistance would follow. Break of this resistance would add credence to this view, bring retracement of recent decline to the Kijun-Sen (now at 0.9847) but upside should be limited to the lower Kumo (now at 0.9894) and price should falter below 1.0007 (previous resistance).