Sample Category Title
Euro Trading A Tad Lower, Ahead Of The ECB’s Interest Rate Decision
For the 24 hours to 23:00 GMT, the EUR declined 0.19% against the USD and closed at 1.1529.
On the data front, the Euro-zone's seasonally adjusted construction output eased 0.7% on a monthly basis in May, following a gain of 0.3% in the prior month.
In other economic news, housing starts in the US rebounded more-than-expected by 8.3% on monthly basis, to an annual rate of 1215.0K in June, surging to a four-month high level, suggesting an upturn in the housing sector was on the cards. Market participants had envisaged housing starts to climb to a level of 1160.0K, compared to a revised reading of 1122.0K recorded in the previous month. Moreover, the nation's building permits climbed more-than-anticipated by 7.4% on a monthly basis, to an annual rate of 1254.0K in June, compared to a level of 1168.0K in the prior month, while markets were expecting for a rise to a level of 1201.0K. Also, the nation's MBA mortgage applications rebounded 6.3% in the week ended 14 July, after recording a drop of 7.4% in the previous week.
In the Asian session, at GMT0300, the pair is trading at 1.1526, with the EUR trading marginally lower against the USD from yesterday's close.
The pair is expected to find support at 1.1508, and a fall through could take it to the next support level of 1.1490. The pair is expected to find its first resistance at 1.1546, and a rise through could take it to the next resistance level of 1.1566.
Later today, all eyes would be on the European Central Bank's (ECB) interest rate decision, wherein investors would be keen to get cues on any fresh guidance towards changes to its bond-buying plan in the coming months. Additionally, in the US, initial jobless claims followed by leading indicators data for June, slated to release later in the day, will be on investors' radar.
The currency pair is showing convergence with its 20 Hr moving average and trading below its 50 Hr moving average.

Pound Trading Marginally Higher, Ahead Of UK’s Retail Sales Data
For the 24 hours to 23:00 GMT, the GBP declined 0.06% against the USD and closed at 1.3027.
In the Asian session, at GMT0300, the pair is trading at 1.3030, with the GBP trading a tad higher against the USD from yesterday's close.
The pair is expected to find support at 1.3010, and a fall through could take it to the next support level of 1.2989. The pair is expected to find its first resistance at 1.3052, and a rise through could take it to the next resistance level of 1.3073.
Going forward, investors will closely monitor Britain's retail sales data for June, scheduled to release in a few hours.
The currency pair is showing convergence with its 20 Hr moving average and trading below its 50 Hr moving average.

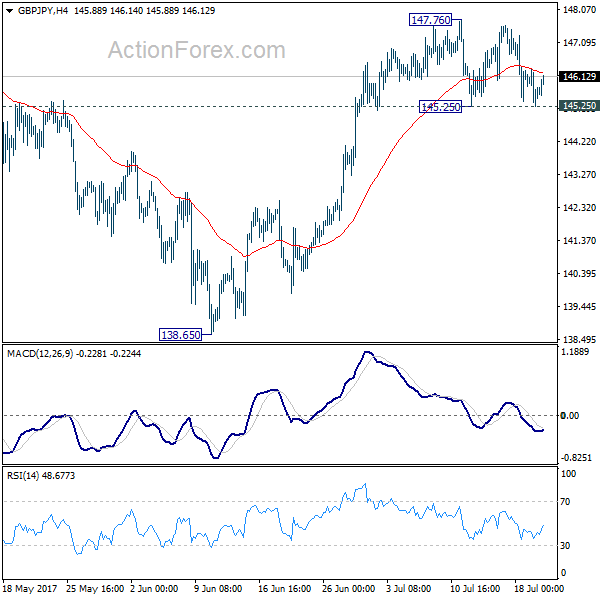
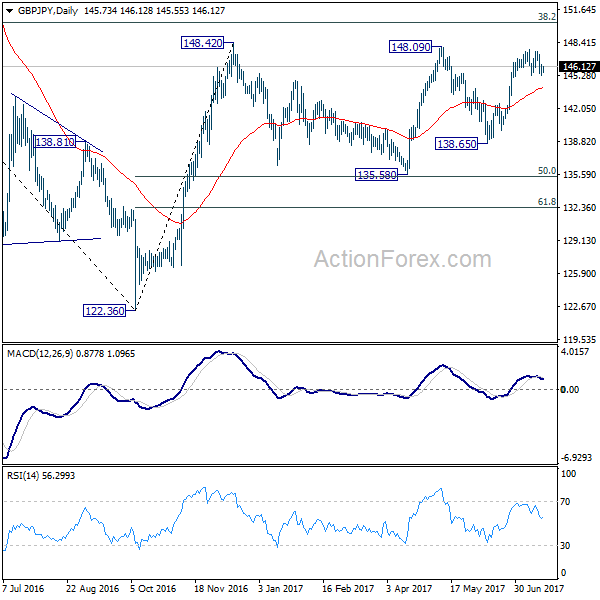
GBP/JPY Daily Outlook
Daily Pivots: (S1) 145.23; (P) 145.78; (R1) 146.30; More
Intraday bias in GBP/JPY remains neutral as it's bounded in range of 145.5/147.76. On the upside break of 147.76 will resume rise from 138.65. And firm break of 148.42 key resistance will also resume the whole rally from 122.36 to long term fibonacci level at 150.43 and above. Meanwhile, on the downside, break of 145.25 will revive the case of rejection from 148.09/42 resistance zone. Intraday bias would then be turned back to the downside for 55 day EMA (now at 144.06) and below.
In the bigger picture, rise from medium term bottom at 122.36 is expected to continue to 38.2% retracement of 196.85 to 122.36 at 150.43. Decisive break there will carry long term bullish implications and pave the way to 61.8% retracement at 167.78. In case the sideway pattern from 148.42 extends, we'd be looking for strong support from 135.58 and 50% retracement of 122.36 to 148.42 at 135.39 to contain downside.
BoJ Announces No Change To Monetary Policy, Trims Inflation Forecast And Upgrades Economic Outlook
For the 24 hours to 23:00 GMT, the USD declined 0.14% against the JPY and closed at 111.88.
In the Asian session, at GMT0300, the pair is trading at 111.98, with the USD trading 0.09% higher against the JPY from yesterday’s close.
The Japanese Yen lost ground, after the Bank of Japan (BoJ) downgraded its outlook for inflation at its latest monetary policy meeting.
The BoJ kept its interest rate unchanged at -0.1%, as widely expected. However, in a quarterly review of its long-term projections, the central bank lowered its inflation forecast for the current fiscal year ending in March 2018 to 1.1% from 1.4% it forecasted three months ago. Further, the central bank pushed back the time frame for achieving its 2.0% inflation target, stating that it would be met sometime during fiscal 2019. The central bank had previously stated the target would be achieved in fiscal 2018. Nevertheless, the BoJ raised its forecast for GDP growth for the current fiscal year to 1.8%, from 1.6% estimated earlier.
On the data front, Japan’s adjusted merchandise trade surplus surprisingly narrowed to a level of ¥81.4 billion in June, defying market expectations for it to widen to a level of ¥127.5 billion. In the preceding month, the nation had reported a revised surplus of ¥122.7 billion.
On the other hand, the nation’s all industry activity index eased more-than-anticipated by 0.9% on a monthly basis in May, compared to a revised advance of 2.3% in the previous month. Market participants had expected the index to ease 0.8%.
The pair is expected to find support at 111.62, and a fall through could take it to the next support level of 111.25. The pair is expected to find its first resistance at 112.29, and a rise through could take it to the next resistance level of 112.59.
The currency pair is trading above its 20 Hr moving average and showing convergence with its 50 Hr moving average.

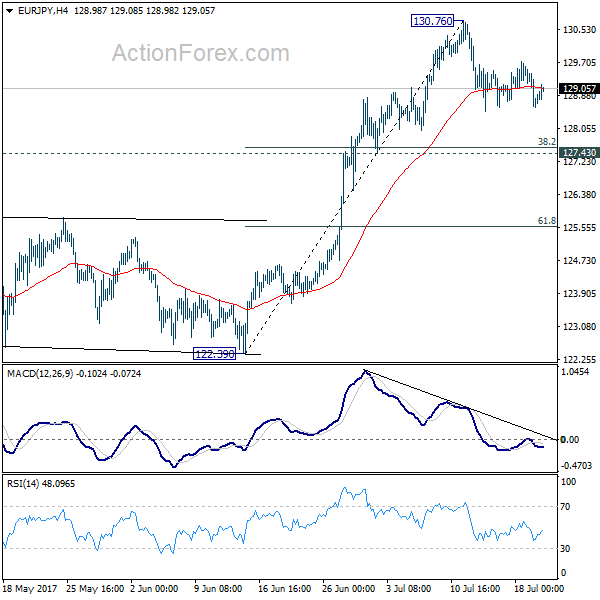
EUR/JPY Daily Outlook
Daily Pivots: (S1) 128.46; (P) 128.99; (R1) 129.41; More...
EUR/JPY is staying in the consolidation pattern from 130.76 and intraday bias remains neutral. Deeper fall might be seen. But downside should be contained by 127.43 cluster support (38.2% retracement of 122.39 to 130.76 at 127.56) and bring rebound. Above 130.76 will extend the larger rally to next key fibonacci level at 134.20.
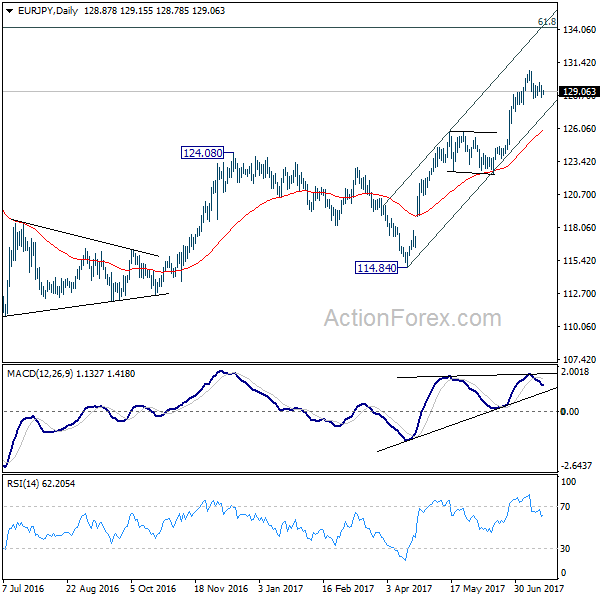
In the bigger picture, the down trend from 149.76 (2014 high) is completed at 109.03 (2016 low). Current rally from 109.03 should be at the same degree as the fall from 149.76 to 109.03. Further rise is expected to 61.8% retracement of 149.76 to 109.03 at 134.20. Sustained break there will pave the way to key long term resistance zone at 141.04/149.76. Medium term outlook will remain bullish as long as 124.08 resistance turned support holds.
Swiss Franc Trading A Tad Lower In The Morning Session
For the 24 hours to 23:00 GMT, the USD marginally declined against the CHF and closed at 0.9548.
In the Asian session, at GMT0300, the pair is trading at 0.9549, with the USD trading slightly higher against the CHF from yesterday’s close.
The pair is expected to find support at 0.9532, and a fall through could take it to the next support level of 0.9514. The pair is expected to find its first resistance at 0.9564, and a rise through could take it to the next resistance level of 0.9578.
Ahead in the day, traders will look forward to Switzerland’s trade balance figures for June.
The currency pair is trading above its 20 Hr moving average and showing convergence with its 50 Hr moving average.

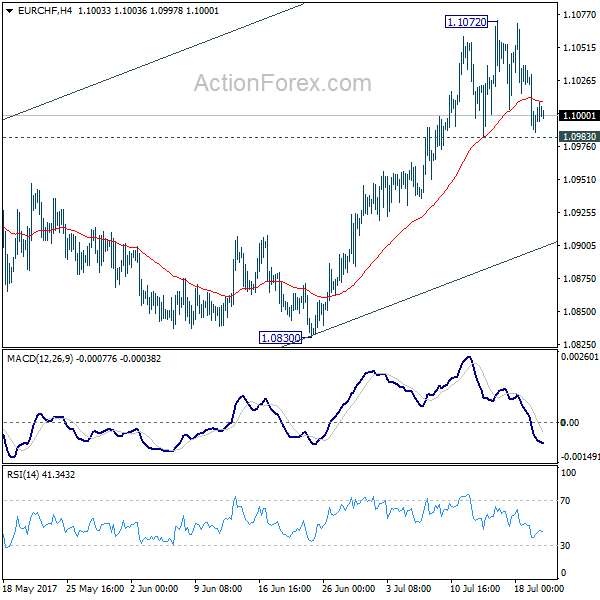
EUR/CHF Daily Outlook
Daily Pivots: (S1) 1.0983; (P) 1.1008; (R1) 1.1030; More...
Intraday bias in EUR/CHF remains neutral for the moment. As long as 1.0983 support holds, further rally is expected in the cross. Current rise from 1.0629 should target 1.1127/98 resistance zone. However, break of 1.0983 will indicate short term topping and turn bias back to the downside for 55 day EMA (now at 1.0908).
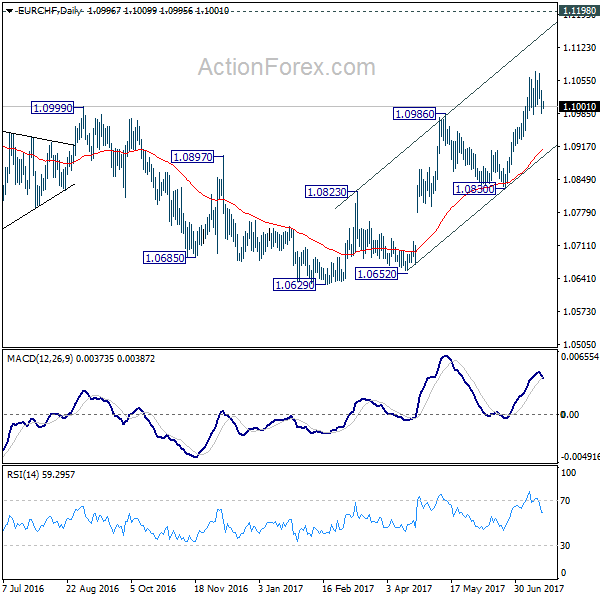
In the bigger picture, the price actions from 1.1198 are seen as a corrective move. Such correction could have completed after defending 38.2% retracement of 0.9771 to 1.1198 at 1.0653. Decisive break of 1.1198 will resume the long term rise from SNB spike low back in 2015. In such case, EUR/CHF could eventually head back to prior SNB imposed floor at 1.2000. However, rejection from 1.1198 will extend the multi-year range trading with another fall.
Loonie Reverses Its Gains In The Asian Session
For the 24 hours to 23:00 GMT, the USD declined 0.25% against the CAD and closed at 1.2600.
On the data front, Canada's manufacturing shipments climbed 1.1% MoM in May, topping market consensus for a rise of 0.8%. Manufacturing shipments had advanced by a revised 0.4% in the previous month.
In the Asian session, at GMT0300, the pair is trading at 1.2614, with the USD trading 0.11% higher against the CAD from yesterday's close.
The pair is expected to find support at 1.2577, and a fall through could take it to the next support level of 1.2540. The pair is expected to find its first resistance at 1.2652, and a rise through could take it to the next resistance level of 1.2690.
The currency pair is showing convergence with its 20 Hr moving average and trading below its 50 Hr moving average.

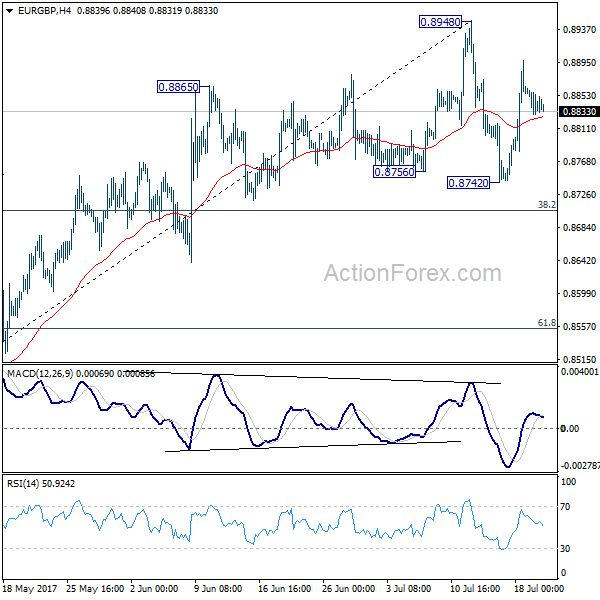
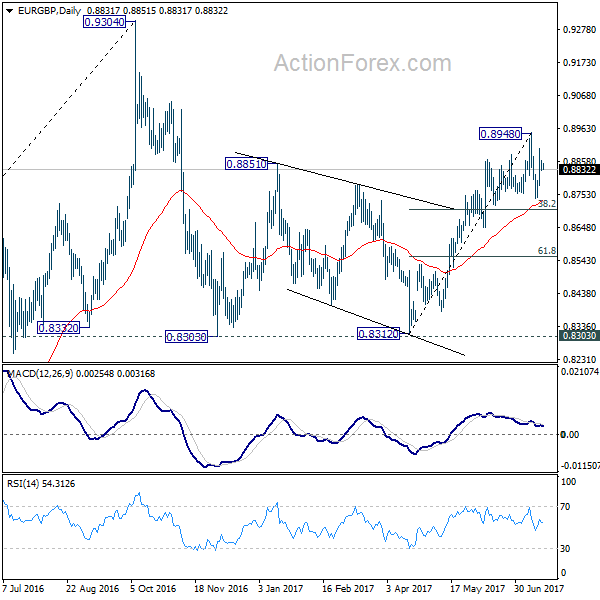
EUR/GBP Daily Outlook
Daily Pivots: (S1) 0.8825; (P) 0.8844; (R1) 0.8859; More
Intraday bias in EUR/GBP remains neutral for the moment as it's staying in range of 0.8742/8948. On the downside, below 0.8742 will target 38.2% retracement of 0.8312 to 0.8948 at 0.8705 first. Break will target 61.8% retracement at 0.8555 next. However, break of 0.8948 will extend the rebound from 0.8312 towards 0.9304 resistance.
In the bigger picture, price actions from 0.9304 are viewed as a medium term corrective pattern. It's uncertain whether it is finished yet. But in case of another fall, we'd expect strong support from 0.8116 cluster support (50% retracement of 0.6935 to 0.9304 at 0.8120) to contain downside and bring rebound. Whole up trend from 0.6935 is expected to resume after consolidation from 0.9304 completes.
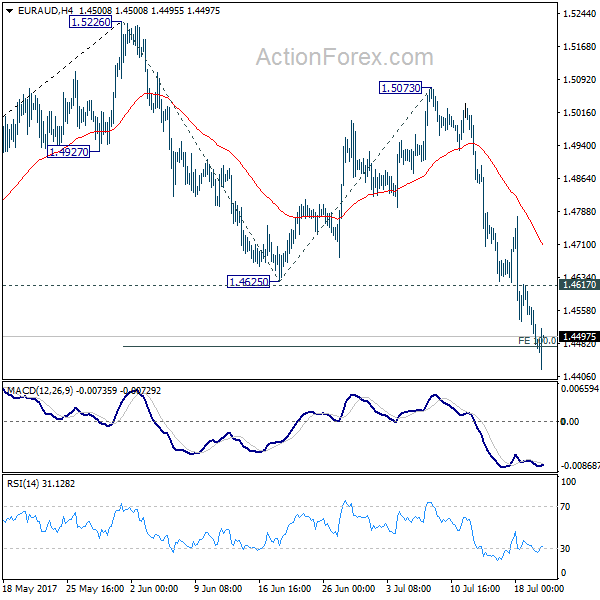
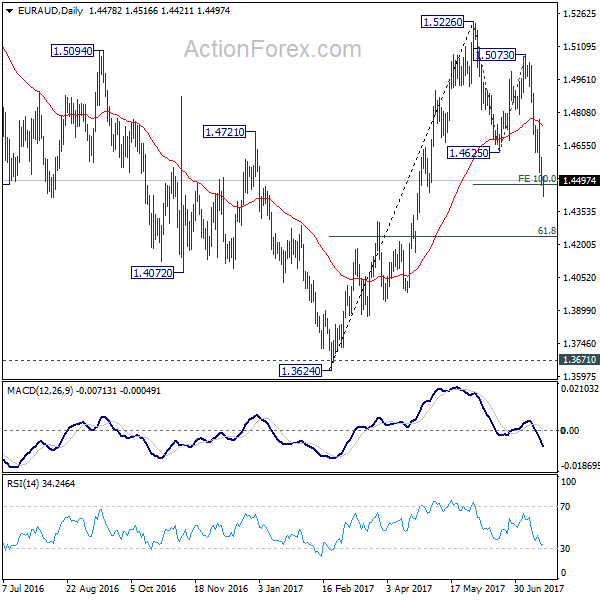
EUR/AUD Daily Outlook
Daily Pivots: (S1) 1.4432; (P) 1.4518; (R1) 1.4563; More...
EUR/AUD drops to as low as 1.4421 so far today and met 100% projection of 1.5226 to 1.4625 from 1.4472. The cross quickly recovered. But for the moment, with 1.4617 minor resistance intact, intraday bias remains on the downside. Firm break of 1.4472 will pave the way to larger fibonacci level at 61.8% retracement of 1.3624 to 1.5226 at 1.4236. Meanwhile, above 1.4617 will indicate short term bottoming and turn bias back to the upside for 55 day EMA (now at 1.4744).
In the bigger picture, we're holding on to the view that corrective decline from 1.6587 medium term has completed at 1.3624. But we will monitor the structure of the decline from 1.5226 to adjust our view. Above 1.5226 will target a test on 1.6587 key resistance. However, further downside acceleration will dampen our view and would drag EUR/AUD lower to retest key support zone around 1.3624.