
Sample Category Title
Yen Softens After Textbook BoJ Meeting
The Bank of Japan meeting contained few surprises, although not only did they lower CPI forecasts as expected but also push back the timing for it to reach their 2% goal.
- BoJ keeps policy steady
- Short-term interest rate remains at -0.1%
- 10yr JGB target remains around 0% (7-2 vote)
- Time for hitting inflation of 2% is pushed back to around FY 2019
- Pledge to buy JGBs at annual pace of around Y80trn
The meeting went broadly as expected with policy remaining unchanged, with revisions to the outlook. Growth has been upgraded in 2017 and 2018 to 1.5%-1.8% (1.4%-1.6% in April) and 1.1%-1.5% (1.1% to 1.3% in April) respectively. Inflation has been downgraded once more for 2017 and 2018 yet, once again, they maintain 2% target is viable and achievable. The market reaction was a slight reduction for the Yen, although we expect this trend to continue over the coming months as Yen bears return to the table.
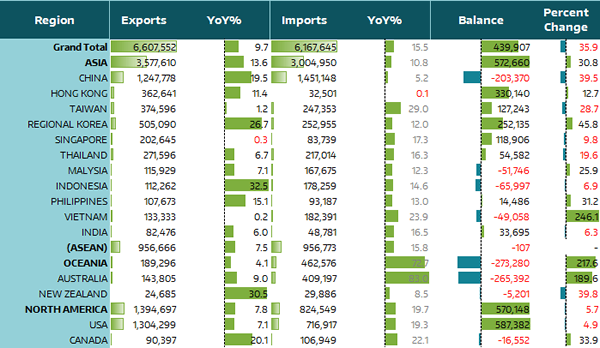
Japan's trade increased by Y644.1bn in May which took the surplus to Y439.9. Whilst this is below expectations of Y484.7B, it did drag it out of April's surplus of -Y204.2Bn. Gross exports increased to Y6.6trn, up 756.4bn from May, which annualised is 9.7% YoY (14.8% prior). Gross Imports increased to Y612trn, up by 112.3bn from May which sees the annual rate at 15.5% (17.8% prior). To the annoyance of the US, they provided the single largest portion of June's surplus with the whole of Asia coming a close second. What this will do to trade relation with the US, only time will tell, but they should take note of the hostile meeting the US had with China overnight in which Trump hinted Steel tariffs may be just around the corner. Whilst exports to US currently outstrip imports from the US by a ratio of 1.61, Japan remains a long way off from what Trump would call a 'fair deal'
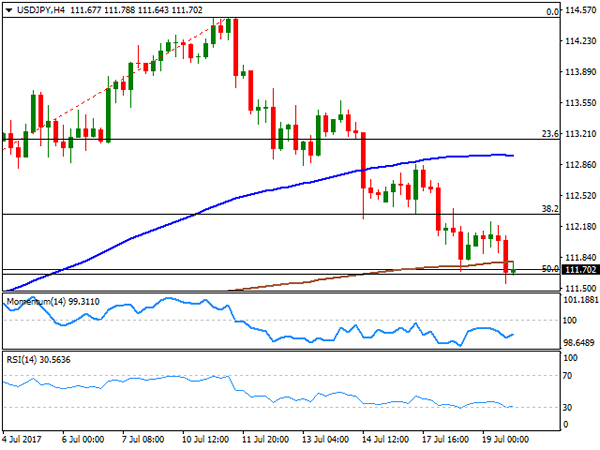
USDJPY rebounded as expected, although the day's range so far has been on the subdued side. If we are to see a repeat of positive data from the US tonight then this leaves potential for gains to continue and test the 112.23 high.
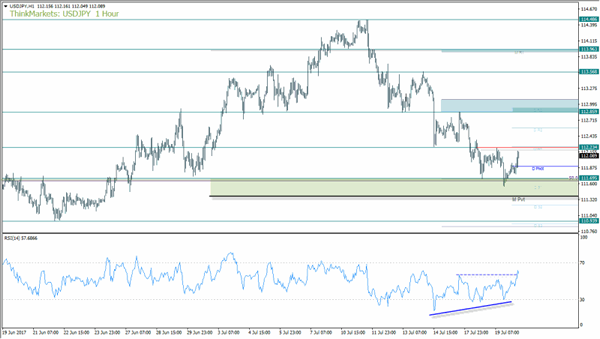
We provided an overview of Yen crosses yesterday and highlighted that downside momentum was waning, which left potential for a bullish wedge of some sorts to materialise. We printed a lower low overnight which makes the wedge from 112.86 stretched, but if we are to break above 112.23 then it warns of a deeper correction against the dominant trend. As the zone between the monthly pivot and 111.70 only tested the upper boundary, we see potential for resistance to break overnight and eventually run for the 112.86 high.
The bullish RSI divergence needs to be confirmed with a break of a prior swing (112.86), and its possible RSI has signalled this to be more likely by breaking its own prior swing in anticipation.
Quarterly Outlook Summary
- Economy is in gradual recovery
- Recent moves in CPI have been relatively weak
- Rise in medium to long term inflation expectations has been lagging somewhat
- Inflation expectations projected to rise as firms gradually raise wages
- There is uncertainty about overseas economies, which could pose downside risks
- CPI likely to continue uptrend, increase towards 2pc
- If trust in mid- to long-term fiscal policy declines this could increase uncertainty and raise long-term yields
- Projected rate of increase in CPI is lower mainly for the first half of the 3-year projection period in BoJ's quarterly report
- Risks to the economy and prices are skewed to the downside
- There is risk that household inflation expectations could be slow to rise
- Momentum towards hitting price target is maintained but not yet sufficiently firm
- There are risk household inflation expectations could be slow to rise if CPI remains weak
- BoJ to make policy adjustment as appropriate with view to maintaining momentum towards achieving price target
ECB Will Reinforce Its Forward Guidance
The ECB is the 800-pound gorilla this week and Mario Draghi's speech is on the centre stage for currency traders. The best case scenario for all the euro bulls would be if Draghi keeps his cards closer to his chest.
The big announcement which we are expecting is not at this event but at the Jackson Hole next month. There are chances that Draghi could actually end the euro rally abruptly if he comes out wearing his well known dovish cloak. The euro has surged enormously on the back of hopes that the ECB is going to start the process of shutting the door on loose monetary policy.
Forward Guidance
The ECB needs to be clear about its forward guidance and it should reinforce that in a subtle manner. Coming out of the gates too aggressively would create shock waves in the market therefore, they should make the ground smoother at this opportunity for the actual event which could be in September. In this manner shock to the bond markets along with other markets would be minimum.
This is no longer a secret that the bank cannot easily continue its process of owning more than 33 percent of any particular bond issued by one individual country. Thus the process of exiting out of this market would require that there is a clear plan how they would scale back from it. Thus, acknowledging that tapering is under discussion amid the policy members would send the signal that some plan could be announced in September.
Bond Spreads Are Calm
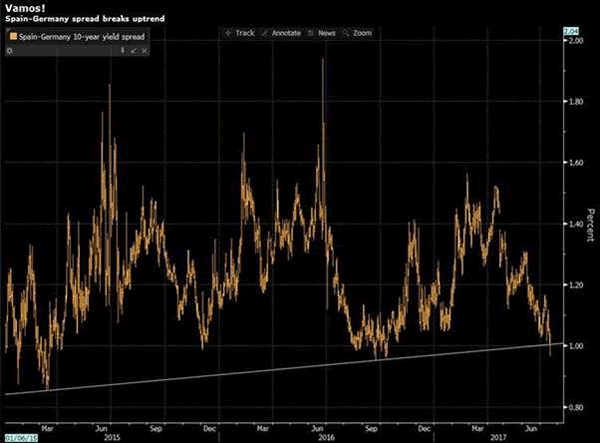
I would expect mammoth panic in periphery market and it would suffer the most if there are any unwelcome surprises. Judging from the fact that the Spain-Germany 10-year sovereign spread is at its lowest since October, it looks likes the markets are anything but worried. Therefore, I expect the “no harm, no foul” mentality to prevail.
Draghi's Comment To Create Opportunity in Euro And DAX
If the lower Euro was helping the export based economies and indices which are composed of export based companies then the strength in the euro is creating the contrary noise. With French political uncertainty out of the way, the inverse relationship between the euro and the DAX index is something which investors are going to bank on. Draghi dovish or hawkish comments could create more room for opportunity here.
Why The ECB Should Prepare The Market For Tapering
For the first time in nearly six quarters, we have seen some life coming back in the lending survey.
Although the numbers are not extraordinarily outstanding, at the same time, they do provide enough catalyst for the ECB to put breaks on their ultra-loose monetary policy.
Industrial production (hard data) in the Eurozone is surging and it is tentative evidence that the soft data such as business survey has started to make its way in the hard data. The sturdy path of output in this data is going to have significant impact on the second quarter GDP reading confirming the economic growth accelerating.
The business survey in Germany have strengthened further and the industrial output has surged which accounts nearly a quarter of the economy. We expect the GDP growth show more colours in Germany even if large chuck of May's strength is unwound in June. The employment rate has been stable at 3.9 percent in Germany.
In France, we are out of the major political uncertainty, and the economy has expanded during the first quarter despite inflation crippling consumer's spending. The retail numbers for this quarter confirms that we will have significant positive contribution for this quarter's GDP.
Policy uncertainties are receding in Italy and the unemployment rate is dropping. The economic recovery has resumed however, we still need more action on the policy reform side as they have not yielded the same amount of results as they did in Spain. However, it is moving in the right direction and the economic growth forecast for this year is 1.3 percent.
Spain has surprised investors with its economic growth and the economy has expanded more than the forecast. We think there are good chances the strong momentum would sustain for some time and the economy would perform better than expectation in the third quarter. Our growth forecast for Spain sits at 2.8 percent for this year.
EUR Edges Lower Ahead Of ECB Meeting
EUR subject to downside risk ahead of ECB meeting
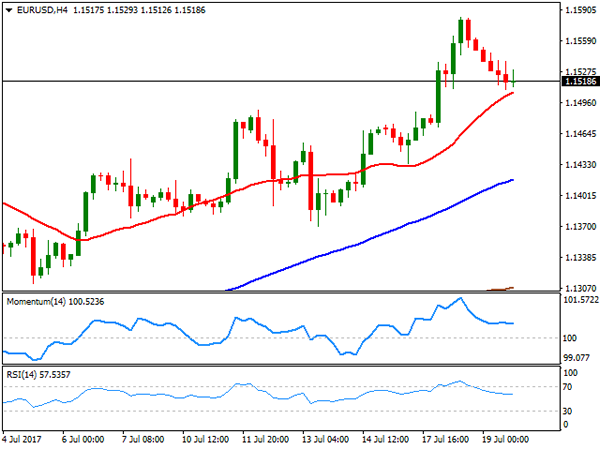
There is a lot at stake today as the European Central Bank meets to revise its monetary policy. The single currency has been trading with a strong positive bias for several weeks as investors widely anticipate the end of ultra-accommodative monetary policy for the euro area. EUR/USD hit 1.1583 on Tuesday as speculators continued to raise euro bullish bets. This morning, the single currency has been treading water at around 1.15 ahead of Mario Draghi’s press conference.
Market participants are positioned for a hawkish tone from the ECB president as they bet he will drop hints on tapering. Even though the ECB cannot walk out of this meeting without giving a little clarity, at least, we think that the ECB won’t match the market’s hawkish expectations. Indeed, it is true that the euro area has gained momentum recently, allowing for a more enthusiastic tone regarding growth expectations. However, those improvements have failed to translate into strong inflationary pressure for now. Therefore, we anticipate the ECB will move extremely slowly towards tapering and most importantly, more slowly than the Fed as it seek to prevent further EUR strength.
All in all, we believe that the risk is mostly on the downside in EUR crosses as investors are positioned for a hawkish surprise. EUR/USD is particularly vulnerable and a reversal towards 1.12 is more than likely.
Stay bullish USDJPY on BoJ inflation revision
The BoJ monetary policy meeting today when as we had expected. The BoJ held policy mixed unchanged while downgrading inflation and upgrading growth forecasts. The softer inflation forecast should take away some of the bullish moment in the JPY. Traders has expected that the limited effectiveness of the BoJ policy combined with improve growth outlook would force the central banks to marginally shift bias. However, the BoJ actions today indicated a strong resistance to this idea.
The inability for the BoJ yet steadfast comment to reach there 2% inflation target indicates a lag between Japan and other G10 central banks. Sudden reversal in US front end yields have helped narrow the US/JP interest rate differential pushing the rate sensitive USDJPY lower. However, the closer we get to September and the fed likely move toward the reduction of its 4.5 trillion balance sheet indicated that the next move in USDJPY will be higher. With 10 year rates targeting 2.45% we can see USDJPY retesting 114.45 resistance by September.
Elliott Wave View: DXY Bounce In Progress
Short term DXY (USD Index) Elliott Wave view suggests the decline from 6/20 peak (97.87) is unfolding as a Zigzag Elliott Wave structure. Down from 97.87 high, decline to 95.47 ended Minor wave A, and bounce to 96.51 high ended Minor wave B. Wave C is unfolding as an Elliott wave Impulse structure with extension where Minute wave ((i)) ended at 95.75, Minute wave ((ii)) ended at 96.2, and Minute wave ((iii)) ended at 94.47. Minute wave ((iii)) is subdivided into another impulsive wave of a smaller degree. Minutte wave (i) ended at 95.51, Minutte wave (ii) ended at 95.98, Minutte wave (iii) ended at 95.01, Minutte wave (iv) ended at 95.24, and Minutte wave (v) of ((iii)) ended at 94.47.
Currently Minutte wave ((iv)) is in progress to correct cycle from 7/10 high as a double three Elliott wave structure towards 95.05 – 95.15. While pivot at 7/10 high holds, expect Index to turn lower again. We don’t like buying the Index and expect bounces to find offer in the above area for more downside or 3 waves pullback at least.
DXY 1 Hour Elliott Wave Chart
Technical Outlook: EURUSD Dips Below 1.1500 Ahead Of ECB
The Euro is holding in red on Thursday and probes below 1.1500 handle in extension of easing from Tuesday's fresh multi-month high at 1.1583. Overbought daily technicals favor deeper pullback which could be helpful for larger uptrend, as dip-buying strategy remains in play. ECB's decision today could delay bulls and provide opportunities for longs on deeper dips on dovish tone from chief Draghi. Violation of initial support at 1.1476 (daily Tenkan-sen) would spark further downside and risk extension towards pivots at 1.1400 (20SMA) and 1.1370 (13 July trough). Conversely, stronger bullish acceleration could be expected on ECB's hawkish stance and may drive the pair towards strong barrier at 1.1735 (Fibo 38.2% of 1.3992/1.0340 descend).
Res: 1.1532, 1.1565, 1.1583, 1.1614
Sup: 1.1476, 1.1458, 1.1400, 1.1370
Foreign Exchange Market Commentary: EUR/USD, USD/JPY, GBP/USD, GOLD, WTI CRUDE, DJIA, FTSE100, DAX
EUR/USD
The American dollar edged higher only against the common currency this Wednesday, as speculative interest chose to lock gains ahead of the ECB's monetary policy meeting taking place this Thursday. Volumes were low, with most of the decline taking place during the first half of the day, despite a scarce macroeconomic calendar. The greenback maintained the soft tone, down against the rest of its major rivals, in spite of better-than-expected US housing data, which showed that housing starts rose at its fastest pace in four months, up in June by 8.3% or 1.215 million. Building permits also beat expectations, up by 7.4% or 1..254 million.
The European Central Bank is largely expected to maintain its monetary policy unchanged, but to maintain the optimistic stance offered in the previous meeting. Tapering is expected to be discussed in the next meeting, which will take place in September, but any hint on the subject will be taken as a trigger to buy the common currency.
The daily decline seems barely corrective as in the 4 hours chart the bullish structure remains intact, as the price remained above a bullish 20 SMA, while the 100 and 200 SMAs have extended their advances below the shortest. Technical indicators in the mentioned chart have corrected extreme overbought readings before losing downward strength within positive territory. The bearish potential will increase on a downward acceleration below 1.1490, while the key resistance comes at 1.1615, May 2016 high, with gains beyond the level favoring another 100 pips' gain.
Support levels: 1.1490 1.1460 1.1420
Resistance levels 1.1550 1.1580 1.1615
USD/JPY
The USD/JPY pair extended its decline down to 111.55 this Wednesday, its lowest since June 27th, with persistent dollar's weakness being the main driver for the pair. US data released ahead of Wall Street's opening came in better-than-expected, but was not enough to push the pair back above the 112.00 level, and in fact the mentioned low was achieved after the release. During the upcoming Asian session, Japan will release its trade balance figures for June, and more relevant, the latest monetary policy decision from the local Central Bank. Investors are not expecting any surprise from Kuroda and Co. this time, although there were some rumors making the rounds that the BOJ will drop its inflation target during this meeting. Policymakers will focus on the yield-curve control, which is seen as negative for the yen. Anyway, and with the ongoing dollar's weakness, a sharp recovery seems quite unlikely. Technically, the risk remains towards the downside, given that in the 4 hour chart, the price is right below its 200 SMA and barely holding above the 50% retracement of its June/July advance at 111.60, the immediate support, whilst technical indicators lost directional strength, but remain well below their mid-lines.
Support levels: 111.60 111.20 110.90
Resistance levels: 112.30 112.70 113.10
GBP/USD
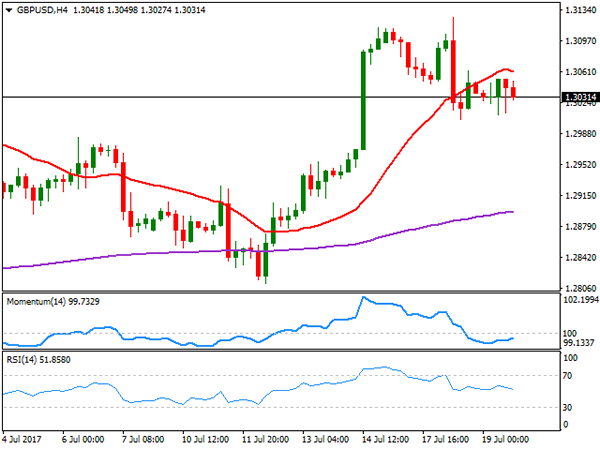
The GBP/USD pair closed the day unchanged around 1.3030, having consolidated above the 1.3000 mark but unable to recover beyond 1.3050 daily basis. There were no macroeconomic news coming from the UK and US ones were ignored, but things could become more interesting this Thursday, as the kingdom will release June retail sales, expected much better than those of May, while Brexit minister David Davis will head to Brussels for another round of Brexit talks. For the pair is the battle of the "less weak," as speculative interest is dumping the greenback on local political jitters and fears the Fed will have to slow its tightening pace, while for the Pound, reduced chances of a BOE's hike and Brexit uncertainty weigh. From a technical point of view, the intraday picture is neutral-to-bearish, as the pair developed below its 20 SMA, whilst the Momentum indicator remains horizontal, right below its mid-line, whilst the RSI indicator heads marginally lower within neutral territory.
Support levels: 1.3000 1.2965 1.2920
Resistance levels: 1.3050 1.3090 1.3130
GOLD
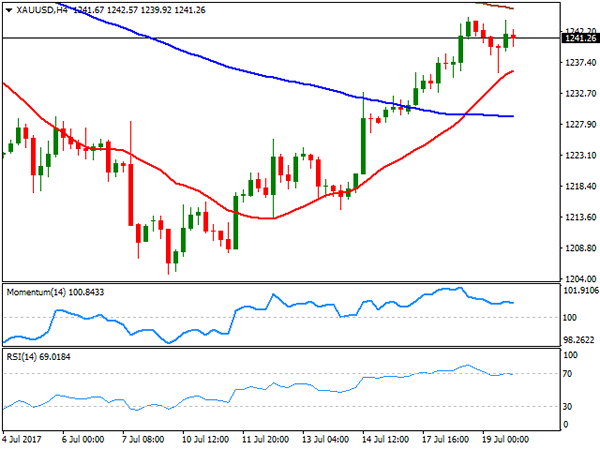
Gold eased modestly this Wednesday, settling at $1,241.30 a troy ounce, easing modestly as dollar's bleeding stalled. The commodity eased at the beginning of the day, tracking the common currency's behavior, but bounced from a daily low of 1,235.88 with the downside limited amid fading prospects of continued tightening in the US monetary policy. Additionally, the positive tone in equities, despite modest, limited chances of a stepper recovery. Technically, the daily chart shows that the price settled now far from its weekly high and above its 20 and 200 DMAs, while the Momentum indicator extended its advance beyond the 100 level, as the RSI turned flat around 55, all of which maintains the risk towards the upside. In the 4 hours chart, a bullish 20 SMA keeps leading the way higher, now providing a dynamic support at 1,236.30, while technical indicators have partially corrected extreme overbought readings before turning flat well above their mid-lines.
Support levels: 1,236.30 1,228.30 1,216.60
Resistance levels: 1,245.20 1,252.50 1,261.90
WTI CRUDE OIL
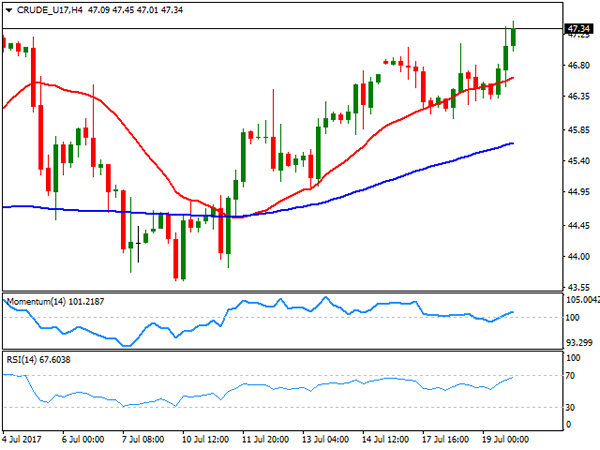
Crude oil prices extended their recovery this Wednesday, with West Texas Intermediate futures reaching a 6-week high of 47.45 to settle at $47.40 a barrel, underpinned by an unexpected fall in US oil inventories. According to the EIA, crude stockpiles fell by 4.73 million barrels in the week ended July 14th, well above market's expectations. Gasoline stocks also declined, by 4.4 million barrels. The positive news offset Ecuador announcement of its plans to abandon OPEC's output cut deal to shore up its finances from late Tuesday. Daily basis, the commodity has room to extend its advance, as the price remains well above a bullish 20 DMA, whilst the RSI indicator turned south, now around 60. The Momentum indicator in the mentioned chart remains flat around its 100 level, as the price surpassed previous relevant high by a couple of cents. The 100 DMA in the mentioned chart stands at 48.00, providing an immediate resistance. In the 4 hours chart, WTI is biased higher, having held above a bullish 20 SMA whilst technical indicators maintain their bullish slopes within positive territory.
Support levels: 47.00 46.40 45.90
Resistance levels: 47.45 48.00 48.60
DJIA
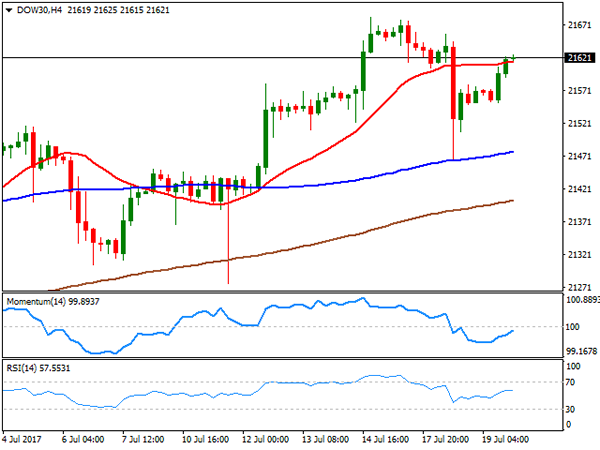
US indexes closed with gains this Wednesday, as markets stabilized ahead of key events taking place this Thursday, including two central banks announcements. The Dow Jones Industrial Average added 64 points, to close the day at 21,639.38, while the S&P closed at a new record high of 2,473.82, up by 13 points or 0.54%. The Nasdaq Composite gained 40 points and ended at 6,385.04, also a fresh all time high and up by a ninth consecutive day, as the tech sector led the way higher, while a recovery in oil prices backed energy-related shares, and earnings reports came in better-than-expected. Within the Dow, only four members closed lower, with IBM being the worst performer, down 4.42%. El du Pont, on the other hand, led advancers by adding 1.58%, followed by Cisco Systems that gained 1.21%. The technical outlook for the DJIA is positive, given that in the daily chart, the index continues developing well above all of its moving averages, with the 20 DMA currently around 20,480, and the RSI indicator regaining the upside, now around 61. In the same chart, the Momentum indicator pared its decline and turned flat within positive territory, not enough to confirm additional gains ahead. In the shorter term, and according to the 4 hours chart, the index is settling barely above its 20 SMA, while the RSI indicator heads north around 58 and the Momentum aims north around its mid-line, in line with the longer term perspective.
Support levels: 21,605 21,556 21,508
Resistance levels: 21,651 21,682 21,730
FTSE100
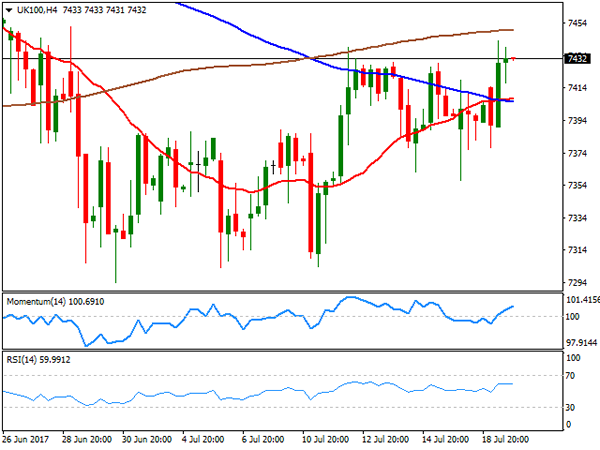
The FTSE 100 ended the day at 7,430.91, up by 41 points or 0.55%, helped by a surge in the home building sector and on news that Reckitt Benckiser got $4.2 billion for selling its food division. The best performer was Sage Group that added 2.68%, followed by Barratt Developments that gained 2.44%. Royal Mail led decliners, closing down 2.75%, followed by Paddy Power Betfair that shed 2.06%. The benchmark holds around the mentioned high ahead of the Asian opening, and presents a positive tone according to the daily chart, as technical indicators advanced within positive territory, maintaining its bullish slopes as the index advanced above its 20 and 100 DMAs, both around 7,380. For the shorter term, the 4 hours chart also supports an upward continuation, as the index also advanced beyond its 20 and 100 SMAs, while the Momentum indicator heads north well above its mid-line as the RSI indicator consolidates around 60.
Support levels: 7,362 7,333 7,304
Resistance levels: 7,413 7,439 7,482
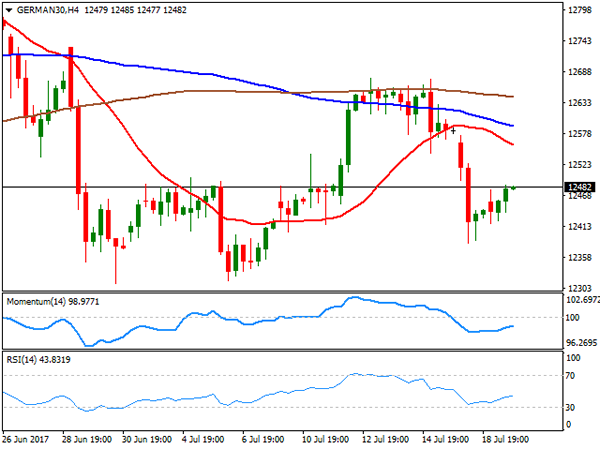
DAX
European equities managed to advance this Wednesday, with the German DAX up 21 points to 12,452.05, led by software company SAP which added 1.74%, as the sector was the best performer in the region. Infineon Technologies added 1.73%, also keeping the index afloat. On the downside, Commerzbank was the worst performer, shedding 2.95%. Trading was cautious ahead of the upcoming ECB monetary policy announcement this Thursday, with the index still trapped above a bullish 100 SMA and below a 20 SMA in the daily chart, whilst technical indicators continue hovering around their mid-lines. In the 4 hours chart, the risk remains towards the downside, as the index remains well below bearish moving averages, with the 20 SMA accelerating its decline below the larger ones, whilst technical indicators advanced modestly within bearish territory, not enough to support an upcoming rally.
Support levels: 12,459 12,404 12,354
Resistance levels: 12,510 12,567 12,610
Technical Outlook: GBPUSD Extends Pullback Below 1.3000, UK Retail Sales In Focus
Cable remains in red for the fourth straight day and probes below psychological 1.3000 support, weighed by weak CPI numbers earlier this week. Room for deeper pullback exists with close below pivotal 1.3000 support zone to generate bearish signal. Next solid support lies at 1.2968 (daily Tenkan-sen), followed by 1.2931 pivot (Fibo 61.8% of 1.2811/1.3125/rising 20SMA). UK retail sales for June are in focus (m/m 0.4% forecast vs -1.2% previous month/y/y 2.5% forecast vs 0.9% in May) and may offer fresh support on release at/above consensus. Regain of levels above 1.3050 would generate bullish signal and turn near-term focus higher.
Res: 1.3038, 1.3055, 1.3071, 1.3100
Sup: 1.2968, 1.2931, 1.2886, 1.2857
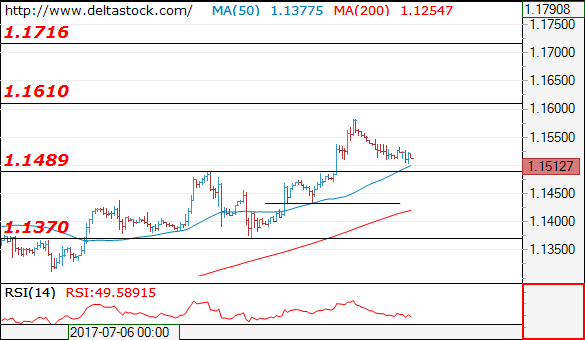
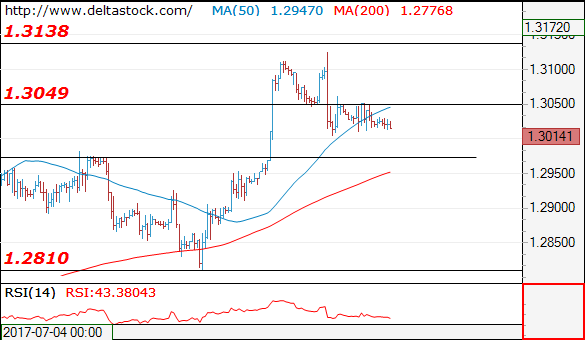
Forex Technical Analysis: EUR/USD, USD/JPY, GBP/USD
EUR/USD
Current level - 1.1512
The intraday bias is still bearish, for a slide towards 1.1480 support area. The latter should provide a reliable base for a renewal of the general uptrend, towards 1.1720. Key intraday resistance lies at 1.1550.
| Resistance | Support | ||
| intraday | intraweek | intraday | intraweek |
| 1.1550 | 1.1610 | 1.1480 | 1.1370 |
| 1.1610 | 1.1720 | 1.1370 | 1.1290 |
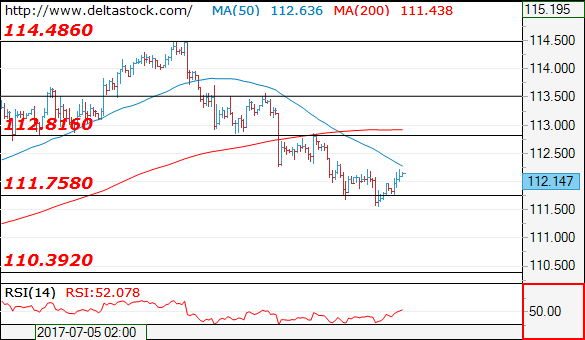
USD/JPY
Current level - 112.14
There is a minor reversal at 111.50 and the intraday bias is slightly positive, for another test of 112.80 hurdle.
| Resistance | Support | ||
| intraday | intraweek | intraday | intraweek |
| 112.80 | 114.50 | 111.50 | 111.75 |
| 113.50 | 115.50 | 110.30 | 110.20 |
GBP/USD
Current level - 1.3014
The outlook on the lower frames remains bearish, for a slide towards 1.2970 support. Initial intraday resistance is projected at 1.3050.
| Resistance | Support | ||
| intraday | intraweek | intraday | intraweek |
| 1.3050 | 1.3260 | 1.3000 | 1.2810 |
| 1.3130 | 1.3500 | 1.2970 | 1.2480 |
Yen Weakens Following BoJ Meeting, Aussie Gains On Healthy Job Market
Forex markets experienced more volatility today as it was busier one compared to others this week. The yen weakened against the dollar following the release of the Bank of Japan monetary policy report. The aussie had an initial boost against the greenback after employment data had been released, however it fell soon after. The euro was slightly up ahead of the European Central Bank meeting later in the day.
The BoJ kept monetary policy steady, a report showed today. While that was widely expected, the bank surprised the markets by delaying again the time-frame for reaching its inflation target, now expected at some point in fiscal 2019 instead of fiscal 2018. This is a sign the BoJ's accommodative monetary policy will continue for longer, contrasting its peers' thinking in the developed world. The BoJ cut its inflation forecast for the current fiscal year to 1.1% from 1.4% projected three months ago. The news came after the yen had already been pressured earlier in the session on the miss in trade balance data for June. While the trade balance came in short of expectations (440 billion yen versus the expected 485 billion yen), exports continue to expand above projections. Dollar/yen rose slightly to trade just above the 112 level as the Asian session was about to close.
The Australian dollar reached more than a two-year high versus the greenback as news about the healthy jobs market came out. Even though the change in employment, at 14K, came in 1,000 short of expectations, the encouraging sign in Australia's labor market was the rebound in full-time employment in June that reached 62K. Unemployment in Australia was steady at 5.6%. Aussie/dollar rose to 0.7987 following the news, but retraced the gains later in the session to last trade at 0.7924.
The euro was slightly up against the US dollar in the pre-European session. The eurozone currency got a boost from Germany's upbeat producer price figures for June. Annually, PPI rose 2.4% last month, above the forecasted 2.3% increase. While economists were expecting monthly PPI to decline by 0.1%, the index stagnated relative to the prior month when a decline of 0.2% had been recorded. Euro/dollar rose following the release and was last trading at 1.1518.
Traders are eagerly looking forward to the ECB meeting later today. While no immediate change in monetary policy is expected today, investors are hoping to gauge the ECB outlook for the autumn and steps the bank plans to take.
Sterling continued falling for the fourth consecutive day, though still trading above the $1.30 level. The pound may react following the release of the UK retail sales at 11.30 GMT.
Gold was under pressure overnight as the dollar gained ground against the yen. The precious metal was last trading at $1,239.01 an ounce.
Oil prices retraced some of yesterday's gains with both Brent and WTI falling around 0.20% today. The EIA report yesterday lifted prices as it showed a decline in crude oil inventories in the US for the week ending July 14. WTI was last trading at $47.03 a barrel and Brent was at $49.60 a barrel.