
Sample Category Title
EUR/USD Mid-Day Outlook
Daily Pivots: (S1) 1.1498; (P) 1.1526 (R1) 1.1544; More...
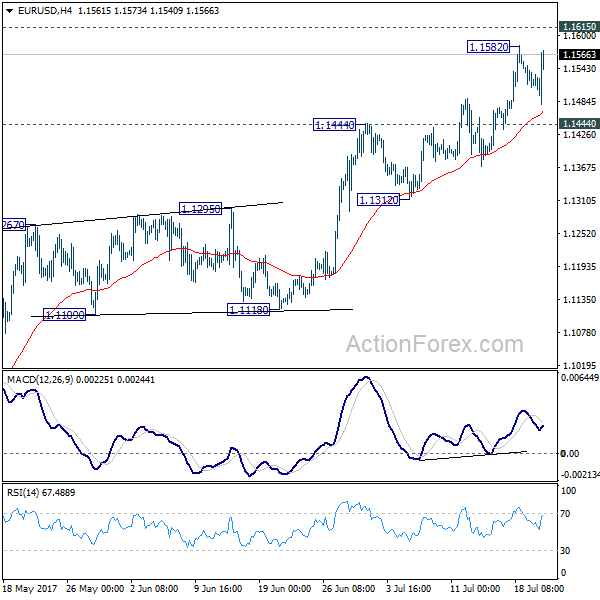
EUR/USD rebounds strongly in early US session but it's kept below 1.1582 temporary top. Intraday bias remains neutral and the consolidation from 1.1582 could extend. In case of another fall, downside should be contained by 1.1444 resistance turned support to bring rise resumption. Above 1.1582 will target 1.1615 key resistance first. Decisive break there will pave the way to 1.2 handle next.
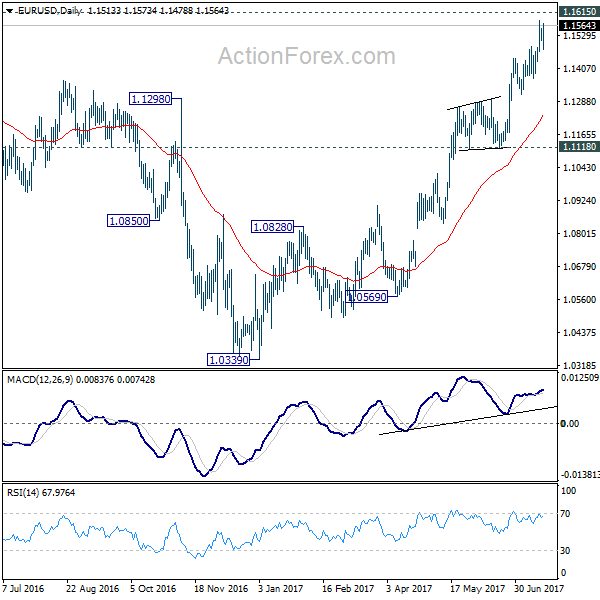
In the bigger picture, the firm break of 1.1298 resistance further affirm medium term reversal. That is, an important bottom was formed at 1.0339 on bullish convergence condition in weekly MACD. Further rise would be seen to 55 month EMA (now at 1.1756). Sustained break there will pave the way to 38.2% retracement of 1.6039 (2008 high) to 1.0339 (2017 low) at 1.2516 next. This will now remain the favored case as long as 1.1118 support holds.
Euro Mildly Higher on Cautiously Confident ECB Draghi, Upside Capped
Euro trades mildly highly on cautious but optimistic comments from ECB President Mario Draghi after the central left monetary policy unchanged. But it's staying in range against Dollar, Yen and even the weak Sterling. EUR/USD dipped to 1.1478 earlier today but is now back at 1.1550. Though, it's held below temporary top at 1.1582. EUR/JPY and EUR/GBP are trading in recent range below 130.76 and 0.8948 respectively. Sterling remains the weakest major currency for the week as weighed down by weaker than expected inflation data even though retail sales surprised on the upside today. Dollar regains some ground today but follows Pound as the second weakest major currency.
ECB Draghi cautious, but still confident and optimistic
ECB kept key interest rate at 0.00% and deposit rate at -0.4% as widely expected. There was also no change in the quantitative easing program as the central bank will continue to buy EUR 60b of assets per month till the end of the year. In the post meeting press conference, ECB president Mario Draghi sounded cautious and said that "while the ongoing economic expansion provides confidence that inflation will gradually glide toward levels in line with the inflation aim, it has yet to translate into stronger inflation dynamics." And he maintained that "a very substantial degree of monetary accommodation is still needed for underlying inflation pressures to gradually build up."
Draghi emphasized that policy makers "need to be persistent and patient and prudent". He explained that while there were continued improves in growth momentum, the "inflation rate is still subdued". Overall, to us, Draghi sounds confident and optimistic even though he's still cautious. And as he said, ECB is just "not there yet". Focus will turn to September meeting for more solid stance on tapering next year.
Brexit negotiations concluded with clarifications needed
Staying in Europe, at this end of the second week of Brexit negotiations, EU's chief negotiator Michel Barnier said that "we require this clarification on the financial settlement, on citizens' rights, on Ireland - with the two key points of the common travel area and the Good Friday Agreement - and the other separation issues where this week's experience has quite simply shown we make better progress where our respective positions are clear." And Barnier emphasized that citizen rights should be backed by the Court of Justice of the EU. And he added that there was also disagreement over "the rights of future family members, or the exports of certain social benefits".
On the other hand, UK's Brexit Secretary David Davis said that "we both recognise the importance of sorting out the obligations we have to one another, both legally and in a spirit of mutual cooperation." And, "we have had robust but constructive talks this week. Clearly there's a lot left to talk about and further work before we can resolve this. Ultimately, getting to a solution will require flexibility from both sides."
BoJ pushed back the projected timing for achieving the inflation target
BoJ left its monetary stance unchanged in July. The central bank voted 7-2 to keep its target for 10-year JGBs at around 0% and its short-term deposit rate at -0.1% as expected. It also maintained the measure to buy government bonds at an annual rate of 80 trillion yen. What is more dovish is that the central bank now forecasts it would take longer than previously anticipated for the economy to achieve the 2% inflation target. It is the 6th time that the central bank pushed back the projected timing for achieving the inflation target.
The latest economic projections by BOJ unveiled that the timing for achieving its 2% inflation target has been delayed to sometime during fiscal 2019, from fiscal 2018 previously. Note that BOJ has turned more confident over the GDP growth outlook. At the accompanying statement, BOJ noted that the economy is 'expanding moderately', compared with June's reference that economy was 'turning toward a moderate expansion'. More in BOJ Left Rates and Asset Purchases Unchanged. Pushed Back Timing to Reach +2% Inflation
In the post meeting press conference, BoJ Governor Haruhiko Kuroda said that "European and U.S. central banks have also repeatedly delayed the projected timing for hitting their price targets. Part of the reason was the sharp decline in oil prices, along with other factors beyond the central banks' control. It's unfortunate that we had to push back the timing many times, but our forecasts must be an appropriate one that reflects economic and price developments at the time."
But he sounded confidence that "the momentum for hitting our price target remains intact and can be sustained under the current policy framework." He also emphasized that "the current policy framework is a very flexible one that can respond to economic, price and financial developments at the time. It's also a highly sustainable framework. Once inflation expectations heighten, real interest rates fall further and the stimulus effect of our policy heightens."
Aussie enjoyed brief lift by solid job data
Aussie is lifted earlier today by solid job data but is seen losing momentum. Headline job data showed 14k growth in June, slightly below expectation of 15k. Prior month's figure was revised down from 42k to 38k. Unemployment rate was unchanged at 5.6%. Looking at the details, full-time jobs rose 62k while partly offset by -48k fall in part-time jobs. Australia NAB business confidence was unchanged at 7 in Q2.
Aussie jumped sharply this week as RBA noted that the neutral nominal rate is now at 3.5%. But with reduction in risk aversion and/or increase in trend growth rate, the neutral real interest rate could rise back from current 1.0% to 1.5%. And that indirectly implies that the neutral nominal rate could also follow and rise. Australia Prime Minister Malcolm Turnbull tried to calm the market and said that RBA is only "sending a signal, which is probably prudent, which is to say ... rates are more likely to go up than go down."
On the data front
US initial jobless claims dropped 15k to 233k in the week ended July 15. That matched the lowest second lowest level since the global financial crisis and hovered near a 44 year low. Initial claims stayed below 300k handle for the 124 straight weeks, longest streak since early 1970s. Continuing claims rose 28k to 1.98m in the week ended July 8. And it stayed below 2m level for 15 straight week, best streak since 1973. Also from US, Philly Fed manufacturing index dropped to 19.5 in July, below expectation of 23.7. From Eurozone, current account surplus widened to EUR 30.1b in May. German PPI rose 0.0% mom, 2.4% yoy in June. UK retail sales rose 0.6% mom in June. Swiss Trade surplus narrowed to CHF 2.81b in June. Japan trade surplus narrowed to JPY 0.08T in June. All industry activity index dropped -0.9% mom in May.
EUR/USD Mid-Day Outlook
Daily Pivots: (S1) 1.1498; (P) 1.1526 (R1) 1.1544; More...
EUR/USD rebounds strongly in early US session but it's kept below 1.1582 temporary top. Intraday bias remains neutral and the consolidation from 1.1582 could extend. In case of another fall, downside should be contained by 1.1444 resistance turned support to bring rise resumption. Above 1.1582 will target 1.1615 key resistance first. Decisive break there will pave the way to 1.2 handle next.
In the bigger picture, the firm break of 1.1298 resistance further affirm medium term reversal. That is, an important bottom was formed at 1.0339 on bullish convergence condition in weekly MACD. Further rise would be seen to 55 month EMA (now at 1.1756). Sustained break there will pave the way to 38.2% retracement of 1.6039 (2008 high) to 1.0339 (2017 low) at 1.2516 next. This will now remain the favored case as long as 1.1118 support holds.
Economic Indicators Update
| GMT | Ccy | Events | Actual | Forecast | Previous | Revised |
|---|---|---|---|---|---|---|
| JPY | BOJ Monetary Policy Statement | |||||
| 23:50 | JPY | Trade Balance (JPY) Jun | 0.08T | 0.12T | 0.13T | 0.12T |
| 01:30 | AUD | NAB Business Confidence Q2 | 7 | 6 | 7 | |
| 01:30 | AUD | Employment Change Jun | 14.0k | 15.0k | 42.0k | 38.0k |
| 01:30 | AUD | Unemployment Rate Jun | 5.60% | 5.60% | 5.50% | 5.60% |
| 04:30 | JPY | All Industry Activity Index M/M May | -0.90% | -0.80% | 2.10% | 2.30% |
| 06:00 | CHF | Trade Balance (CHF) Jun | 2.81B | 2.89B | 3.40B | |
| 06:00 | EUR | German PPI M/M Jun | 0.00% | -0.10% | -0.20% | |
| 06:00 | EUR | German PPI Y/Y Jun | 2.40% | 2.30% | 2.80% | |
| 08:00 | EUR | Eurozone Current Account (EUR) May | 30.1B | 23.3B | 22.2B | 23.5B |
| 08:30 | GBP | Retail Sales M/M Jun | 0.60% | 0.30% | -1.20% | |
| 11:45 | EUR | ECB Rate Decision | 0.00% | 0.00% | 0.00% | |
| 12:30 | EUR | ECB Press Conference | ||||
| 12:30 | USD | Initial Jobless Claims (JUL 15) | 233K | 245K | 247K | 248K |
| 12:30 | USD | Philly Fed Manufacturing Jul | 19.5 | 23.7 | 27.6 | |
| 14:00 | EUR | Eurozone Consumer Confidence Jul A | -1.1 | -1.3 | ||
| 14:00 | USD | Leading Indicators Jun | 0.40% | 0.30% | ||
| 14:30 | USD | Natural Gas Storage | 57B |
Trade Idea Update: EUR/USD – Buy at 1.1540
EUR/USD - 1.1560
Original strategy :
Buy at 1.1475, Target: 1.1575, Stop: 1.1440
Position : -
Target : -
Stop : -
New strategy :
Buy at 1.1540, Target: 1.1640, Stop: 1.1505
Position : -
Target : -
Stop : -
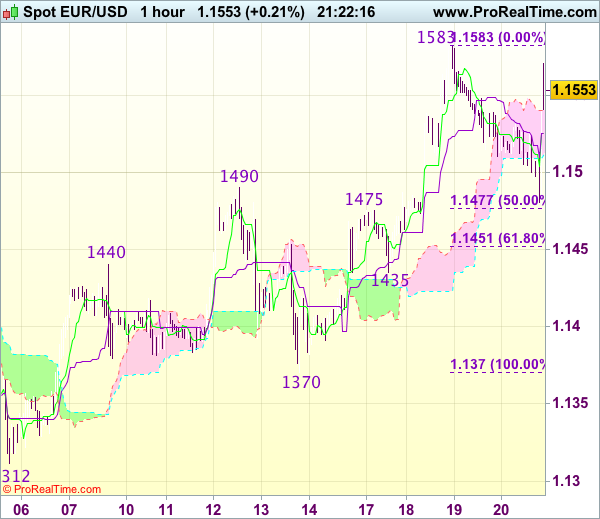
The single currency only slipped to 1.1479 (just missed our long entry at 1.1475) before finding renewed buying interest and current rally signals the pullback from 1.1583 has ended there, hence consolidation with mild upside bias is seen for retest of said resistance, break there would confirm recent upmove has resumed and extend further gain to 1.1600-10 and then 1.1630-40 but reckon 1.1660-65 would hold from here.
In view of this, we are looking to buy euro on dips as 1.1530-40 should limit downside. Only below said support at 1.1479 would abort and signal top has been formed instead, bring retracement of recent upmove to 1.1450-55 (61.8% Fibonacci retracement of 1.1370-1.1583) and later test of support at 1.1435.
Trade Idea Update: USD/JPY – Sell at 112.80 or buy at 111.80
USD/JPY - 112.13
Original strategy :
Sell at 112.80, Target: 111.80, Stop: 113.15
O.C.O.
Buy at 111.80, Target: 112.80, Stop: 111.45
Position : -
Target : -
Stop : -
New strategy :
Sell at 112.80, Target: 111.80, Stop: 113.15
O.C.O.
Buy at 111.80, Target: 112.80, Stop: 111.45
Position : -
Target : -
Stop : -
As the greenback has rebounded after marginal fall to 111.55 yesterday, suggesting a daily of consolidation above this level would be seen with mild upside bias for retracement to 112.50, then towards previous resistance at 112.87 where renewed selling interest should emerge and bring another decline later. Below said support at 111.55 would signal the decline from 114.50 top is still in progress and extend further weakness to 111.20-25, however, reckon 111.00 would hold from here.
In view of this, whilst we are still looking to sell dollar on subsequent recovery, we would also turn long on dips for such a rebound. A firm break above resistance at 112.87 would defer and risk a stronger rebound to 113.10-20 but price should falter below resistance at 113.58, bring another selloff later.

(ECB) Introductory Statement to the Press Conference
Mario Draghi, President of the ECB,
Vítor Constâncio, Vice-President of the ECB,
Frankfurt am Main, 20 July 2017
INTRODUCTORY STATEMENT
Ladies and gentlemen, the Vice-President and I are very pleased to welcome you to our press conference. We will now report on the outcome of today's meeting of the Governing Council, which was also attended by the Commission Vice-President, Mr Dombrovskis.
Based on our regular economic and monetary analyses, we decided to keep the key ECB interest rates unchanged. We expect them to remain at their present levels for an extended period of time, and well past the horizon of our net asset purchases. Regarding non-standard monetary policy measures, we confirm that our net asset purchases, at the current monthly pace of €60 billion, are intended to run until the end of December 2017, or beyond, if necessary, and in any case until the Governing Council sees a sustained adjustment in the path of inflation consistent with its inflation aim. The net purchases are made alongside reinvestments of the principal payments from maturing securities purchased under the asset purchase programme.
Our monetary policy measures have continued to secure the very supportive financing conditions that are necessary to make continuous progress towards a sustained convergence of inflation rates to levels below, but close to, 2% over the medium term. The incoming information confirms a continued strengthening of the economic expansion in the euro area, which has been broadening across sectors and regions. The risks to the growth outlook are broadly balanced.
While the ongoing economic expansion provides confidence that inflation will gradually head to levels in line with our inflation aim, it has yet to translate into stronger inflation dynamics. Headline inflation is dampened by the weakness in energy prices. Moreover, measures of underlying inflation remain overall at subdued levels. Therefore, a very substantial degree of monetary accommodation is still needed for underlying inflation pressures to gradually build up and support headline inflation developments in the medium term. If the outlook becomes less favourable, or if financial conditions become inconsistent with further progress towards a sustained adjustment in the path of inflation, we stand ready to increase our asset purchase programme in terms of size and/or duration.
Let me now explain our assessment in greater detail, starting with the economic analysis. Euro area real GDP increased by 0.6%, quarter on quarter, in the first quarter of 2017, after 0.5% in the last quarter of 2016. Incoming data, notably survey results, continue to point to solid, broad-based growth in the period ahead. The pass-through of our monetary policy measures is supporting domestic demand and has facilitated the deleveraging process. The recovery in investment continues to benefit from very favourable financing conditions and improvements in corporate profitability. Private consumption is supported by employment gains, which are also benefiting from past labour market reforms, and by increasing household wealth. Moreover, the global recovery should increasingly lend support to trade and euro area exports. However, economic growth prospects continue to be dampened by a slow pace of implementation of structural reforms, particularly in product markets, and by remaining balance sheet adjustment needs in a number of sectors, notwithstanding ongoing improvements.
The risks surrounding the euro area growth outlook are broadly balanced. On the one hand, the current positive cyclical momentum increases the chances of a stronger than expected economic upswing. On the other hand, downside risks primarily relating to global factors continue to exist.
Euro area annual HICP inflation was 1.3% in June, down slightly from 1.4% in May, mainly due to lower energy price inflation. Looking ahead, on the basis of current futures prices for oil, headline inflation is likely to remain around current levels in the coming months. At the same time, measures of underlying inflation remain low and have yet to show convincing signs of a pick-up, as domestic cost pressures, including wage growth, are still subdued. Underlying inflation in the euro area is expected to rise only gradually over the medium term, supported by our monetary policy measures, the continuing economic expansion and the corresponding gradual absorption of economic slack.
Turning to the monetary analysis, broad money (M3) continues to expand at a robust pace, with an annual rate of growth of 5.0% in May 2017, after 4.9% in April. As in previous months, annual growth in M3 was mainly supported by its most liquid components, with the narrow monetary aggregate M1 expanding at an annual rate of 9.3% in May 2017, unchanged from April.
The recovery in the growth of loans to the private sector observed since the beginning of 2014 is proceeding. The annual growth rate of loans to non-financial corporations remained stable at 2.4% in May 2017, while the annual growth rate of loans to households increased to 2.6%, from 2.4% in April. The euro area bank lending survey for the second quarter of 2017 indicates that credit standards for loans to enterprises and loans to households for house purchase have further eased and that loan growth continues to be supported by increasing demand. The pass-through of the monetary policy measures put in place since June 2014 continues to significantly support borrowing conditions for firms and households and credit flows across the euro area.
To sum up, a cross-check of the outcome of the economic analysis with the signals coming from the monetary analysis confirmed the need for a continued very substantial degree of monetary accommodation to secure a sustained return of inflation rates towards levels that are below, but close to, 2%.
In order to reap the full benefits from our monetary policy measures, other policy areas must contribute decisively to strengthening the longer-term growth potential and reducing vulnerabilities. The implementation of structural reforms needs to be substantially stepped up to increase resilience, reduce structural unemployment and boost productivity growth. Regarding fiscal policies, all countries would benefit from intensifying efforts towards achieving a more growth-friendly composition of public finances. A full, transparent and consistent implementation of the Stability and Growth Pact and of the macroeconomic imbalances procedure over time and across countries remains essential to bolster the resilience of the euro area economy.
We are now at your disposal for questions.
GBPUSD: Extends Weakness, Remains Vulnerable
GBPUSD: The pair continues to retain its nearer downtrend weakening further on Thursday. Support lies at the 1.2900 level where a break will turn attention to the 1.2850 level. Further down, support lies at the 1.2800 level. Below here will set the stage for more weakness towards the 1.2750 level. Its daily RSI is bearish and pointing lower suggesting further weakness. Conversely, resistance stands at the 1.3000 levels with a turn above here allowing more strength to build up towards the 1.3050 level. Further out, resistance resides at the 1.3100 level followed by the 1.3150 level. On the whole, GBPUSD continues to face downside threats on pullback.
ECB Leaves Rates Unchanged, Draghi in Focus
The Euro slightly depreciated against the Dollar on Thursday, after the European Central Bank left monetary policy unchanged in July. It was widely expected that the central bank would stay put on interest rates, with the spotlight directed towards Mario Draghi's press conference which is likely to come under heavy scrutiny. With Draghi's optimistic remarks in Sintra fuelling speculations of QE tapering by the ECB, investors may seize this opportunity to obtain further clues on whether the central bank will announce plans to reduce its bond-buying program in September. Although the economic conditions in Europe remain encouraging, inflation is still a sore spot and Draghi may be heavily quizzed on this.
If ECB hawks make an appearance and offer bulls some fresh inspiration in the form of renewed QE tapering expectations, the EURUSD may receive a solid welcome boost towards 1.1615. On the other hand, if Draghi picks his words carefully and gives little away at his news conference, the EURUSD is likely to experience a technical correction towards 1.1400.
Sterling bears unfazed positive retail sales
It is interesting how the Sterling tumbled against the Dollar on Thursday despite UK retail sales rising by 0.6% in June thanks to warmer weather. While the impressive rebound in retail sales compared to May's dismal -1.2% decline could raise hopes over the resilience of consumers amid Brexit, such may not be enough to dissolve fears regarding the longer-term outlook for spending. With rising inflation and falling real wages negatively impacting household spending power, concerns still remain elevated over the sustainability of the UK's consumer driven economic growth.
Brexit developments have also played a leading role in the Sterling's selloff today as concerns rose over the negotiations in Brussels smashing into a steel wall. Reports circulating over the lack of breakthrough regarding citizen rights or the Brexit divorce bill, have simply compounded to the Sterling's woes and this can be reflected in price action. With uncertainty still the name of the game when dealing with the British Pound and bears finding inspiration from the Brexit blues, further downside may be on the cards. From a technical standpoint, the breakdown below 1.3000 on the GBPUSD has provided sellers with the permission to attack prices towards 1.2850.
(ECB) Monetary Policy Decisions
At today's meeting the Governing Council of the ECB decided that the interest rate on the main refinancing operations and the interest rates on the marginal lending facility and the deposit facility will remain unchanged at 0.00%, 0.25% and -0.40% respectively. The Governing Council expects the key ECB interest rates to remain at their present levels for an extended period of time, and well past the horizon of the net asset purchases.
Regarding non-standard monetary policy measures, the Governing Council confirms that the net asset purchases, at the current monthly pace of €60 billion, are intended to run until the end of December 2017, or beyond, if necessary, and in any case until the Governing Council sees a sustained adjustment in the path of inflation consistent with its inflation aim. The net purchases are made alongside reinvestments of the principal payments from maturing securities purchased under the asset purchase programme. If the outlook becomes less favourable, or if financial conditions become inconsistent with further progress towards a sustained adjustment in the path of inflation, the Governing Council stands ready to increase the programme in terms of size and/or duration.
The President of the ECB will comment on the considerations underlying these decisions at a press conference starting at 14:30 CET today.
GBP/USD False Breakout? USD/CAD Could Bounce from the Lows; AUD/USD Erased the Yesterday’s Gains
GBP/USD false breakout?
Price dropped significantly in the last hours and ignored a major support line, a valid breakdown below this level will open the door fro more declines in the upcoming period. GBP/USD has turned to the downside as the USDX has managed to rebound and to recover after the impressive drop.
USDX is pressuring the 95.00 psychological level, but is premature to say that we'll have a large rebound in the upcoming days because is still located below a very strong dynamic resistance (support turned into resistance).
The Cable drops aggressively even if the United Kingdom Retail Sales increased by 0.6% in the previous month, beating the 0.4% estimate. The indicator increased significantly after the 1.1% drop in the former reading period.
Continues to move within an ascending channel, but has failed once again to reach the upside line of the chart pattern, signaling an exhaustion. Has failed to stabilize above the 150% Fibonacci line (ascending dotted line) and above the upper median line (UML) of the major descending pitchfork. A valid drop below the UML will bring us a perfect selling opportunity.
I've said in the previous analysis that we should wait to see if we'll have a valid breakout above the UML, a USDX upside increase will invalidate the breakout, the sellers could take full control and could drive the price towards the downside line of the ascending channel.
A broader decrease will be confirmed after a valid breakdown below the first warning line (wl1) of the minor ascending pitchfork.
The perspective remains bullish as long as the rate stays above the warning line (wl1) of the minor ascending pitchfork, we'll have a buying opportunity only if the rate will climb and will stabilize above the UML again.
USD/CAD could bounce from the lows
USD/CAD posted humble gains, but could climb much higher if the USDX will have enough energy to resume the minor rebound. Price is still under massive selling pressure, could drop anytime again and could resume the downward movement if the dollar index will drop again.
USD/CAD changed little today as the buyers are fighting hard to take the lead on the short term, but I want to remind you that the perspective is bearish, we don't have any reversal sign right now. The bias is bearish as long as trading within the minor descending pitchfork's body.
Could still reach the 1.2460 major static low as long as stays below the median line (ml) of the descending pitchfork.
AUD/USD erased the yesterday's gains
AUD/USD reached new highs in the morning, has increased as much as 0.7988 level, the sellers have taken the lead and have send the rate much below the 0.7908 yesterday's low.
Price dropped aggressively ahead the US data, the current retreat was expected after the impressive rally, but this could be only temporary because the perspective remains bullish.
CAC Moves Higher As Markets Eye Mario & Co.
The CAC index has posted slight gains in the Thursday session. Currently, the index is trading at 5229.75, up 0.26% on the day. In economic news, today's highlight is the monthly ECB policy meeting. There was positive news from German and eurozone indicators. German PPI improved to 0.0%, above the estimate of -0.1%. The eurozone current surplus jumped to EUR 30.1 billion, well above the estimate of EUR 23.3 billion.
On Tuesday, the CAC suffered its worst day this month, dropping 0.8 percent. French stock markets were down in response to soft investor confidence surveys in Germany and the eurozone. The ZEW Economic Sentiment surveys gauge the optimism of institutional investors and analysts. Both surveys indicated that investor confidence in June had weakened compare to the May readings. With the eurozone economy improving, analysts attributed the dip in investor confidence as due to the stronger euro, which is making European exports more expensive and thus less attractive for foreign buyers.
All eyes are on the ECB, which will release a rate statement, followed by a press conference with Mario Draghi. In December 2016, the bank tapered QE while extending the scheme until December, and this type of scenario could be adopted once again. Will the bank make a similar move at this meeting? OANDA Senior Currency Analyst Craig Erlam explains that we're unlikely to see any moves today, but the markets are casting a glance ahead to the September meeting:
While we're not expecting any changes from the ECB today, it's €60 billion a month asset program expires at the end of the year and traders are looking for clues regarding what comes next. An announcement on this is unlikely until September when it releases its new macro-economic projections but Mario Draghi may offer some insight into what we can expect during the press conference.
The most likely decision, despite the central bank still falling well short of its inflation target, will be to cut its purchases by another €20 billion as it did in April and extend by another six months. There has been a lot of speculation about a more explicit phasing out but I think the ECB want to be more careful given the fragile nature of the recovery. The result will likely be the same though with the central bank ending its quantitative easing program either at the end of 2018 or early 2019.
President Trump hasn't done very well at learning how to tango with Congress, and this week's debacle on Capitol Hill could make the gap between Trump and Republican lawmakers even harder to bridge. Trump had vowed to replace Obamacare, but his health care bill has stalled in the Senate before lawmakers even had a chance to vote on the proposal. With some conservative Republicans coming out against the bill, it's questionable if the Republicans can pass another version before Congress takes a recess in August. Trump had promised to pass a health care before the summer break, so his credibility will take another hit if he's unable to do so. Trump has been in office for six months, but has been unable to get Congress to pass any significant bills, even though the Republicans enjoy a majority in both houses of Congress. With this latest setback, there is growing skepticism as to whether Trump will be able to convince Congress to pass other key parts of his agenda – tax reform and fiscal spending. This paralysis on Capitol Hill has deepened investor pessimism about Trump's legislative agenda and is weighing on the US dollar.