
Sample Category Title
Market Morning Briefing: Surprising Decline In Dollar-Yen
STOCKS
Dow (21409.07%) is almost ranged for now. No major movement expected on either side. We may see a sideways trade within 21250-21550 region for a few days.
Dax (12437.02%) has been trying to move above 12500 but has not been able to sustain a break on the upside. As mentioned yesterday, 12500 is crucial levels to keep an eye on and only a sustained break above 12500 would initiate a fresh rally towards 12600 in the near term. Else a fall back to 12300 is possible. 2-3 sessions of sideways trade within 12500-12300 looks likely.
Shanghai (3193.89, -0.29%) came down to test 3197 as expected and could bounce back towards 3220 in the next couple of days. There could be some interim dip towards 3190 too before we see a bounce.
Nikkei (20132.38, -0.31%) is almost stable. There is room on the upside towards 20300 but may take a few sessions to reach there. Overall near term looks bullish.
Nifty (9786.05, +0.15%) opened at a high of 9830 but came down sharply to close at 9786. Immediate support is now visible at 9750 and while that holds, we could see a rise towards 9900 in the near term. Near to medium term looks bullish.
COMMODITIES
Nothing new to add as Gold (1218) and Silver (15.89) are trading within the range of 1188-1231 and 15.20-16.10 respectively. We will remain bearish on Bullion while they are trading below 1250 and 16.50 levels. We think the sideways modes within these ranges are expected to remain unchanged, and a bounce towards there resistances can be seen due to near term oversold condition. Today we have Fed Chair Yellen Testifies at 7.30 pm IST which could bring more clarity to determine the future path of Dollar Index and Bullion as well.
Copper (2.68) moved marginally higher in line with our expectation and trading within a range of 2.66-2.78. Only above 2.78 higher resistances of 2.85 can come into consideration. In the medium term 2.55-57 are going to be a strong support and we will remain bullish while it is trading above those levels.
Both Brent (48.17) and WTI (45.77) had moved up and closed to intra-week resistance at 48 and 46 respectively. Today we have U.S Crude oil inventory (8:00 pm IST) with an expectation of a shortage of 3.2M B. If the actual outcome could match the expectation then there will be a decent chance of producing a bounce towards 50 (Brent) and 48 (WTI). Otherwise a surplus in overall inventory could bring bearish possibilities into consideration.
FOREX
As expected, Euro (1.1480) has moved up to and past 1.1460, but faces crucial long-term Resistance in the 1.1520-40 region now. Market sentiment is turning very bullish with voices calling for 1.27-30. Therefore, it would be good to be cautious and not buy the Euro at these levels.
A hint of profit-taking is seen in Euro-Yen (130.27) which saw a high near 130.77 yesterday, short of our target of 131.00, and now trades a little lower. So, as mentioned, we have to be careful about fresh Euro Longs.
Surprising decline in Dollar-Yen (113.46), breaking below support at 113.75 cited yesterday. High was only 114.50 yesterday, well short of our target of 115.00. It seems a lot of people might now be caught with expensive Longs. Need to see how the market handles crucial medium-term Support at 113.15 now. A break thereof, if seen, would lead to 112.50 also.
With this, the Dollar Index (95.60) is edging towards 95.50-40, as expected. The trend is strongly bearish, targeting 94.75 at least, possibly lower.
Within all this Dollar weakness, the Pound (1.2845) has been unable to strengthen. It now trades in the 1.2850-40 Support region mentioned yesterday and needs to stage a strong bounce from here to avoid a deeper decline towards 1.2800-2750. Chances are 50-50 only.
The Aussie (0.7649) has spiked up to 0.7664 today as the Support at 0.7600-7575 mentioned yesterday held well. There might be chances of further strength up to 0.7700 at least, as Copper also looks potentially bullish.
Very importantly, the Chinese Yuan (USDCNY = 6.7880) has strengthend since yesterday, negating the chances of weakness towards 6.82. All this put together might cap upside for Dollar-Rupee near 64.65-70 today.
INTEREST RATES
The US 10-5Yr differential (0.44%) seems to have broken above the medium term channel resistance and in case it sustains, it could rise higher towards 0.46% in the next few sessions.
The US yields by themselves are almost stable but may have some more room on the upside as seen in the longer term charts before falling sharply thereafter. The yields are heading towards long term resistances and could move up in the next few sessions.
The German-US 10Yr (-1.81%) and the German-US 2Yr (-1.98%) have moved up as expected and could continue to rise in the coming sessions pulling up Euro with itself.
EUR/JPY Registered An Amazing Jump, AUD/USD Should Profit By USDX’s Drop, NZD/USD Squeezed A Little
EUR/JPY registered an amazing jump
The currency pair increased sharply in the last days and managed to hit fresh new highs, signalling that the bulls are in full control on the short term. Has managed to climb much above the 130.00 psychological level, cold climb much higher as the Yen is under massive selling pressure versus all its rivals.
The Japanese currency is trading in the red as the Nikkei stock index increased further on Tuesday and closed much above the 20058 broken resistance, however the index could come back down to retest the mentioned broken upside obstacle before will try to approach the 20320 previous high. We'll see how the Yen will react after the release of the Japanese data, the PPI is expected to increase by 2.1% in June, could remain steady at 2.1% for the third month in June, while the Tertiary Industry Activity may drop by 0.5% in May, actually could plunge after the 1.2% growth in the former reading period.
Price rallies and looks unstoppable on the daily chart, is trading much above the broken upper median line (UML) of the major ascending pitchfork and above the median line (ml) of the minor ascending pitchfork. The next upside target will be at the 150% Fibonacci line (ascending dotted line), we may have a minor retreat before will try to reach this level, could come down to retest the median line (ml) in the upcoming days. A minor retreat will be natural after the impressive rally.
AUD/USD should profit by USDX's drop
The Aussie managed to recapture significant ground versus the greenback in the yesterday's trading session and is expected to climb much higher if the USDX slides further in the upcoming days. The dollar index taken a hit from the fundamental factors in the afternoon, that's why the USD has dropped against all its rivals.
Price continues to move upwards within the minor ascending pitchfork's body, the next upside target remains at the 0.7675 level and higher at long term downtrend line. Technically is expected to increase further after the failure to reach the UML again, an oversold will be confirmed only if the rate will escape from the ascending pitchfork's body.
The Australian Westpac Consumer Sentiment will be released later, a positive report will boost the Aussie.
NZD/USD squeezed a little
The pair increased a little in the last hours and recovered after the impressive drop, is still under selling pressure on the short term, despite the USDX's sell-off. Could decrease further and could test and retest some important support levels before will climb higher again.
Has edged lower, but found strong support at the median line (ml) of the minor descending pitchfork, much above the second warning line (WL2) of the major descending pitchfork. However, could slip lower along the median line (ml) till will reach the confluence area formed between the wl4 with the median line (ml).
BoJ Battle With Yields Far from Over | PPI Stable for Now
As economic data continues meanders between Okay and underwhelming, it is hard to envisage how BoJ will take a step back from their mammoth QE program and fight with 10yr JGBs. Yet as bond markets remain under pressure, if central banks do embark on tightening, it will prove an almighty test for BoJ to support their JGB in a falling market.
Producer prices remains steady at 2% YoY, with PPI MoM stalling at 0% for the 2nd month running. Unless we see a tick or two higher next month then we can expect the YoY read to drift to 2%. With CPI also remaining steady at the minor amount of 0.4% YoY, we can be sure that reflationary forces are far from here and monetary stimulus will be here to remain for some time ahead.
With machinery orders contracting a further -3.6% on Monday, there had been hopes for machinery tool orders to pick up some of the slack. Rising by 10.1% in May, the index delivered and revives some hope for capex going forward. Now at 31.1% YoY, it does provide some support for growth and takes off some of the damage from the dire machine orders. By our estimates, machinery tool orders at 0.6% MoM suggests CAPEX of 0.3% QoQ. If this trend continues growth will face severe headwinds in the quarters ahead.
Whilst BoJ continue their debatable narrative of improved growth prospects, we also note there is evidence they believe their own outlook. Money supply (M2) has steadied at 8.7trn Yen, which is almost exactly on the long-term trend. Additionally, M2 has now contracted by -4.5% YoY which suggests they are more confident that the economy is able to support itself whilst they focus on keeping the 10yr JGBs at 'around' 0%.
Yet it is this battle with yields that BoJ are more likely to meet their match. Last year they announced they will keep the 10yr JGB yield close to zero, yet the trend has only risen since and last week moved above 0.1%. This may sound miniscule on a relative basis to other yields, but when you imagine the amount of bond purchasing they must do to keep it this low, then it isn't hard to see the wheels fall off somewhere. In the past two weeks traders have assumed the central banks are coordinating the beginning a (minor) hike trajectory, which has scared investors out of bonds and their yields soaring higher. That is, all but CHF and JPY bond yields. Perhaps the interesting trade will be if BoJ thrown in the towel and let the markets decide where yields should be, in which case the bond markets could indeed collapse and send yields above 0.5%. We doubt the BoJ are ready to do that just yet, especially whilst they still have confidence their own growth trajectory may be achieved. Yet it is something to consider as we approach 2018 if leading indicators do not pick up because, overall, they point to headwinds for growth and lack of reflation.
Next up we have industrial production and capacity utilisation. IP threw another warning signal for growth by contracting -3.3% in May, its lowest rate since 2011. This dragged the YoY read to 5% and, although this may fall further due to three monthly contractions in 5 months. Whilst PMI data suggests support ahead for growth at 52.4, it's unlikely to carry the burden of other weak leading indicators such as Capex and machinery tool orders. Coincident indicators such as Industrial Production are only just starting to underline this point. Therefor we think the battle between BoJ and yields may be the bigger story for 2018 unless leading indicators pick up soon, in tandem.
USD/JPY Double Top Resistance
With EUR/USD breaking out of channel resistance and reeking havoc on our shorts, this bout of risk trading does offer alternate opportunity over on USD/JPY.
Take a look at the 4 hourly chart below:
USD/JPY 4 Hourly:
As I mentioned above, with resistance on EUR/USD breaking out, we’ve seen USD/JPY’s hold, and markets get back into correctly correlated sync with one another.
You can see the 4 hourly double top forming and price subsequently being rejected from the second touch of the level.
Zoom into the 15 minute chart…
USD/JPY 15 Minute:
…and you can see that price is putting in the familiar stepping down pattern that we like to see intraday.
Smoke There’s Fire
Smoke There's Fire
A unified Eurozone versus a US administration looking a little pained and discombobulated after yet another vexing Russia headline was the catalyst to send the EURO soaring.AS the political drama ‘of, by, and for the people” was unfolding but linking an unforeseen Russia-gate admission by Donald Trump, Jr and dovish Fedspeak was fire enough in to topple the greenback in thinly traded summer markets. How significant the latest Trump developments are to the broader market landscape is debatable, but one obvious take from overnight headlines was an unexpected policy shift from Patrick Harker, by failing to cement the markets call for a third 2017 rate hike.
Today's revelation that a series emails by Donald Trump Jr., confirming he was offered Russian government help for the Trump election campaign has sent US political risk to another level. Investors are once again questioning President's Trump's administration ability to pass through a pro-business agenda/attitude/stance to further stimulate the US economy, not to mention his sustainability to run the country.While the headlines are not impeachment worthy news, the market buzz does suggest the risk of impeachment proceedings is marginally higher than in the past.But each progressive revelation of the current administration's incompetence is wearing thin on investors psyche that even the most ardent conservative must now have second thoughts about their Nov ( 2016)election day decision. Needless to say what little support that remained for the strong-dollar theme this week quickly evaporated
On Fed speak while the market was waiting for Lael Brainard, a leaning dove, Fed Harker's unexpected WSJ interview 30 minutes after Jr's headlines suggesting the Feds remain in wait-and-see mode drove the final nail in the dollar's coffin during the overnight session.
Fed Chair Yellen's semi-annual monetary policy testimony will be the main event today, but given the Humphrey-Hawkins Testimony is very much a repeat of the latest FOMC minutes, and given the heightened US political risk the market is more focused on political headline risk in early APAC. Nonetheless, the market expects Yellen to frame the commencement of balance sheet normalising around a comparatively upbeat economic assessment, but even this tone is unlikely to shift the current dollar tide.
It didn't take much for the market to fold their cards on a long dollar trade this week which suggests this Fed-inspired move could have some legs and perhaps only a surprising shift in US CPI or Retail Sales data later in the week could stem the current tide.
G-10
As the headlines rolled in US yields fell by the minute pressuring the USD in G10. USDJPY toppled to 113.75, while EURUSD looked toward 1.1500 While Donald Trump, Jr.'s email release appeared to have started the move, I was Fedspeak l which drove the dollars short term demise home. With CPI around the corner and Harker suggesting that inflation will determine whether a third rate hike in 2017 is on the cards, speculative money suggests the view heading into this week's CPI is that of non-transitory.
USD/CAD Canadian Dollar Lower Ahead Of Bank Of Canada Rate Decision
Strong growth and concerns for household debt trigger rate decision
The USD/CAD was trading above 1.34 in mid June when Bank of Canada (BoC) Deputy Governor Carolyn Wilkins delivered a speech to a business school crowd and started a swift recovery of the loonie that has the currency pair trading at 1.2927. The central bank cut rates twice in 2015 and has stayed in the sidelines since then, but it is now widely anticipated that the BoC will hike rates this year, with the July meeting firmly on the table.
The Bank of Canada (BoC) will release its rate statement on Wednesday, July 12 at 10:00 am EDT. The Canadian central bank joined the hawkish chorus in June taking the market by surprise and quickly pricing in a rate hike after repeated comments from senior BoC policy makers. The bond market is pricing in a rate hike of 25 basis points to leave the benchmark rate at 0.75 percent based on the remarks by the central bank Governor Stephen Poloz although some financial institutions remain unconvinced that the strong GDP growth does not warrant as a reduction in monetary stimulus. There will be a press conference at 11:15 am EDT where more details will be shared by the BoC Governor.
Fed Chair Janet Yellen will be giving her semiannual monetary policy report to the US House Financial Services Committee on Wednesday, July 12 at 10:00 am EDT and to the Senate Banking Committee on Thursday, July 13 at 10:00 am EDT. FOMC members will be speaking during the week reiterating the high probability of another rate hike and the imminent start of the central bank’s balance sheet reduction sooner rather than later.
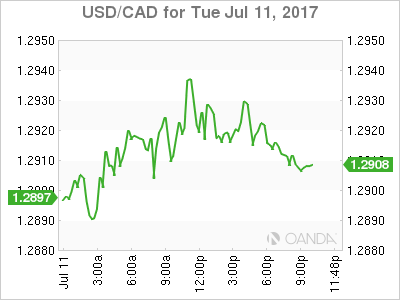
The USD/CAD rose 0.288 percent in the last 24 hours. The currency is trading at 1.2916 ahead of the Bank of Canada (BoC) rate statement announcement on Wednesday. The loonie has lost some momentum as risk aversion triggered by the release of Donald Trump Jr’s emails have once again put political uncertainty in the US agenda. The bond market is pricing in a move by the BoC, but there are plenty of doubters amongst economists as evidenced by the Reuters poll published last week. Fourteen of 31 economists expect a rate hike on Wednesday. The quick change in stance from the BoC makes some question the timing but there is no denying that growth has been stronger than forecasted and the impact of falling oil prices has been contained.
Domestically there are concerns about the ballooning of household debt as cheap rates fuelled various real estate bubbles in the country. The move to a tighter monetary policy will be gradual although it could include a second rate hike before the end of the year if the economy continues to perform and other central banks continue to move towards the end of low rates.
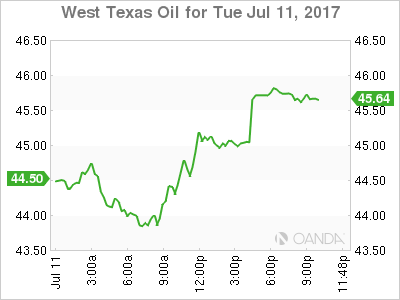
Oil rose 1.412 percent on Tuesday. The price of West Texas Intermediate is trading at $45.02 after forecasts for US production were lower and there is increasing talk about Nigeria and Libya after having resumed their full output will now have to participate in the production cut agreement.
US output has not grown at the same pace of the Organization of the Petroleum Exporting Countries (OPEC) agreed cuts with other producers forcing a reduction in forecasts for next year. Rigs in the US have been coming back online at a slower pace than expected and comments form Russia being open on further reducing output boosted crude prices.
The OPEC and other majors producers joined up in an attempt to lift oil prices from the floor by agreeing to cut production for 6 months in 2016 and adding a 9 month extension that will take the deal into 2018. The monitoring committee will meet in Russia on July 22 to discuss the state of affairs. Nigeria has been invited to attend in a move that could signal its inclusion into the production limit that it was previously exempt.
The release of the US weekly crude inventories will be followed by traders looking for more data on US production. The Energy Information Administration (EIA) will release the weekly report on Wednesday, at 10:30 am EDT. A 3.2 million barrel drawdown is expected to follow the 6.3 million barrel drop from the report published last week.
Market events to watch this week:
Wednesday, July 12
4:30am GBP Average Earnings Index 3m/y
10:00am CAD BOC Monetary Policy Report
10:00am CAD BOC Rate Statement
10:00am USD Fed Chair Yellen Testifies
10:30am USD Crude Oil Inventories
11:15am CAD BOC Press Conference
Thursday, July 13
8:30am USD PPI m/m
8:30am USD Unemployment Claims
10:00am USD Fed Chair Yellen Testifies
Friday, July 14
8:30am USD CPI m/m
8:30am USD Core CPI m/m
8:30am USD Core Retail Sales m/m
8:30am USD Retail Sales m/m
Gold Subdued As Yellen Testifies On Capitol Hill
Gold is showing limited movement on Tuesday. In the North American session, spot gold is trading at $1214.30 per ounce. In economic news, JOLTS Jobs Openings dropped sharply to 5.67 million, well below the forecast of 5.98 million. In the US, Federal Reserve Chair Janet Yellen will testify before the House Financial Services Committee.
Although gold is having a quiet week, that could change after Janet Yellen’s testimony before a congressional committee. Janet Yellen is sure to be questioned on whether the Fed is still expecting to raise rates in the second half of the year. Despite repeated statements from Fed policymakers that a rate hike is likely in December, the markets are not as confident, even with last week’s strong Nonfarm Payrolls report. A rate increase in September is very unlikely, with the odds pegged at just 13%, according to the CME Group. As for December, the likelihood of a rate hike is 50%, so the markets will need plenty of convincing that the Fed plans to make a move. Investors will remain lukewarm about the chances of a rate hike unless growth and inflation numbers improve. The US economy slowed down in the first quarter, with GDP rising just 1.4%. Currently, inflation is well below the Fed’s target of 2%, and although Janet Yellen recently stated that the factors weighing on inflation were temporary, investors aren’t convinced. Another factor that has entered the equation is the Federal Reserve’s balance sheet. The Fed has outlined plans to reduce its bloated balance sheet, but has avoided providing any specifics. If the Fed started to lower the balance sheet in September, such a move would mark a vote of confidence in the economy and raise speculation of a rate hike to follow in December.
Gold prices are inversely linked to interest rate hikes, so recent developments involving central banks (aside from the Fed, which continues to talk about a December rate hike) could have a significant impact on the metal. At the recent ECB forum, the heads of the ECB and Bank of England made hawkish statements about tightening monetary policy, and the euro and pound reacted with sharp gains. As well, the Bank of Canada has sent out messages that it will raise rates, and the markets are expecting a quarter-point hike on Wednesday, which would mark the first rate increase in two years. The trend towards tighter policy should not be a complete surprise, as the global economy has been improving in recent months. The ECB and BoE have yet to make any rate moves, but the fact that policymakers are deliberating over tightening policy could lead to expectations in the markets of rate hikes, which in turn would send gold prices lower.
How to Build a Successful Expert Advisor
Automated day trading is probably one of the most exciting things for day traders in the forex community. It offers traders the option to build a mechanical trading system; one that doesn't require human intervention and one that can, of course, make money consistently.
Many traders at all levels often try to test different expert advisors. While there are some good working Forex EA's, it can be a difficult task initially. There are also inherent risks of using an expert advisor, the one that you don't know about.
Three steps to building your EA
In this article, we look at some ways traders can build or plan on how to use an EA.
Step 1
The first step is of course in having a strategy in mind. There needs to be a balance between mechanical rules and discretion. A discretionary based trading system can often be difficult (but not impossible) to code. The downside, of course, is the cost required to code, test and the subsequent iterations.
For traders, the most part of the time needs to be dedicated towards finding a trading strategy. Using the default set of technical indicators is a better option as it can reduce your cost of coding.
Secondly and more importantly, traders should really understand how the indicators work. Simply assuming that short-term and long-term moving average crossovers are bullish and bearish doesn't make sense.
Traders need to spend the time to see under what market conditions the indicators work.
It is also important to have a good money management strategy in mind. Do you want to trail your stops or do you want to take fixed profits? Asking these questions can help traders in the long run. This will incorporate sound principles into your overall strategy.
Step 2
Once the ground rules are in place, building an indicator is the next step. This customized indicator is the middle ground between manual trading and automated trading.
Based on your trading strategy, you can build an indicator that will signal buy and sell conditions on your chart. You can also incorporate take profit and stop levels if it comes to that.
This customized indicator will ensure that you can understand if there are any flaws in your trading system. Based on the strategy used, ensure that the customized indicator can also plot buy/sell signals on price history.
This can offer a quick visual back test that can point you to any potential downsides of your trading strategy that you need to be aware of.
If there are any mistakes, go back to step 1 and reconfigure the settings and apply these to the customized indicator.
It is important to also ensure that you do not fall into the trap of curve-fitting your strategy that will eventually become an expert advisor.
Step 3
Once you are convinced with the performance of step 2, the next step is to make a list, typically like an algorithm. While building the requirements, make sure to have lots of examples, including charts with detailed explanations.
The better your developer understands the requirements, the more robust your expert advisor will be.
Hiring a developer for your EA
Before hiring a developer ensure that you sign any confidentiality agreements about the strategy. Although one needs to realize that in an online world, there is no guarantee that your strategy will be kept secret.
Hiring individual developers is a better option than a company as there is less chance that the developer will tweak your code and re-sell it.
When giving requirements to the developer it is always in your best interests to have them put explanations in the code so that it is easy for the next developer, should you want to switch the developers at a later stage.
Looking for developers on the MQL5 market place or cTrader community can be the best ways to get started. Always make sure to look at the past work of the developer before committing.
In conclusion, designing your own EA is probably one of the most exciting things one can do. If you follow a mechanical trading system, chances are that you can convert that into an EA and exploit your strategy to the fullest.
Questions You Need To Ask Yourself Before You Enter A Trade
There are many different approaches to trading. From technical signals given by the indicators to the fundamentals that become the driving force in the asset or instrument. Put a few traders in a room and chances are that they will trade the same asset or instrument differently.
Despite the different approach to trading, there are some key questions that every trader should ask themselves and should be able to answer. Knowing the ins and outs of the instrument or asset that is being traded will put you in control of what you are doing.
If in doubt, ask these five questions in order to understand whether you are trading the asset or instrument in question knowing the details about it or whether you are merely trading with no clear details.
1. What is the asset doing?
This falls under the technical purview. When you are trading or want to trade a currency pair, the first question to ask is what is the asset or instrument doing? Is it going up or going down?
Where are the support and resistance levels? Is the market in a bullish or bearish trend?
Answering these questions will help you to get a better understanding of what the instrument is doing and how it is likely to behave.
From a trading perspective, this means that you will know when you are wrong in your bias and where to cut your losses.
2. What is driving the price?
Despite the fact that many day traders, especially in forex, tend to trade with technical analysis, it is important to know the fundamentals that are driving prices.
This means taking a look at the central bank speeches, interest rates, and the economic outlook.
Know the fundamental reasons will give you a broad idea of what other traders are looking at and thinking.
You can also use this knowledge later on while managing your trades to see if there is any shift in the bias.
This will ensure that your emotions are put in check, and more importantly you will know why you trade went to fill the take profit level or hit your stop loss.
3. What are other traders thinking?
The markets move on expectations. Price is always forward looking and continues to discount any new information. At times, the markets can get ahead of themselves. This is commonly found with diverging expectations between traders and central bank decisions.
At times you will also find this with the markets and economists extremely hawkish on an economic indicator only to find that the actual data was very disappointing.
A very good recent example of this can be the "Trump Trade." The markets rallied and continued to rally for a few months on. This rally came merely on traders' expectations that Trump's fiscal stimulus plans would help to boost inflation figures.
No sooner did the markets get a reality check only then did traders start adjusting their expectations accordingly.
4. What is your trading plan?
It goes without saying that trading without a plan can be disastrous as you will be caught in the crosswinds.
Times like this, due to lack of a plan, your emotions can begin to take control. This is when your money management and strategy can go for a toss.
From attempting to make money, you will soon switch to attempting to cut your losses.
But with emotions, this can be difficult, and as a result, you will end up taking a bigger hit. This could potentially put all your previous profits and trading capital at risk as well.
5. Why are you trading this particular asset or instrument?
The last but most important question to ask is why are you trading a particular asset or instrument.
In most cases, you will find the answer if you have already replied to the first four questions. Asking "why this instrument" can help you to form the full picture that combines both technical and fundamental analysis, as well as bringing in your trading strategy and plan.
Remember that trading requires a bit of discipline and a certain approach at all times.
It is important to have a disciplined approach to trading as it can always keep you grounded while also bringing some logic and objectivity to the markets that you want to trade.
How to Trade Using Oscillators
Using oscillators is very prominent in the world of trading, whether you are just beginning or have been trading professionally for years. Oscillators are based on math formulas and are categorized as inductive statistics. In forex, they make up a vital part of technical analysis since they are used to confirm market trends, signal when a trade is being overbought or oversold under extreme conditions, and also inform the trader when the market's movement is about to reverse due to loss of momentum.
Common Practice with Oscillators
Most types of oscillators swing close to the baseline, as they are rooted near the bottom of a price chart. The baseline -will undoubtedly vary depending on the oscillator and the mathematical calculation used. Common practice with oscillators is to use the zero line, but both 50 and 100 baselines tend to come up often.-
Basic Terms for Oscillators
Baseline Crossing
When the oscillator crosses the baseline, a buy or sell signal is generated. If you were to combine the oscillator with trend analysis, the signal's strength would be amplified. Therefore, signals that are triggered by intersecting the baseline should be in tandem with the prevailing direction of the trend.
Overbought/Oversold
Since some oscillators are bounded, they naturally come with both lower and upper borders. The most common boundaries are 0 and 100; that is to say, the tool oscillates on a range between 0 and a 100.
These bounded types of oscillators come with predefined overbought and oversold bounds.
Some of the most popular overbought and oversold bounds include 70/30 for RSI, 80/20 for Stochastics and 100/-100 for CCI.
If the oscillator goes above the overbought level (i.e. the upper bound), this indicates that the price has been trading at extremely high levels which means that opening a new long position would be quite risky.
Conversely, if the oscillator goes below the oversold level (i.e. the lower bound), this indicates that opening any new short positions may be too risky as prices are trading at extremely low levels.
Traders may stick to the above rules, except in the beginning stages of a new trend. Once a fresh trend arises, oscillators have a tendency to move into oversold and overbought spaces very fast, indicating that the trader may consider not to open new long or short positions. But in this case, that particular rule could be ignored.
Divergence
Another way of analysing oscillators is through divergence; a particularly valuable method, mainly when a trend has momentum and the oscillator has reached extreme levels. A divergence between the price and the oscillator is like a signal that the trend in question is nearing its end and either a reversal or a consolidation is highly probable. For instance, if the price is going in an upwards direction and forming higher tops and higher bottoms, but the oscillator does not form a higher top, then this is a so-called 'negative divergence warning' that a downside reversal is possible.--
On the other hand, if the price is on a downward track, forming lower tops and lower bottoms on its way, and the oscillator doesn't form a lower bottom, then this is a positive divergence signal that an upside reversal is likely.
In essence, divergence is an early-stage warning. It alerts the trader about a possible reversal before the actual reversal becomes visible. This is every trader's dream but it's important to remember that it is only a warning, not a guarantee and not a buy or sell signal! One must practice patience, and keep an eye on the price reversal before any new positions are opened. Never forget: price is the boss!
Conclusion
The majority of traders use oscillators. Their value is derived from the fact that they confirm trend directions, as well as signals for buy and/or sell opportunities. They also warn against extreme -price levels and alert the trader -when a current direction is nearing its end. Oscillators are also famous for giving traders a heads up about impending reversals before they even appear on the chart. Remember, oscillators should always be used together with price chart analysis. -