
Sample Category Title
US Political Uncertainty = Lower USD
Markets were somewhat languid as traders focused on today's Congressional Testimony by Fed Chair Yellen, the Bank of Canada interest rate decision and the latest US Crude Oil Inventory data release. However, news was released that President Trump's son, Donald Trump Jr, was told in an email that Russia wanted to aid his father's Presidential campaign. Donald Trump Jr was forced to release damning emails showing that he welcomed what he was told was a Russian government attempt to harm Hillary Clinton's election campaign. The emails show music promoter Rob Goldstone telling the future US president's son that 'the crown prosecutor of Russia' had offered 'to provide the Trump campaign with some official documents and information that would incriminate Hillary and her dealings with Russia and would be very useful to your father' to which Trump Jr. replied 'I love it!'. Could more US Political turmoil be ahead? Such news saw a sell off for USD and US equities.
USDJPY reached highs not seen since early March, trading up to 114.494, representing a 0.4% gain on Tuesday, before giving back these gains to trade as low as 113.31 overnight. Currently, USDJPY is trading around 113.50.
EURUSD has reached levels not seen for 14 months as USD retreated yesterday and EUR has continued to strengthen overnight. Currently, EURUSD is trading around 1.1480 after reaching a high so far today of 1.14888.
NZDUSD was down on the day following reports from the US Geological Survey that a tremor, measuring 6.8 magnitude and at a depth of 6.2 miles, had been registered 122 miles north west of Auckland. After opening at 0.7257, NZDUSD traded down to 0.72011. Currently NZDUSD is trading around 0.7240.
EURGBP reached levels not seen since November last year, trading up to 0.89129 on Tuesday, a 0.75% gain on the day. The recent strength in EUR, coupled with unimpressive UK economic data releases and continued domestic uncertainty in the UK, has resulted in GBP weakness – especially against its European counterpart. EURGBP has strengthened more overnight to reach a high of 0.8938 and is currently trading just below this level at around 0.8930. GBP also weakened against USD trading down from an early high of 1.29268 to a low of 1.28306 on Tuesday. GBPUSD is currently trading around 1.2850.
Gold recovered from early lows set at $1,208.06 to rebound as high as $1,217.27 on Tuesday. Of note were recently released statistics that showed, during the first half of 2017, Indian buyers brought in a full 521 tonnes of gold. This is more than the import total for the whole of 2016, when just 510 tonnes of bullion was imported for the year. If this level is maintained, then imports for all of 2017 could be greater than 1,000 tonnes – an amount not seen for over 5 years. Bullish sentiment remains as Gold is currently trading at the session high of $1,220.43.
Oil gained as much as 1.6% on the day, as OPEC's Secretary General Barkindo, when asked by reporters in Istanbul 'what else the Organization of the Petroleum Exporting Countries could do to ease a global oil glut', replied with 'It is beyond any group of stakeholders, it has to be a collective responsibility of all producers'. WTI is currently trading at the session high around $46.08pb.
Today, at 15:00 BST, Fed Chair Yellen will testify before congress in regards to the current economic conditions in the US and strategy to improve growth. Focus will be on the 'tone' of her testimony and any clues as to future interest rate rises will likely be posed in the Q&A session that follows afterwards.
At the same time, the Bank of Canada releases its Interest Rate decision. Overnight Index Swaps are 'signaling' an 86% probability of an increase from 0.5% to 0.75%, although some market observers are upholding the view that Governor Poloz will keep the key overnight rate steady.
At 15:30 BST the EIA Crude Oil Stocks change report will be released. Another drawdown in US inventories is expected with the consensus being -3.225M, nearly 50% less than the previous draw of -6.299M. Even with a 'reduction' in inventories Oil supply remains strong and, even with the typical higher demand in Summer, prices are likely to remain under pressure.
Currencies: Dollar Sold As Political Noise Weighs
Sunrise Market Commentary
- Rates: US political scene interrupts core bond sell-off
Some risk aversion related to the leaked Trump Jr. emails could remain dominant in the run-up to Yellen's testimony in front of US Congress (positive core bonds). We expect her to hold the Fed's line (start run-off BS soon and 1 more hike in 2017) which shouldn't cause strong market moves. - Currencies: Dollar sold as political noise weighs
The dollar remained in wait-and-see modus after the payrolls. It looked that this pattern would continue going into Yellen's semi-annual testimony. However, a new flaring up of political noise trigger USD selling. The dollar probably needs outright positive news to make a U-turn. Will Yellen's message be strong enough to deliver so?
The Sunrise Headlines
- US stock markets lost around 0.5% after the Trump Jr. emails, but managed to overcome those losses to close nearly unchanged. Overnight, Asian stock markets trade mixed with Japan underperforming (-0.5%).
- The US president's eldest son attended a meeting last year to discuss allegedly incriminating information about Hillary Clinton they were told was being offered by the Russian government in support of Trump's candidacy.
- Fed Governor Brainard embraced the plan to reduce the balance sheet "soon," but suggested her support for any future rate increases will depend in part on how inflation shapes up.
- EU finance ministers called for speedier unloading of bad debt by EU banks and recommended more money be put aside by the banks to protect them from trouble.
- Emerging Europe is facing increasing economic stresses that threaten to unwind some of the political progress made over the of past decades, top IMF official Thomsen said.
- The US Senate will delay the start of its August recess to give lawmakers more time to plough through a backlog of pending nominations and proposed legislation, including healthcare reform.
- Attention turns to Yellen's testimony to US congress. Fed George and ECB Visco are also on the wires. The eco calendar is thin with EMU industrial production and the Fed's beige book. The US, Germany and Portugal tap the market.
Currencies: Dollar Sold As Political Noise Weighs
USD declines further on 'political noise'
The payrolls left markets with a mixed feeling on Friday. Employment growth was strong, but wages disappointed again. It didn't help the dollar. EUR/USD hovered within reach of the recent highs. The recent rise in core (US/EMU) yields kept USD/JPY better supported. It looked that this pattern could continue till Yellen's testimony before Congress today. However, soft comments from Fed's Brainard and the release of new emails on contacts of Donald Trump Jr with Russia spoiled the game. The dollar was hit quite hard on this flaring up of political uncertainty. EUR/USD closed the session at 1.1467. USD/JPY reversed part of its recent gain even as the congruent correction on the US equity markets was limited and short-lived. USD/JPY closed the day at 113.94.
This morning, Asian equities are trading mixed to slightly softer in the wake of yesterday's US political developments. The dollar remains in the defensive. USD/JPY is declining further in the 113 big figure (currently at around 113.45) even as the BOJ raised bond purchases in the 3-5-year sector to prevent a further rise in Japanese yields. EUR/USD trades with a positive bias, setting a new correction top in the 1.1489 area. Asian investors are looking forward to the Testimony of Fed's Yellen before Congress. The trade-weighted USD (95.55 area) is nearing the recent lows.
Today, EMU data (May production) will have no big impact. Early this morning, markets will look out whether there is any further fall-out from the Trump-Russia commotion on global (equity) markets. The damage should be limited, but the weaker dollar might weigh on European equities. The focus will be on Yellen's Testimony before Congress. The written testimony will be published at 14.30 CET. The Q&A will start after 16.00 CET. We expect Yellen to keep a balanced approach. She will probably confirm the start of a gradual reduction of the Fed 's balance sheet in the near term. She might be a bit less outspoken on the timing of additional rate hikes. She will probably confirm the Fed's intentions on policy normalisation, but reiterate that the Fed remains data-dependent.
Dollar sentiment remained fragile after the payrolls. Yesterday's political noise in the US forced more stale USD-longs out of their positions. The dollar clearly needs outright good news to succeed a sustained rebound. We expect Yellen's message to be positive, but balanced. This is probably not enough to change fortunes for the dollar short-term. Friday's CPI and retail sales are a next important milestone
Yesterday, the Trump headlines clearly were a short-term negative for the dollar. On the other hand, there are signals that Republicans in Congress are stepping up efforts to strike a deal on healthcare in the near future. If so, the prospect for tax cuts might become more realistic further down the road. At some point, such a scenario could help to put a floor for the dollar. However, in a day-to-day perspective, it is probably too early to play this card.
EUR/USD: Political noise weighs on the dollar. EUR/USD sets new correction top
EUR/GBP
Technical picture: USD looking for a bottom
A combination of hawkish ECB comments and weaker US eco data pushed EUR/USD above the 1.1300/66 resistance area. The payrolls were not good enough to trigger a sustained USD rebound. A next resistance in the 1.15 area is looming. LT-correction tops stand at 1.1616/1.1714. A break would end the long consolidation period that followed the sharp decline of EUR/USD in 2014/early 2015. Such a key area will be difficult to break for now. A return below the 1.13 area would be a first indication of a loss in upside momentum. EUR/USD 1.119 is the next important support.
The USD/JPY rally ran into resistance in early May and the pair returned lower in the 108.13/114.37 range. The post-Fed USD rebound pushed the pair above the 112.13 correction top, but follow-through gains remain modest. So, the jury is still out. USD/JPY 114.37 resistance was tested, but for now the test is rejected. This at least suggests a pause in the recent USD/JPY uptrend. Sterling hit as market questions rate hike chances
Sterling was in the defensive yesterday. There were few eco data to guide trading. Some cautious comments from BoE Broadbent on the UK economy post-Brexit weighed on sterling. The rise in EUR/USD later in the session also supported EUR/GBP. EUR/GBP closed the session at 0.8925. Cable didn't profit from the USD decline and closed the session at 1.2848.
This morning, there were again headlines from BoE Broadbent. In an interview, Broadbent indicated that he is not ready to support a rate hike anytime soon. This weighs further on sterling. Later today, the UK labour market data will be published. Employment growth is expected to remain solid, but wage growth to remain soft. If confirmed, this scenario won't help sterling much. From a technical point of view, EUR/GBP set a minor top north of the 0.8854/66 resistance (2017 top). A sustained break didn't occur, causing some consolidation last week. However, a sharp short-squeeze propelled the pair north of 0.89 yesterday. Quite some sterling negative news should already be discounted at current levels. Even so, the short-term trend remains euro positive/sterling negative. A test of the 0.90 barrier might be on the cards.
EUR/GBP technical break higher
Markit PMI’s Signal Weaker Growth In Q2 For The UK
Markit/CIP's purchase manager index data for the month of June showed a broad based decline in the pace of activity. Markit's data suggested that business activity in the UK increased at the weakest pace in four months during the month of June.
The Markit/CIP's all sector PMI index fell to 53.9 in June, compared to 54.5 in May and marked a second monthly decline in the index. Output across the manufacturing, construction, and services sector was consistent with the data.
The services PMI released last week showed a headline reading of 53.4 in June which 0.4 points lower from 54.8 that was registered in May. Growth in the services sector was seen slowing for the second consecutive month. The decline in the acceleration was attributed to weaker consumer spending.
Markit's data showed that in the services sector, hotels and restaurants alongside other consumer-facing businesses witnessed a decline. On the other hand, business services including finance and IT continued showing robust growth, sending mixed signals.
Construction activity as measured by Markit's construction PMI was also lower. Falling sharply from 56.0 in May, construction activity index fell to 54.8 in June. This was a decline after construction activity hit a 17-month high.
The manufacturing activity fell to a three-month low to 54.3 in June and down from 56.3 that was registered in May. Despite the decline, manufacturing activity in the UK remains in an expansionary mode for the past eleven consecutive months.
Rob Dobson, an economist at IHS Markit, said that the UK's manufacturing sector had weathered the uncertainty of the general elections that were held in June, which brought more uncertainty to the markets on top of the Brexit negotiations.
Manufacturing activity showed a broad based decline in output including consumer, investment, and intermediary goods.
Inflows of new orders across three sectors were also seen slowing and saw the smallest increase in over nine-months.
UK business and consumer outlook remains mixed
Despite the decline, the surveys signaled that the second quarter performance might not be as bad as initially thought. Given that the PMI's posted a strong increase in activity in April, the all-sector PMI's hinted that the UK's gross domestic product or GDP was around 0.45% on the quarter on average.
Markit, UK PMI and GDP comparison (June 2017). Source: Markit
The PMI's also signaled that hiring was robust with businesses seen adding new jobs which were also running at the highest rate in nearly one and a half years. This was seen to be consistent with the view that companies continued to remain in an expansionary mode.
On the flipside, there is evidence building up that there could be further risks to UK businesses in the coming months. Business confidence over a 12-month outlook was seen to have weakened significantly. Businesses reported that the outlook could deteriorate further given the ongoing uncertainty in the UK as it would make negotiations difficult with the UK government and the EU.
The PMI's also showed that inflation could remain mixed. While input cost inflation rose, it was still below the levels seen earlier in the year. Input cost in the manufacturing sector was seen to have weakened significantly.
What does this data mean for the BoE?
The Bank of England governor Carney took a hawkish turn a week ago at the banking conference in Portugal. However, it is quite likely that BoE policy makers will acutely scrutinize the data.
Inflation is without a doubt the elephant in the room, however, aslowdown in consumer spending and weaker pace of wage growth could be seen as some of the factors that could limit the BoE's hawkish intentions.
This week, data from the UK will include manufacturing and industrial production numbers alongside the monthly jobs report which could add further evidence to the divergence between wages and consumer prices.
Traders Focus On BoC, Yellen And UK Jobs
The US dollar was overtaken by the bearish sentiment yesterday. Lack of any clear fundamentals saw investor focus on the politics. A series of emails disclosed by President Trump's oldest son showed that he cited support from Russia in the 2016 election campaign. The euro reversed its modest losses while gold prices also posted a comeback posting a reversal off 1204 lows.
Looking ahead, the economic calendar picks up the pace. In the UK, the ONS/ILO monthly jobs report data is expected to show that the average pace of wages increased just 1.8% compared to 2.1% previously. This would mark another slowdown in the pace of wage increases. The UK's unemployment rate is expected to remain steady at 4.6%.
In Canada, the BoC's interest rate decision is coming up. Economists are forecasting that the Canadian central bank will hike interest rates by 25 basis points at today's meeting. This will bring the BoC's interest rate to 0.75%, up from 0.50% previously.
The Fed Chair, Janet Yellen will also start her two-day testimony to the Congress and the markets will be eagerly awaiting for any comments from the Fed chair towards the interest rate and balance sheet normalization.
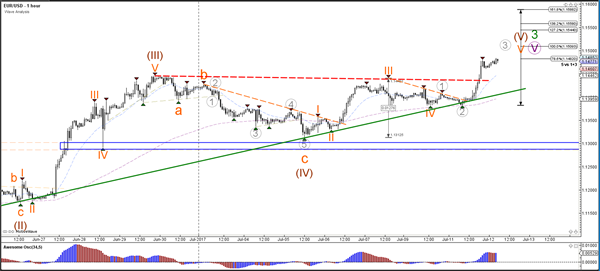
EURUSD intraday analysis
EURUSD (1.1478): The EURUSD closed bullish yesterday rising to a fresh 14-month high. The currency pair was seen comfortably closing above 1.1450, with price action currently testing the highs near 1.1477. On the 4-hour chart, the EURUSD is seen breaking past the previous resistance established at 1.1445 level. This resistance level could be briefly tested for support in the near term. As long as the support holds, EURUSD could be seen posting further gains. However, failure to bounce off the support level could signal a near-term decline towards 1.1311 where the next support level exists. The Stochastics oscillator on the 4-hour chart is signaling a bearish divergence which could suggest that the upside momentum could be weakening.
GBPUSD intraday analysis
GBPUSD (1.2849): The British pound continued its decline with price action forming an outside bar yesterday following the doji close the day before. Further declines could see GBPUSD extend the declines down to 1.2800 support level as a result. Off the 1.2800 support, we could expect to see a short-term bounce to the upside. This will keep GBPUSD range bound within 1.2900 and 1.2800 levels of resistance and support. A breakout from this range will likely determine further directional bias in the GBPUSD. Today's jobs report could be one of the main catalysts for price action to post some declines. Alternately, any retracement to the upside could be capped near the resistance level of 1.2900.
USDJPY intraday analysis
USDJPY (113.40): The USDJPY closed with a doji candlestick yesterday as price rallied to a fresh 2-month high. The price action in USDJPY is currently bearish, and we expect the declines to slip towards 113.36 initially. Bounce off this support level could result in a lower high being formed. Eventually, USDJPY could be seen breaking past 113.36 to retest the support level seen at 112.00. Further declines could see the currency pair testing the next main support level at 110.80.
EUR/USD Breakout Or Fake Out? GBP/USD Drops Like A Rock, EUR/CHF Reached Another Upside Target
EUR/USD – breakout or fake out?
The European currency increased sharply versus the USD in the yesterday's US session as there are some rumors that the Federal Reserve will delay another hike. Price maintains a bullish perspective on the short term, has touched new highs, but remains to see what will happen in the upcoming period because has reached a major static resistance. Only a valid breakout above this level will confirm a further increase.
The greenback was demolished by the USDX's drop, the index is trading much below the 96.00 psychological level, but stay above the 95.45 previous low. An accumulation will signal and oversold and that we may have a reversal on the short term.
Price climbed above the median line (ML) of the ascending pitchfork and most important above the 1.1466 major resistance level (May 2015), a valid breakout will attract more buyers, which will drive the rate towards fresh new highs. Right now is premature to say that we'll have a further increase because we may still have a Rising Wedge pattern if will slip below the median line (ML) again.
You can see that we had another false breakout above the median line (ML) on July 29, that's why we have to be patient and to wait for a fresh trading signal.
GBP/USD – drops like a rock
The Cable remains under selling pressure versus the greenback and is expected to reach new lows in the upcoming hours. We may have some volatility on this pair after the United Kingdom will publish the economic data, the Average Earnings Index may increase by 1.8% in May and could beat the 2.1% estimate. Moreover the Unemployment Rate is expected to remain steady at 4.6% in May, while the Claimant Count Change could increase to 10.5K , from 7.3K.
Price is attracted by the 1.2798 static support and ignores the USDX's drop, could find support at the mentioned obstacle and at the first warning line (wl1) of the ascending pitchfork. I want to remind you that a valid breakdown through the confluence area formed between these two support levels will accelerate the sell-off.
However, a bounce back will send the rate towards the upper median line (UML) of the major descending pitchfork.
EUR/CHF reached another upside target
The EUR/CHF extended the upside momentum and reached a strong confluence area, a breakout will confirm a further increase, while a fake-out will force it to start a minor retreat on the Daily chart.
Rallied in the yesterday's session and reached the confluence area formed between the upper median line (UML) of the ascending pitchfork with the median line (ml) of the minor ascending pitchfork. The outlook is bullish despite a minor decrease, could come to retest the lower median line (lml) before will resume the upside movement. While a valid breakout here will accelerate the bullish momentum.
Loonie Moving Into Final Stages Of Its Elliot Wave
Key Points:
- The third leg of the Elliot wave has extended further than expected.
- It looks like leg four is now underway.
- Long-term bias remains bearish.
The third leg of the Loonie's Elliot wave extended somewhat below where it was originally forecasted but the decline is now looking just about ready to reverse. As a result, we could have a week or two of gains before selling pressure resumes and sends the pair back to the lows seen early in 2016.
As shown below, a number of technical factors are aligning which signals that leg number three of the Elliot wave should have run its course. Firstly, both stochastics and RSI are oversold and the former is in dire need of being relieved. Indeed, it appears that this need to rally is strong enough to offset even yesterday's rather notable swing against the greenback following the softer JOLTS Jobs data.
Also worth noting, it would only require an advance of around 30 pips for the USDCAD to invert another key technical reading to bullish. Specifically, the Parabolic SAR is currently on the cusp of moving below price action – a strong indicator that near-term momentum has shifted from bearish to bullish. What's more, such an inversion would likely be accompanied by a near-term price bump that could actually see the MACD and signal line cross over, yet another indicator of a change in the near to medium-term bias for the pair.
Once we have confirmed the end of leg number three, we expect the fourth leg of the wave to drag price action back to around the 1.30 handle. Here, the 23.6% Fibonacci retracement should help to encourage another reversal and a subsequent downtrend. This fifth and final leg should terminate around the 1.2651 mark which could see the 12-month uptrend entirely undone.
Ultimately, that final push lower is subject to some fundamental risk which is worth keeping in mind. Nevertheless, these are more likely to muddy the overall pattern rather than disrupt it entirely which means our bias is still bearish in the medium to long-term. However, be on guard for any corrective structures that could be seen as the fifth leg ends given that any resulting buying pressure could see the pair move sharply higher rather quickly.
Daily Technical Outlook And Review: EUR/USD, GBP/USD, AUD/USD, USD/JPY, USD/CAD, USD/CHF, DOW 30, GOLD
A note on lower timeframe confirming price action...
Waiting for lower timeframe confirmation is our main tool to confirm strength within higher timeframe zones, and has really been the key to our trading success. It takes a little time to understand the subtle nuances, however, as each trade is never the same, but once you master the rhythm so to speak, you will be saved from countless unnecessary losing trades. The following is a list of what we look for:
- A break/retest of supply or demand dependent on which way you're trading.
- A trendline break/retest.
- Buying/selling tails ... essentially we look for a cluster of very obvious spikes off of lower timeframe support and resistance levels within the higher timeframe zone.
- Candlestick patterns. We tend to only stick with pin bars and engulfing bars as these have proven to be the most effective.
We typically search for lower-timeframe confirmation between the M15 and H1 timeframes, since most of our higher-timeframe areas begin with the H4. Stops are usually placed 1-3 pips beyond confirming structures.
EUR/USD
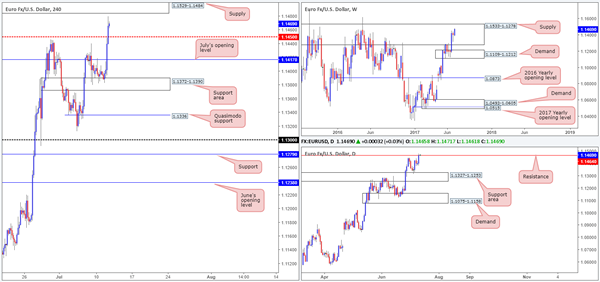
Influenced by bearish comments from FOMC member Brainard, the EUR/USD shifted to the upside during yesterday's US session. July's opening level at 1.1417 as well as the H4 mid-level resistance at 1.1450 were taken out, with the major ending the day closing just ahead of a H4 supply base coming in at 1.1529-1.1484 (formed back in May 2016).
What's interesting about the said H4 supply is that it is fresh, and is positioned around the upper edge of a major weekly supply drawn from 1.1533-1.1278 (that has capped upside since May 2015). Alongside this, we can also see daily price currently teasing a resistance level at 1.1464.
Our suggestions: With the above notes in mind, this recent Bull Run could be tested today! Our desk has decided to set a pending sell order at 1.1484, and place a stop-loss order above the WEEKLY supply edge at 1.1535. Although this is a 50-pip stop, one has to take into account that price could potentially move 100s of pips from this base given that it's positioned within a weekly supply zone. Should this setup come to fruition, we will ultimately be looking for the bears to run through 1.1450 and challenge July's opening level at 1.1417, before taking partial profits and reducing risk to breakeven.
Data points to consider: Fed Chair Yellen testifies at 3pm GMT+1.
Levels to watch/live orders:
- Buys: Flat (stop loss: N/A).
- Sells: 1.1484 (stop loss: 1.1535).
GBP/USD:
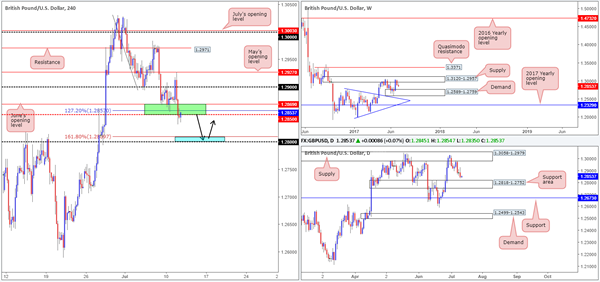
As anticipated, H4 price bounced nicely from the green area marked at 1.2850-1.2869, but failed to generate much follow through beyond the 1.29 handle.
Weekly price continues to trade bearishly from supply at 1.3120-1.2957, with the next downside target being seen around demand pegged at 1.2589-1.2759. Also of interest here is the daily timeframe – the candles are still showing some space to stretch down to 1.2818-1.2752: a support area glued to the top edge of the noted weekly demand.
So, where does the above analysis leave us on the H4 timeframe?
Well, considering that the top edge of the daily support area is sited at 1.2818, we are not keen sellers below 1.2850. Instead, our attention remains focused on the 1.28 handle (blue area) seen below, which happens to converge with the 161.8% ext. point at 1.2809 taken from the high 1.3030 and is also lodged within the said daily support area!
Our suggestions: To trade long from the 1.28 neighborhood, however, our desk would need to see evidence of buyer intent in the form of a H4 bullish candle, preferably a full-bodied candle. The reason for requiring this is because price could simply trade deeper into the aforementioned daily support area, thereby faking the 1.28 level and liquidating our stop. Waiting for intent to be shown helps avoid this! In the event that this trade comes to fruition, 1.2850 will be the first port of call regarding profit taking. Beyond this number, we'd be looking at 1.29/1.2927.
Data points to consider: UK employment figures at 9.30am. Fed Chair Yellen testifies at 3pm GMT+1.
Levels to watch/live orders:
- Buys: Currently watching the 1.28 neighborhood for a potential long opportunity. To trade from here we would highly recommend waiting for at least a H4 bullish candle to form, preferably a full-bodied candle, before pulling the trigger (stop loss: ideally beyond the candle's tail).
- Sells: Flat (stop loss: N/A).
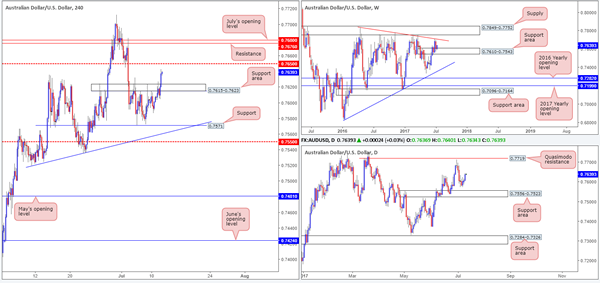
AUD/USD
Of late, we've seen Aussie bulls pick up the pace and push higher, consequently breaking through 0.7615-0.7623, which has now come to be a potential H4 support area. Technically speaking, we believe the move was influenced by the fact that the weekly candles recently connected with a support area carved from 0.7610-0.7543.
Selling from the nearby H4 mid-level resistance at 0.7650 is not really something that interests us this morning, due to the fact that this would involve shorting into potential weekly buyers. Therefore, we feel this level is best left alone!
A H4 close above 0.7650 on the other hand would, of course, further confirm bullish intent from the weekly support area, but it is not something we would feel comfortable getting involved in. The reason for this is because there is a H4 resistance level lurking up ahead at 0.7676, followed closely by July's opening level at 0.7680, which was already tagged earlier this month and thus has proved itself as a potential resistance.
Our suggestions: As far as we can see, technical elements are mixed at the moment leaving us with little choice but to remain on the sidelines today.
Data points to consider: Fed Chair Yellen testifies at 3pm GMT+1.
Levels to watch/live orders:
- Buys: Flat (stop loss: N/A).
- Sells: Flat (stop loss: N/A).
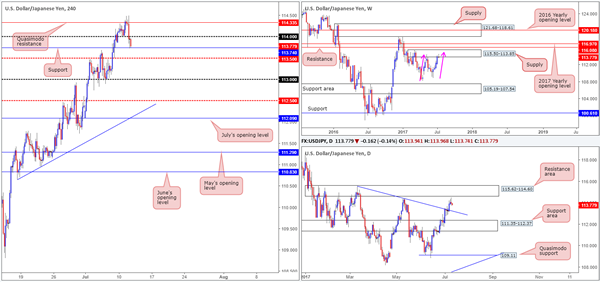
USD/JPY
Leaving the weekly AB=CD completion point at 115 (see pink arrows) unchallenged, the sellers have begun to make an appearance from within the weekly supply coming in at 115.50-113.85.
Traders may have also noticed that daily price came within a cat's whisker of clipping the underside of a resistance area marked at 115.62-114.60 yesterday. Providing that the bears remain in a dominant position here, it's possible that we may see price touch gloves with a trendline support etched from the high 115.50.
A closer look at price action on the H4 timeframe shows the Quasimodo resistance level at 114.33 held beautifully on Tuesday. The 114 handle was taken out and, as we write, price is seen testing support at 113.74.
Our suggestions: On account of the above, our desk remains firmly biased to the downside right now. However, it is proving difficult to pin down an entry point to sell! Beyond the current H4 support, we have the H4 mid-level support at 113.50, and just beneath this is the aforementioned daily trendline support – there's just no room to initiate any type of short right now!
So, with that, our desk is going to humbly stand down and see how things progress today, before making any further decisions in this market.
Data points to consider: Fed Chair Yellen testifies at 3pm GMT+1.
Levels to watch/live orders:
- Buys: Flat (stop loss: N/A).
- Sells: Flat (stop loss: N/A).
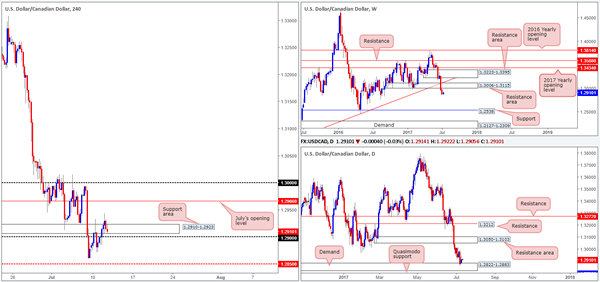
USD/CAD
Despite the recent break below the weekly support area at 1.3006-1.3115 (now a resistance area), daily buyers are doing a sound job of holding this market above demand at 1.2822-1.2883. In addition to this, we've also seen H4 bulls punch above the 1.2910-1.2923 resistance area, which, as you can see, is now being retested as a support right now.
Trading long from 1.2910-1.2923 is, of course, an option today given the daily chart's current structure, but it is not a high-probability move, in our humble opinion. Not only is the market entrenched within a rather steep downtrend at the moment, the weekly timeframe shows space to trade all the way down to support coming in at 1.2538.
Our suggestions: For us personally, we will pass on buying from 1.2910-1.2923 today. If you still believe that this area could hold, we would strongly advise waiting for H4 price to print a bull candle. This way, at least you know there's interest from the bulls, before committing. The first take-profit area from here would likely be July's opening level at 1.2966, followed by the large psychological band 1.30.
Data points to consider: Fed Chair Yellen testifies at 3pm. Canadian monetary policy report and overnight rate decision at 3pm, Crude oil inventories at 3.30pm along with a BoC press conference at 4.15pm GMT+1.
Levels to watch/live orders:
- Buys: Flat (Stop loss: N/A).
- Sells: Flat (Stop loss: N/A).
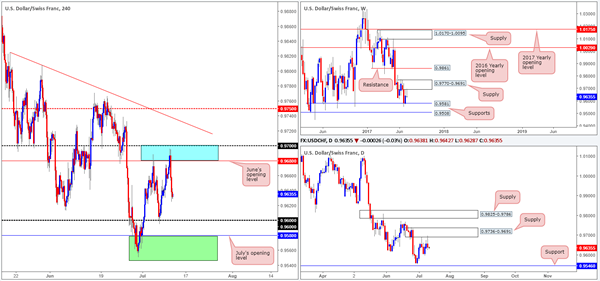
USD/CHF
During the early hours of yesterday's US segment, the pair aggressively faded from 0.97/0.9680 (round number/June's opening level – blue zone). Through the simple lens of a technical trader, this move should not really have come as much of a surprise. Weekly price recently came into contact with supply at 0.9770-0.9691, and daily price also connected with a smaller supply seen at 0.9736-0.9691, which is located around the lower edge of the said weekly supply.
As we write, we do not see much in the way of support stopping price from reaching the 0.96 handle today, and possibly July's opening level at 0.9580 (sits just within a green area comprised of daily support at 0.9546 and weekly support at 0.9581).
Our suggestions: Unless H4 price retests the aforementioned blue zone today; we would advise steering clear of shorts. Should the bears continue to drive lower on the other hand, we would, once again, be interested buyers at the green area mentioned above.
However, to initiate a trade at either of the above noted zones, we would require H4 candle confirmation, preferably in the shape of a full, or near-full-bodied candle. This is just a way to confirm that there are other speculators interested in the same zone as we are!
Data points to consider: Fed Chair Yellen testifies at 3pm GMT+1.
Levels to watch/live orders:
- Buys: 0.9564/0.9581 ([waiting for a H4 bull candle – preferably a full, or near full-bodied candle – to form is advised] stop loss: ideally beyond the candle's tail).
- Sells: 0.97/0.9680 ([waiting for a H4 bear candle – preferably a full, or near full-bodied candle – to form is advised] stop loss: ideally beyond the candle's wick).
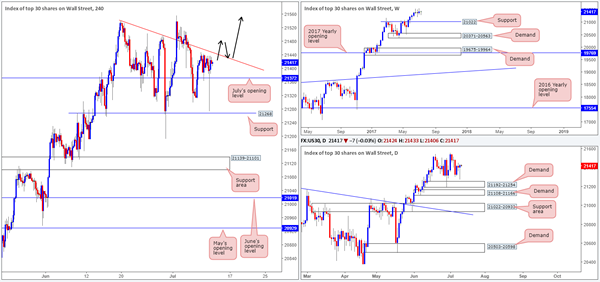
DOW 30
Apart from the somewhat aggressive H4 tail seen yesterday at 21273, the overall structure remains unchanged. What is interesting, however, is yesterday's action chalked up a strong-looking buying tail i.e. a bullish pin-bar candle.
As mentioned in yesterday's report, despite the H4 candles grinding lower at the moment, the US equity market remains trading with a strong upside bias. On the weekly timeframe, there's little stopping the unit from pushing higher. Should the index pullback, nonetheless, the support level at 21022 will likely offer a floor to trade from considering that it had a relatively sound history as a resistance.
Ultimately, we're looking for July's opening level at 21372 to continue providing support, and eventually force the candles above the nearby H4 trendline resistance extended from the high 21541. This, for us, would be a cue to begin looking to buy this market.
Our suggestions: Following a decisive close above the current H4 trendline resistance, the desk will be watching for the piece to retest this line as support and print a reasonably sized H4 bull candle, preferably a full, or near full-bodied candle, before looking to pull the trigger (as per the black arrows).
Data points to consider: Fed Chair Yellen testifies at 3pm GMT+1.
Levels to watch/live orders:
- Buys: Watch for H4 price to close above the current trendline resistance and then look to trade any retest seen thereafter ([waiting for a H4 bull candle – preferably a full, or near full-bodied candle – to form following the retest is advised] stop loss: ideally beyond the candle's tail).
- Sells: Flat (stop loss: N/A).
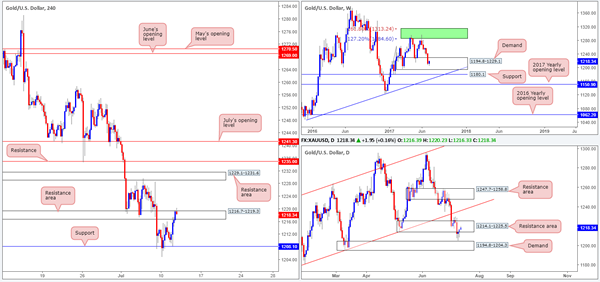
GOLD
Across the board, we saw the US dollar trade lower yesterday and this, as is usually the case, sent the price of gold higher. Technically speaking, we're not surprised to see the yellow metal gravitate higher since weekly price remains trading within the walls of a demand area coming in at 1194.8-1229.1. However, on the daily chart, weekly bulls do have some opposition, as the unit is seen touching base with a resistance area at 1214.1-1225.5.
As we highlighted in Tuesday's analysis, before our team becomes buyers in this market we would require a decisive H4 close above the H4 resistance area at 1216.7-1219.3. That way, we can be somewhat confident that the current daily resistance area is weakened and the H4 candles will likely reach the H4 resistance area at 1229.1-1231.6, followed closely by H4 resistance at 1235.0.
Our suggestions: Following a H4 close above 1216.7-1219.3, we'd also require price to retest this area as support and possibly print a H4 bull candle in the shape of a full, or near-full-bodied candle. This, to us, would be enough evidence to suggest that the bulls have the upper hand here.
Levels to watch/live orders:
- Buys: Watch for H4 price to close above 1216.7-1219.3 and then look to trade any retest of this area seen thereafter ([waiting for a H4 bull candle – preferably a full, or near full-bodied candle – to form following the retest is advised] stop loss: ideally beyond the candle's tail).
- Sells: Flat (stop loss: N/A).
EUR/USD Rose To A New Year-High At 1.147
Market Movers Today
Focus will be on Fed Chair Janet Yellen's semi-annual testimony to congress, which is due to be released at 14:30 CET. Market participants will scrutinise the speech for any hints about balance sheet reduction (‘quantitative tightening') as well as the timing of the expected third rate hike this year.
The Bank of Canada (BoC) is expected to hike its policy rate by 25bp to 75bp. The latest hawkish communication from BoC members has implied this is almost fully priced in but given the significant focus on the global tightening of monetary policy, the expected hike could fuel these speculations further. Notably, market pricing has gone from a 25% probability of a rate cut only two months ago to the hike being almost fully priced in now without considerable changes in economic data.
In the UK, the unemployment and earnings figures for May are due for release. Despite the pickup in inflation in the UK, wage growth remains subdued and the underlying price pressure does not signal that the BoE needs to tighten its monetary policy in the near term.
In the euro area, industrial production for May is due for release and based on the country figures, which have already been released, it should be solid. In Germany, industrial production in Q2 points to a pickup in economic activity versus Q1, when GDP growth was 0.6% q/q.
In Sweden, Prospsera is due to release an updated inflation survey at 08:00 CET. It is the monthly survey of money market players' expectations. It might give an indication of where the broader quarterly survey is heading but is paid less attention to by the Riksbank.
In commodity markets, the oil market will look at OPEC's monthly oil market report and the weekly EIA inventory data, while the grains market will read the monthly WASDE from the USDA for news about the supply situation on US wheat market.
Selected Market News
The USD dropped yesterday on the news that Donald Trump Jr. apparently knew about Russian interference in the US presidential election. EUR/USD rose to a new year-high at 1.147. The equity market was unscathed by the news.
Comments from the Fed's Lael Brainard are likely to have added to the bearish sentiment around the USD. She voiced caution over the prospect of further rate increases due to low inflation and that the neutral real rate was likely to be close to zero still. The dovish tone on the outlook for rate increases was countered by her stance on quantitative tightening, which she was comfortable with starting ‘soon'.
Oil prices found fundamental support yesterday. First, in EIA monthly short-term energy outlook, where the EIA revised down its forecast for US production by 110kb/d. In combination with the drop in the US oil rig count two weeks ago, it provides evidence that US oil producers are beginning to feel the pain from the recent drop in oil prices. Second, the American Petroleum Institute was said to report that US crude stocks fell 8mb last week.
Daily Technical Analysis: EUR/USD Bullish Bounce And Breakout Reaches First Target At 1.15
Currency pair EUR/USD
The EUR/USD bounced at the support trend line (green) and then broke above the previous top (red). Price has now reached the 1.15 target which could cause a potential retracement. A break above 1.15 could see price continue with the uptrend towards the 61.8% Fibonacci target at 1.1550.
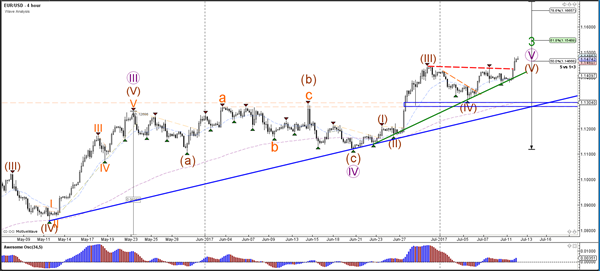
The EUR/USD completed the wave 4 (orange) and is now building an internal 5 wave (grey) within wave 5 (orange). A mild retracement at the 1.15 resistance could confirm a wave 4 (grey).
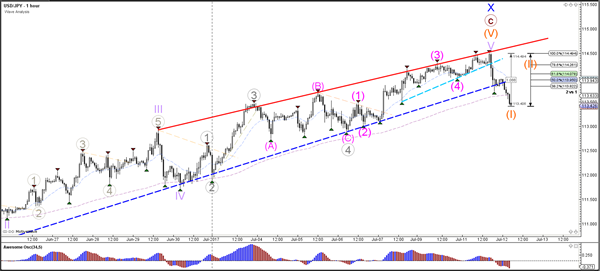
Currency pair USD/JPY
The USD/JPY broke the support trend lines (dotted lines) after approaching the 61.8% Fibonacci target and the 1.15 round resistance level. The bearish break could confirm the completion of the wave X (blue), although it does depend on how price behaves on lower time frames as well.
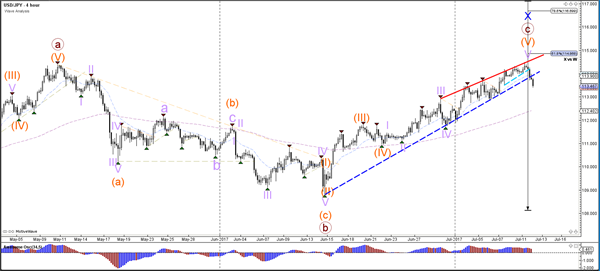
The USD/JPY break of the support trend lines (dotted blue) is showing a potential retracement or reversal. The latter scenario would indicate a potential wave 1 and 2 (orange) reversal.
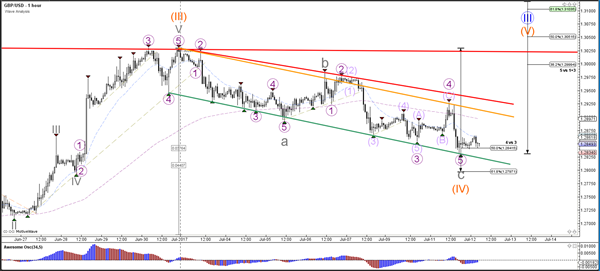
Currency pair GBP/USD
The GBP/USD retraced back to the 50% Fibonacci support level of wave 4 vs 3 (orange). A bullish bounce could confirm the wave 4-5 (orange).
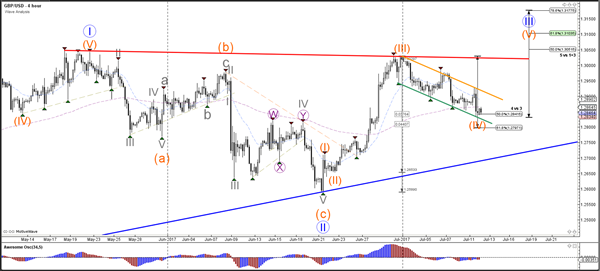
The GBP/USD seems to have completed an C (grey) bearish zigzag within wave 4 (orange). A break below the 61.8% makes a wave 4 structure less likely.
Australia’s Consumer Confidence Rose In July
For the 24 hours to 23:00 GMT, the AUD rose 0.42% against the USD and closed at 0.7638.
LME Copper prices rose 0.3% or $15.0/MT to $5795.0/MT. Aluminium prices declined 1.8% or $35.0/MT to $1879.0/MT.
In the Asian session, at GMT0300, the pair is trading at 0.7655, with the AUD trading 0.22% higher against the USD from yesterday's close.
Early morning data revealed that Australia's Westpac consumer confidence index advanced to a level of 96.6 in July, following a reading of 96.2 in the previous month.
The pair is expected to find support at 0.7619, and a fall through could take it to the next support level of 0.7582. The pair is expected to find its first resistance at 0.7678, and a rise through could take it to the next resistance level of 0.7700.
Moving ahead, Australia's consumer inflation expectation data for July, slated to release in the early hours' tomorrow, will be on investors' radar.
The currency pair is trading above its 20 Hr and 50 Hr moving averages.
