Sample Category Title
AUD/USD Daily Outlook
Daily Pivots: (S1) 0.7613; (P) 0.7627; (R1) 0.7652; More...
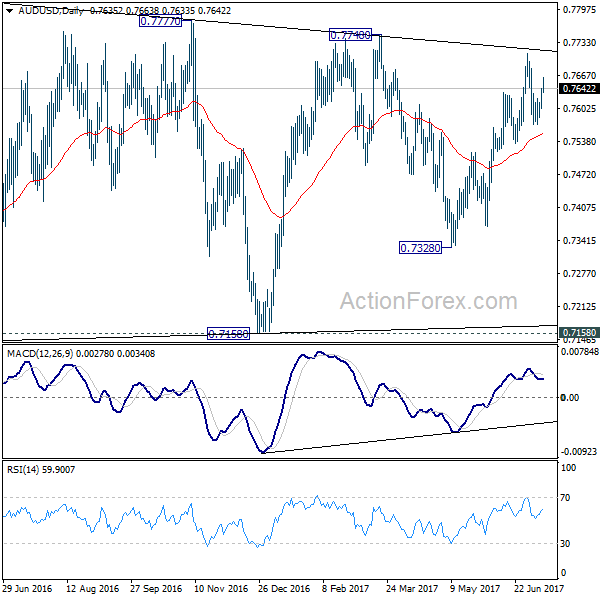
The break of 0.7643 minor resistance suggests that pull back from 0.7711 has completed at 0.7570 already. Intraday bias is turned back to the upside for 0.7711. Break will extend larger rally from 0.7328 and target 0.7748 resistance and above. At this point, there is no clear sign of range breakout yet. Hence, we'd be cautious on topping again as it approaches medium term fibonacci level at 0.7849. On the downside, break of 0.7534 will indicate near term reversal and turn bias back to the downside for 0.7370 support.
In the bigger picture, we're still treating price actions from 0.6826 low as a corrective pattern. And, as long as 38.2% retracement of 0.9504 to 0.6826 at 0.7849 holds, long term down trend from 1.1079 is expected to resume sooner or later. Break of 0.6826 low will target 0.6008 key support level. However, firm break of 0.7849 will indicate that rise from 0.6826 is developing into a medium term rebound, rather than a sideway pattern. In such case, stronger rise should be seen to 55 month EMA (now at 0.8082) and above.

Canadian Housing Starts Rise To 213K In June
'The trend in housing starts for Canada reached its highest level in almost five years. So far this year, all regions are on pace to surpass construction levels from 2016 except for British Columbia.' - Bob Dugan, CMHC
Canada's housing starts increased more than expected in June, with strong construction intentions being observed in the Toronto region and downward trends in Vancouver. The Canadian Mortgage and Housing Corporation's report showed on Tuesday that the seasonally adjusted yearly rate of housing starts in Canada rose to 213K in June, following the preceding month's figure of 195K. Meanwhile, analysts anticipated an increase close to 200K in the reported month. While Canada's housing market started to cool down, the more reliable six-month moving average rose to 215K, nearing the five-year high. The stronger-than-expected figures suggested that builders were proceeding with their projects despite a significant fall in home sales. Moreover, the solid growth in housing starts is expected to keep on contributing to the country's economic growth as well as to provide one more reason for the Bank of Canada to raise interest rates. Analysts expect the Bank's policy changes to lead to slightly weaker housing sector, with the most pronounced impact on Toronto and Vancouver, where prices were the highest.
US Job Openings Drop From Record-High, Hiring Rises
'The job openings plunge in May shows further evidence that the economy is hitting the wall of full employment. As the economy ages there's going to be fewer available jobs out there simply because companies have hired all the workers they need for now.' - Chris Rupkey, MUFG
Job openings in the United States fell sharply, while hiring was the highest since 2004 and more people left their jobs in May, suggesting that the country's labour market remained robust. The Labour Department published its Job Openings and Labour Turnover Survey, or JOLTS, on Tuesday, showing that the number of job openings fell 301K to a seasonally adjusted 5.67M in the reported month, following the downwardly revised figure of 5.97M in April. The decrease in May's job openings was mainly due to the fact that fewer positions were added in transportation, construction, utilities and warehousing services sectors. Meanwhile, the number of hires soared to 5.5M, supported by stronger figures in business, professional and educational services. The number of people voluntarily leaving their jobs rose to 3.2M, as there was enough confidence in the labour market. The report confirmed that the US economy was healthy and close to full employment with only 4.4% unemployment rate.
USD/CAD Daily Outlook
Daily Pivots: (S1) 1.2884; (P) 1.2914; (R1) 1.2943; More....
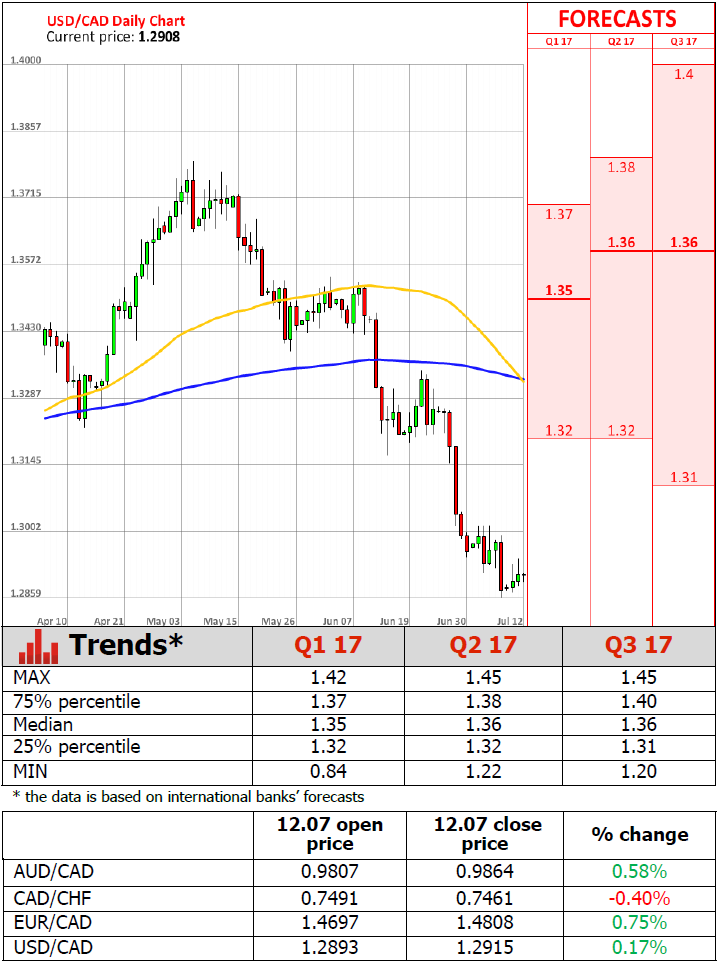
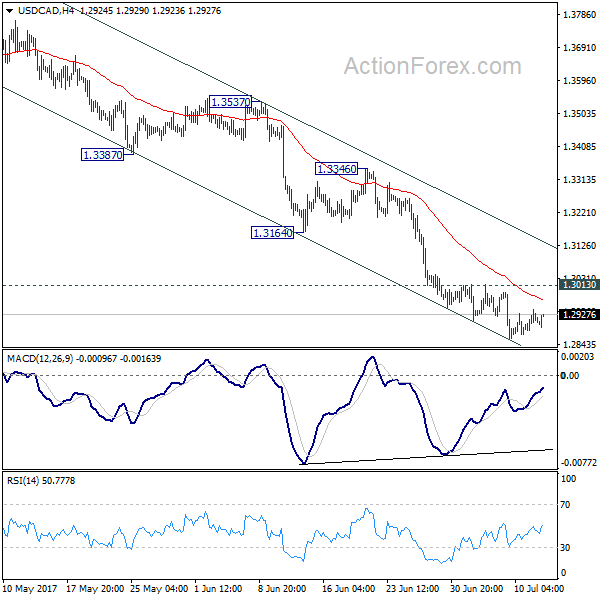
USD/CAD continues to lower downside momentum. But at this point, it's staying below 1.3013 resistance. Thus, deeper fall is expected for 1.2460 low. However, break of 1.3013 will indicate short term bottoming, on bullish convergence condition in 4 hour MACD. In such case, intraday bias will be turned back tot he upside for 1.3164/3346 resistance zone first.
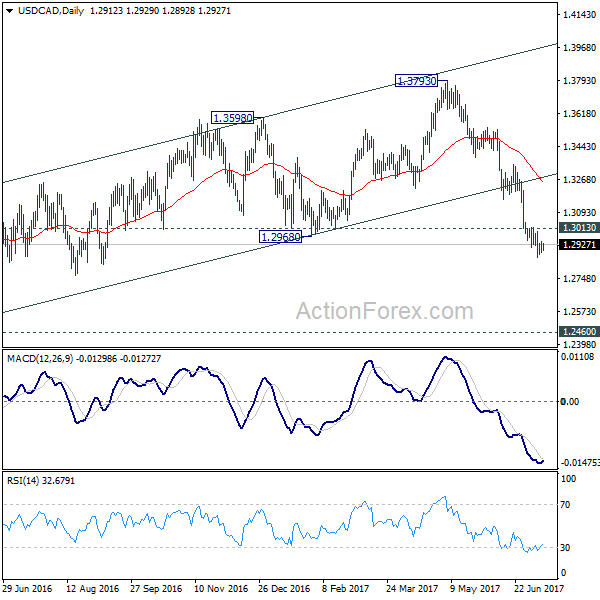
In the bigger picture, price actions from 1.4689 medium term top are seen as a correction pattern. The second leg should have finished at 1.3793. Break of 1.2460 will extend such correction to 50% retracement of 0.9406 to 1.4869 at 1.2048. At this point, we'd look for strong support from there to contain downside and bring rebound. However, firm break there will target 100% projection of 1.4689 to 1.2460 from 1.3793 at 1.1564.
Summer Lull Hits Markets, Yellen’s Testimony In Focus
Will Yellen be tellin'?
Investors appear to expect a dovish statement today from US Federal Reserve Chairwoman Janet Yellen , i.e. a ‘Goldilocks' not-too-fast, not-too-slow approach to monetary policy. So, we believe that the risk is mostly on the upside in USD: if Yellen surprises and comes out hawkish, investors will be scrambling to buy USD.
Yellen's scheduled remarks, to the US House of Representatives at 10.00 Washington time, offer a big opportunity to explain the Fed's plans on interest-rate hikes and on its upcoming balance sheet run-off. Details have so far been scarce. Many investors were disappointed by the limited information provided in the transcripts of June's meeting of the Fed's Open Market Committee.
Her remarks are also are the only significant event planned for today. Otherwise, the markets are in the doldrums of mid-summer. Volumes are low, equity indices and currencies are going nowhere. After edging slightly lower on Tuesday, European markets opened in positive in territory with the DAX and Footsie rising 0.39% and 0.67% respectively. The picture is not much brighter in the FX market with most currency pairs treading water for the past few days. The pound sterling rose 0.35% against the greenback yesterday before falling 0.85% to 1.2825 after a Band of England report showed Deputy Governor Broadbent is reluctant to support a rate hike for now.
Hardly a taper tantrum: bonds were overpriced, too
Last week's rally in bond yields was not just a reaction to central banks' effort to return to ‘normal' interest rates. It also was a reaction to expensive bond positions. Bonds have been overvalued for a significant period, with little duration-risk priced in. It seems that the shift in monetary policy woke up the market to this overvaluation.
Central banks are clearly bent on ‘normalization', and the US Federal Reserve is leading the way forward. We expect to see a gradual tightening of money by the Fed, led by balance sheet reductions and modest interest-rate hikes. Still, the Fed is not yet taking the aggressive stance it took in 2013, which pushed rates up 25 basis points across the curve. Indeed, we see the Fed taking no more than a 25 bp increase for the balance of 2017.
Although inflation still has not caught fire, Fed Chairwoman Janet Yellen says this is transitory, and she continues to push firmly for further rate hikes. We think she will ultimately have her way, and when her rate increases are followed by those of the European Central Bank – which in due course will surely happen – then we expect a significant market reaction.
Will Canada raise interest rates tomorrow?
On Thursday, the Bank of Canada will decide whether to raise rates. Will interest go up again, as it has over the past month?
On the one hand, the BoC has a decidedly hawkish view. Currency traders have been convinced enough to price in 67 basis points worth of rate hikes for the coming 12 months. On the other hand, the Canadian economy suffers from weak inflation (led by soft wage growth) and significant exposure to external risk – think oil, gas and mineral prices.
In our view, the BoC's Thursday choice will depend on its reading of the deep data. If they can, they will tighten money, but not automatically. We suspect the markets have overanticipated rate hikes, and that weak oil prices and current account deficit will take 25bp off of the table. In a nutshell: stay long USD/CAD.
Forex Technical Analysis: EUR/USD, USD/JPY, GBP/USD
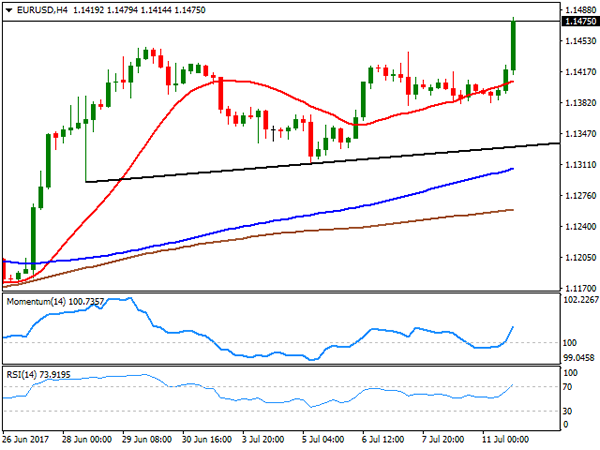
EUR/USD
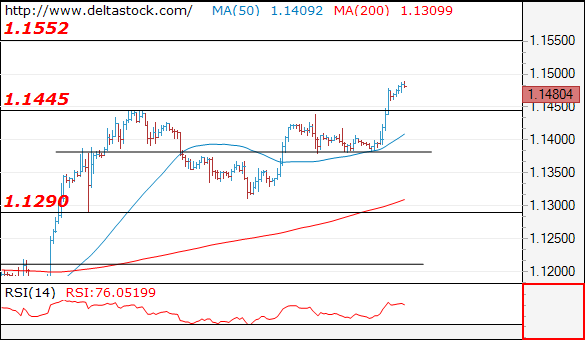
Current level - 1.1480
The break through 1.1445 high shows, that the consolidation pattern during the last two weeks is already over and the bias is positive, for a rise towards 1.1550, en route to 1.1610. Initial support lies at 1.1445 and crucial on the downside is 1.1380.
| Resistance | Support | ||
| intraday | intraweek | intraday | intraweek |
| 1.1550 | 1.1550 | 1.1445 | 1.1290 |
| 1.1610 | 1.1610 | 1.1380 | 1.1020 |
USD/JPY
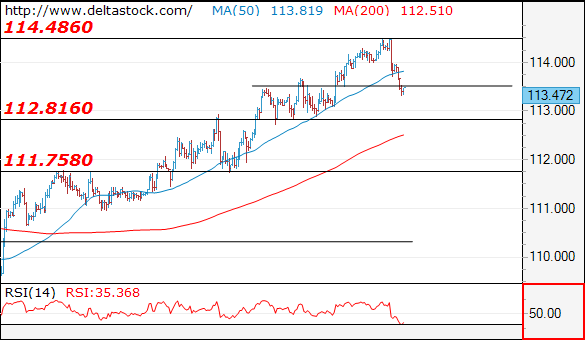
Current level - 113.47
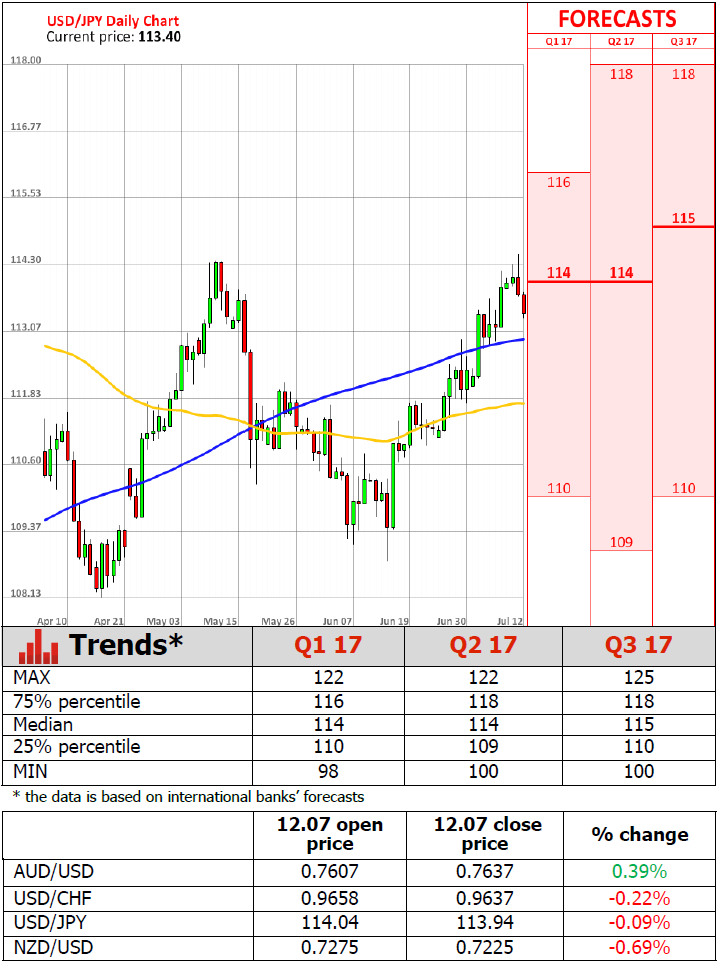
The peak at 114.50 has set an end of the whole rise from 108.10 and the outlook is already bearish, for a slide towards 112.80, en route to 111.75. On the senior frames current downtrend should target 108.10 and 106.80.
| Resistance | Support | ||
| intraday | intraweek | intraday | intraweek |
| 114.50 | 115.50 | 112.80 | 111.75 |
| 115.40 | 115.50 | 111.75 | 110.20 |
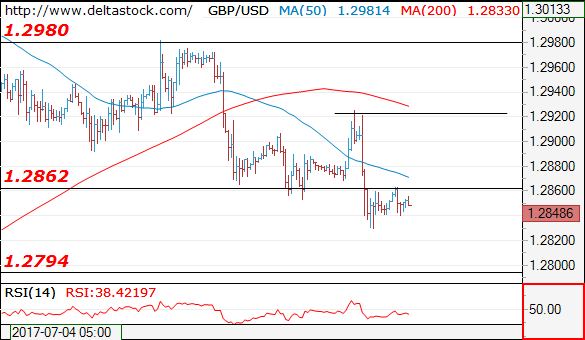
GBP/USD
Current level - 1.2848
The bias is still bearish, for a tight test of 1.2790 support zone. The latter is expected to provide a reliable base for an upswing towards 1.3050. Minor intraday resistance lies at 1.2860 and crucial on the upside is 1.2920 peak.
| Resistance | Support | ||
| intraday | intraweek | intraday | intraweek |
| 1.2860 | 1.3050 | 1.2830 | 1.2635 |
| 1.2920 | 1.3500 | 1.2790 | 1.2480 |
EURJPY Bullish Outlook, Pair Near 17-Month High, RSI Overbought
EURJPY continues gaining ground, finishing the day lower only once thus far this month. In addition, the pair recorded a seventeen-month high of 130.76 in yesterday’s trading.
Turning to technical indicators, the MACD is projecting a bullish picture. Specifically, the indicator is positive as well as above its red signal line. The RSI is in bullish territory but it is steeply heading lower from overbought levels. This points to negative market momentum in the very short-term.
Yesterday’s high of 130.76, combined with the 131 handle, could act as a barrier to the upside. Further up, the area around the upper Bollinger band at 131.94 might offer additional resistance.
On the downside, the area around the 130 mark, a potential psychological level, could provide support. Notice that the price is currently close to this point. Additional declines would shift focus to the middle Bollinger line – a 20-day moving average (MA) – at 127.09 for further support.
As regards the medium-term picture, it is bullish at the moment with both the 50- and 200-day MAs being positively sloped. Additionally, the pair has been trading above both MAs since late April.
AUDUSD Exits Overbought Area, Bullish Bias Intact
AUDUSD is currently trying to build an uptrend to reach the previous 3-month high of 0.7711. Even though the bullish bias is still intact, the risk could be skewed to the downside as the pair has crossed above the Bollinger band.
The short-term picture is bullish as the pair has been trending above the 50-4-hour and the 200-4-hour moving averages (MA) since July 11. Furthermore, technical indicators also assert a bullish bias, with the RSI fluctuating above 50 whereas the MACD is moving in positive area. However, a risk to the downside is possible as the pair has broken the upper Bollinger band, while the RSI has changed direction from rising to falling, after touching marginally the overbought area.
Should the price head down, a support level could be first found at the 50-4-hour MA of 0.7621 – an area that was previously tested repeatedly. A second support could be met at 0.7611, which is a point on the middle line of the Bollinger bands, whilst further price decreases would target the previous bottom of 0.7571 (lower Bollinger band).
If instead the pair hits to the upside, the latest peak of 0.7663 would act as an immediate resistance. Yet, if the pair manages to climb even higher, the 3-month high of 0.7711 would resist further upward movements
Dollar Slides Amid New Discoveries In Trump Controversy, Markets Eye Yellen’s Testimony
The dollar fell to a more than one-week low against a basket of major currencies in late US trading yesterday, after U.S. President Donald Trump's eldest son released an email chain citing Russian support for his father before last year's U.S. election. The greenback continued trading lower for most of the Asian session today. The main focus of the day will be Federal Reserve Chair Janet Yellen's testimony in Congress.
President Donald Trump's eldest son released emails last night that cast another cloud over his father's presidency and sent the dollar lower against most of its major peers. The emails could be seen as a concrete evidence that Trump campaign officials did have Russian help to win last year's elections. The dollar index, a broad measure of the greenback's strength was last trading at 95.733 vs yesterday's intra-day high of 96.205.
Asian currencies were gaining on the US dollar during the first trading session of the day. The yen gained against the greenback, with the dollar breaching the 114 handle. Dollar/yen was last trading at 113.46 ahead of European trading. The Australian dollar was also up against the US dollar, to last trade at $0.7645. Westpac's consumer confidence survey for July could have also supported the aussie. At 0.4%, the figure showed an improvement from the prior month (a decline of 1.8%). The kiwi showed similar pattern, rising to the $0.7237 level, after heavy losses yesterday.
Today, the markets are focused on probably the key event of the week in the US, Janet Yellen's testimony in Congress on monetary policy. The investor community is hoping for more clues on the Fed's latest thinking about monetary policy, especially regarding the potential of another rate hike this year and the timing of the start of the balance sheet reduction. Two Fed members, Fed Governor Lael Brainard and Minneapolis Federal Reserve Bank President Neel Kashkari spoke on Tuesday, however their dovish-perceived speeches added some uncertainty ahead of today's event.
Looking at Europe, in a relatively quiet day the euro gained in late US session last night on the political clutter from Washington. Euro/dollar rose to an intra-day high of 1.1480 to close at 1.1466. This morning, the euro managed to sustain the gains, though it came under pressure against the greenback just ahead of the European open. The rise in Germany's 10-year bund yield to 0.61% also provided support to the euro.
Looking ahead, the Bank of Canada policy meeting will be another topic of interest for most traders, as the bank is expected to announce an interest rate hike.
Oil prices continued to rise after popping higher on Tuesday amid reports that US inventories fell last week. The American Petroleum Institute reported a fall of 8.13 million barrels, well below the forecasted reduction of 2.9 million and adding to a draw of 5.76 million barrels the prior week. Brent crude was last trading at $48.20 a barrel, while WTI was at $45.80.
Gold also rose today, extending yesterday's late-night gains. The precious metal was last trading at $1,218.58 an ounce
Foreign Exchange Market Commentary: EUR/USD, USD/JPY, GBP/USD, GOLD, WTI CRUDE, DJIA, FTSE100, DAX
EUR/USD
The EUR/USD pair surged to a fresh 2017 high of 1.1479, level last seen on May 2016, with the dollar suffering a major setback after US President's son, D. Trump Jr., made publish an e-mail exchange with Rob Goldstone, a British publicist, who offered to set up meetings with the Russian government to boost Trump's campaign by using documents that would incriminate Hillary Clinton and her dealings with Russia. The scandal sent Wall Street plummeting alongside with the greenback, offsetting news coming from central bankers and pretty much everything else. Dull trading ahead of Yellen's testimony before the Congress and US inflation was interrupted with the news, and anyway, doesn't seem any of both would do something to back a greenback's recovery, as Fed's chair Yellen won't surprise with a hawkish stance, yet on the contrary, anything less than an ultra-hawkish tone will hit the dollar further. Additionally, US inflation has been soft lately, and one good reading won't be enough to convince investors it was just due to temporal factors as the Fed says.
The bullish breakout of its recent range favors a continued advance, although the pair is currently standing at a critical resistance area, as the current price zone has rejected price advances pretty much since January 2015, with a couple of short lived exceptions. Nevertheless, technical readings in the 4 hours chart, are clearly bullish, as technical indicators head north at fresh July highs, whilst the price accelerated above its 20 SMA. October 2015 high at 1.1494 is the immediate resistance, with gains most likely accelerating above this last and scope then to advance up to 1.1713, the high set on August 2015.
Support levels: 1.1380 1.1340 1.1290
Resistance levels: 1.1460 1.1490 1.1525
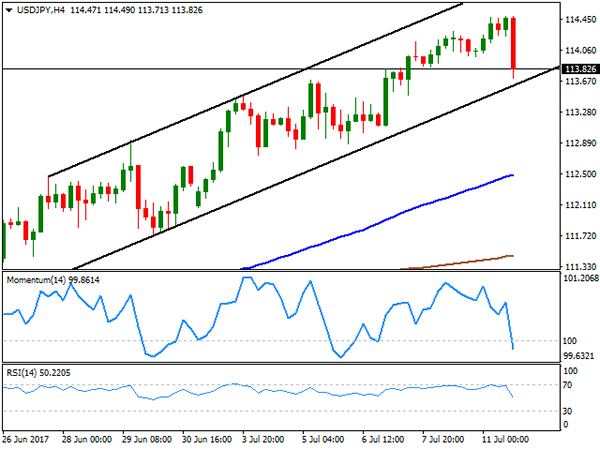
USD/JPY
The USD/JPY pair retreated from a multi-month high of 114.49, ending the day in the red in the 113.80 region, as political jitters in the US sent the dollar lower against most of its major rivals. As US President Trump struggles to pass the Obamacare repeal bill, news showing that his son was involved with Russian representatives to interfere with the election through "dirt on Clinton," sent USD and its related assets sharply down. During the upcoming Asian session, Japan will release its June Domestic Corporate Goods Price index indicator, which is inflation at factory levels, expected unchanged from previous readings. Still, a divergence in the outcome will weigh on the pair, particularly if the news disappoint, as it will widen the imbalance between both central banks. Technically, the pair stands within a daily ascendant channel, but nearing the base of the figure after the latest slump, at 113.60 for the upcoming session, while in the 4 hours chart, technical indicators have turned sharply lower, now entering negative territory and supporting some additional declines, moreover on a break below the mentioned support.
Support levels: 114.00 113.60 113.10
Resistance levels: 114.40 114.75 115.10
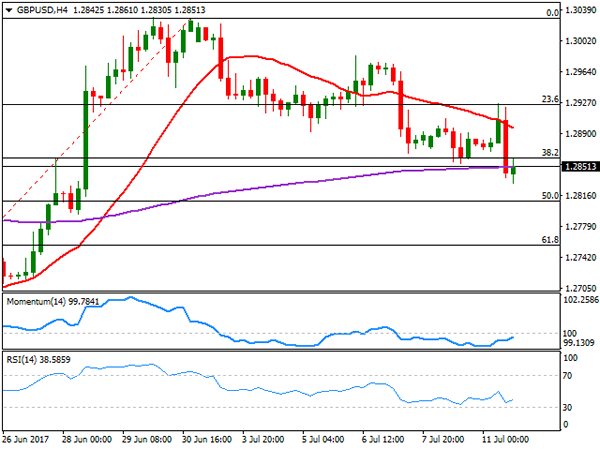
GBP/USD
The GBP/USD pair fell to a fresh 2-week low of 1.2830, with the Pound led lower by MPC members´ comments, with broad dollar's weakness barely enough to halt the slide. Ben Broadbent spoke on globalization and made no comments on monetary policy, but warned about the risk that Brexit will be to UK trade. Haldane, on the other hand, reaffirmed his pledged to raise rates amid resilient inflation and shrinking growth, but given that his stance was already known by the market, his positive comments did little to help the Pound. The UK will release its latest employment figures this Wednesday, with wages seen advancing modestly as well as jobs creation. Should the report disappoint, the Sterling will likely extend its fall this Wednesday. Technically, the pair has broken below the 38.2% retracement of its latest bullish run, now finding resistance around it at 1.2860, while in the 4 hours chart, the 20 SMA maintains a strong bearish slope above the current level, whilst the Momentum indicator continues to lack direction around its 100 level, but the RSI hovers near oversold levels, this last supporting additional declines ahead. The 50% retracement of the same rally stands at 1.2810, now the immediate support.
Support levels: 1.2810 1.2770 1.2730
Resistance levels: 1.2860 1.2895 1.2925
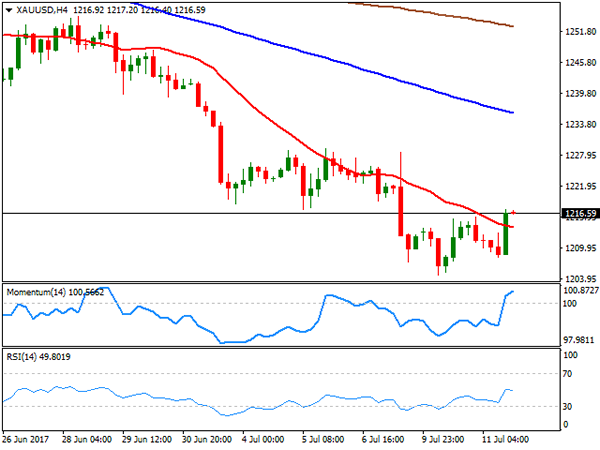
GOLD
Gold prices bounced on Tuesday on broad dollar's weakness, with spot ending modestly higher, at $1,216.61 a troy ounce. The commodity recovered from a daily low of 1,208.13 after D. Trump Jr. made public sensitive campaign information, showing that Trump was offered help against Clinton. The advance, however, was moderated, amid the cautious tone of gold buyers ahead of Yellen's testimony this Wednesday, and US inflation on Thursday. A dovish tone from Fed's head could send the commodity higher, but the scenario seems quite unlikely. In the meantime, the daily chart shows that the risk remains towards the downside, as the price remains well below all of its moving averages, with the 20 DMA still heading strongly south well above the current level, whilst technical indicators remain flat near oversold levels. In the 4 hours chart, the price has settled above a bearish 20 SMA, while technical indicators lost upward strength after entering positive territory, limiting chances of a stronger recovery, at least at the time being.
Support levels: 1,212,80 1,204.75 1,194.95
Resistance levels: 1,222.10 1,228.00 1,236.50
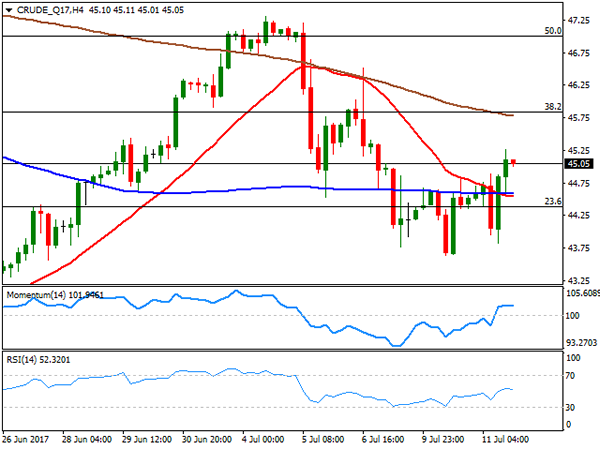
WTI CRUDE OIL
Crude oil prices edged higher this Tuesday, with West Texas Intermediate futures ending at $45.08 a barrel, helped by news reporting that the OPEC's compliance with its output cut pledge reached 97% in June. Further supporting the commodity was an US EIA report that trimmed its forecast on US production for 2018, also cutting its price outlook to $48.95 from $50.78 previously. Ahead of stockpiles data, the daily chart for the commodity shows that the price stands above a horizontal 20 SMA, while the Momentum indicator aims higher above its 100 level whilst the RSI indicator also turned north, but around 47, rather suggesting this recovery is corrective than confirming additional gains ahead. In the shorter term and according to the 4 hours chart, WTI presents a modest positive tone as the price is above its 20 and 100 SMAs, both lacking directional strength around 44.60, while technical indicators entered positive territory, but lost upward strength. A critical resistance stands at 45.90, where the pair has the 38.2% retracement of its latest decline, and the 200 SMA in the 4 hours chart.
Support levels: 44.60 43.70 43.20
Resistance levels: 45.90 46.60 47.25
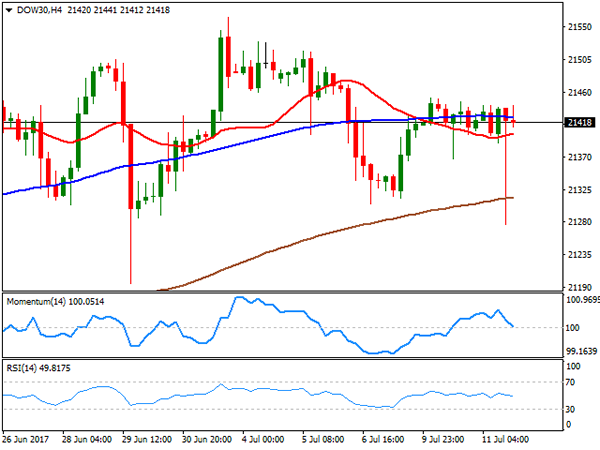
DJIA
US indexes closed the day barely changed, with the Dow Jones Industrial Average flat at 21,409.07 after trading over 150 lower intraday, following the latest Trump-Russia scandal's headlines. The Nasdaq Composite advanced roughly 17 points to close at 6,193.31, while the S&P shed 0.08%, to 2,425.53. As tech recovered, General Electric was the best performer within the Dow, up 1.32%, followed by Boeing that which gained 1.22%. Nike led decliners with a 0.92% loss, followed by Merck that shed 0.76%. In the daily chart, the index maintains its neutral stance, with the index stuck around its 20 DMA and technical indicators heading nowhere right above their mid-lines, but still with the downside seen limited, as the 100 and 200 SMAs continue heading higher far below the current level. In the 4 hours chart, the index still hovers around its 20 and 100 SMAs, both horizontal and within a tight range, while technical indicators turned south, but hold within positive territory, favoring a leg lower for this Wednesday but without confirming it yet.
Support levels: 21,366 21,305 21,278
Resistance levels: 21,459 21,515 21,563
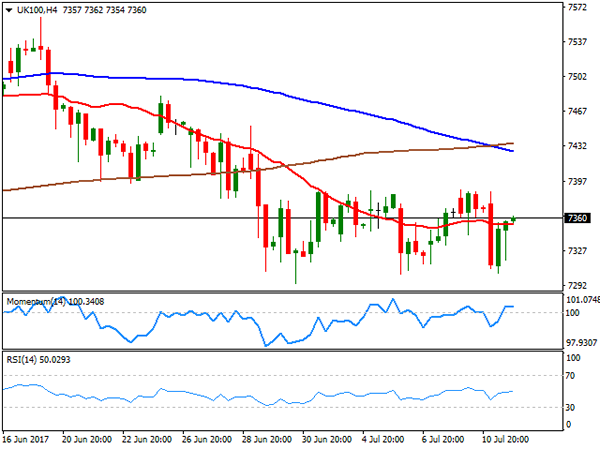
FTSE100
The FTSE 100 fell 40 points or 0.55% to close the day at 7,329.76, hurt by news that Pearson closed a $1 billion deal to sell the 22% stake in Penguin Random House to a German company, with investors seeing the deal as undervaluing Pearson's stake in PRH. The company was the worst performer, ending the day 5.14% lower . The second worst performer was Marks & Spencer, down 4.69% after reporting its fiscal first-quarter 2018 like-for-like sales in the U.K. fell 0.5%. A bounce in commodities' prices backed the mining sector, with Glencore being the best performer, up 2.14%, followed by Anglo American and Fresnillo which added over 1% each. From a technical point of view, the daily chart for the index shows that it held below its 100 DMA, meeting selling interest around it, whilst technical indicators stalled their recoveries well below their mid-lines, all of which maintains the risk towards the downside. In the shorter term, and according to the 4 hours chart, the index settled around its 20 SMA, but below the larger ones, whilst technical indicators also lost directional momentum after advancing up to neutral territory.
Support levels: 7,327 7,294 7,256
Resistance levels: 7,386 7,424 7,452
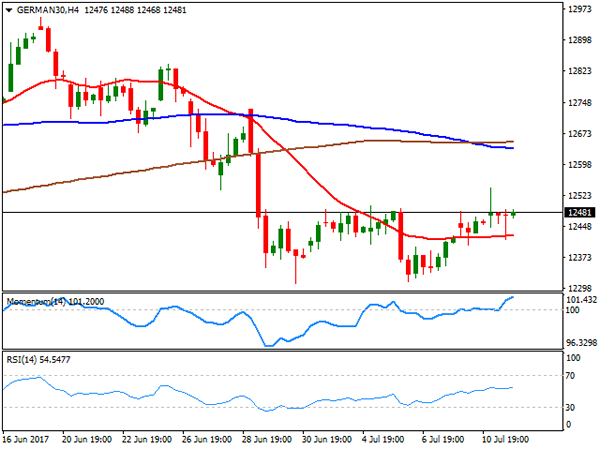
DAX
European major benchmarks closed the day lower, with the German DAX down 0.07%, at 12.437.02, weighed by real estate and building materials' stocks. The indexes hovered within gains and losses for most of the day, with volatility limited ahead of Yellen's testimony this Wednesday. Within the DAX, ThyssenKrupp led advancers, adding 1.96%, followed by Bayerische Motoren that gained 1.77%. Henkel AG was the worst performer, down 1.04%, followed by SAP that shed 0.82% and E.ON that closed down 0.79%. The daily chart for the index shows little change from previous updates, as the index remains trapped between a bullish 20 DMA capping the upside, and a bullish 100 DMA acting as dynamic support today at 12,370, whilst technical indicators head modestly higher within negative territory. Shorter term, and according to the 4 hours chart, a modest positive tone persists, as the benchmark met buying interest on a slide down to a horizontal 20 SMA, while the RSI indicator holds flat around 54 and the Momentum aims higher above its 100 level.
Support levels: 12,432 12,370 12,333
Resistance levels: 12,490 12,541 12,596