
Sample Category Title
EUR/USD Bullish!! GBP/USD Bearish Breakout, USD/JPY Profit-Taking.
EUR/USD Bullish!!
EUR/USD bearish pressures are definitely weak and the pair has broken resistance at 1.1445 (29/06/2017 high). Hourly support can be found at 1.1292 (28/06/2017 low). Stronger support lies at 1.1076 (18/05/2017 low).
In the longer term, the momentum is clearly negative. We favour a continued bearish bias towards parity. Key resistance holds at 1.1714 (24/08/2015 high) while strong support lies at 1.0341 (03/01/2017 low).
GBP/USD Bearish breakout.
GBP/USD's weakness continues. The pair keeps on heading lower towards hourly support given at 1.2794. Stron resistance can be found at 1.3046 (18/05/2017 high). The road is wide-open for further weakness.
The long-term technical pattern is even more negative since the Brexit vote has paved the way for further decline. Long-term support given at 1.0520 (01/03/85) represents a decent target. Long-term resistance is given at 1.5018 (24/06/2015) and would indicate a long-term reversal in the negative trend. Yet, it is very unlikely at the moment.
USD/JPY Profit-taking.
USD/JPY has exited symmetrical triangle. yet, ongoing move seems that profits are currently taken. Hourly support can be found at 112.83 (05/07/2017 low). Stronger support is located at 108.13 (17/04/2017 low). Expected to show renewed bullish pressures.
We favor a long-term bearish bias. Support is now given at 96.57 (10/08/2013 low). A gradual rise towards the major resistance at 135.15 (01/02/2002 high) seems absolutely unlikely. Expected to decline further support at 93.79 (13/06/2013 low).
China’s Watch: Subdued Inflation Facilitates PBOC’s Monetary Policy
The set of June data released so far has pointed to a steady growth trend in China, the world's second largest economy. Released earlier in the week, headline CPI stayed unchanged at +1.5% y/y in June, shy of consensus of +1.6%. Persistently soft food price (on deflation) continued to put downward pressure on the headline reading. For instance, pork plummeted -16.7 and egg price fell -9.3%.PPI, upstream price levels, steadied at +5.5% in June, in line with expectations. Subdued inflation offers the government room to maintain its targeted tightening measures, focusing on cracking down overheating asset prices. Yet, soft PPI suggested that growth in industrial profits would be limited.
FX Reserve:
China's FX reserve increased for the 5th consecutive, by +US$ 3.22B, to US$ 3.056 trillion in June. This marks the highest level since October 2016. Yet, after adjusting for currency valuation effect, there comes a net drop of US$ 8 to US$ 13B. We are not at all surprised by the rise in FX reserve, as suggested in the headline reading. The massive selloff of renminbi in 2015 has passed, following the government aggressive capital control measures, imposing barriers on the transfer of foreign currency abroad by companies and individuals. It also tried containing renminbi's decline by dumping of foreign currencies (and buying renminbi). FX reserve fell by around one-quarter between the peak in June 2014 and January 2017. Meanwhile, China raised the rates for its open market and lending facilities by 10-35 bps to retain capitals. Undoubtedly, the recent change in the renminbi fixing mechanism, by adding ''counter-cyclical factor'', is another initiative to intervene the currency market. In the first half of this year, renminbi has risen about +2.4% against US dollar, contrary to the -6.5% depreciation in 2016.
In the near- to medium- tern, we expect renminbi to continue recovery against US dollar. Barring the abovementioned measures, diminished expectations over US' growth momentum, and over Fed funds rate hike schedule next year, have limited the greenback's strength. Indeed, the recent hawkish shift by several major central banks (including ECB and BOC) has weighed on the US dollar. This phenomenon should be supportive of renminbi.
PMIs
On the last day of June, the National Bureau of Statistics reported that China's manufacturing PMI rose +0.5 point to 51 in June. This marked the second straight month of increase. The size of the increase signaled acceleration of the manufacturing sector. Looking into the details, the ''production'' index gained +1 point to 54.4 while the ''new orders'' index added +0.8 point to 53.1. However, the ''employed person index'' slipped -0.4 point to 49 and the ''supplier delivery'' time index dropped -0.3 point to 49.9 for the month.
The non-manufacturing PMI gained +0.4 points to 54.9 in June. Of which, the services index gained +0.3 point to 53.8 while the construction index rose +1 point to 61.4. Looking into the details, the ''new orders'' index added +0.5 point to 51.4, the ''input price'' index was climbed +0.1 point higher to 51.2, while the ''sales price index gained +0.5 point to 49.3 for the month. Meanwhile, the ''employment'' index gained +0.6 point to 49.6 and the ''business activities expectation'' index jumped +0.9 point to 61.1. The government judged the report confirms the ''expansion trend of a steady rise'' in the non-manufacturing sector.
The set of data compiled by Caixin, focusing on SMEs, showed a more mixed trend. The manufacturing PMI rose +0.8 points to 50.4 in June with indices such as ''output'', ''new orders'', ''input prices'' and ''output prices'' on the rise. By contrast, the services PMI dropped -1.2 points to 51.6, sending the composite output index -0.4 point lower to 51, the slowest rate of expansion in a year, for the month.
Yellen, UK Wages and Crude Inventory Under Focus
- Yellen To Testify And Three Things Matter
- UK Wage Number Could Quell Hopes For Interest Rate Hike
- Crude Oil Eye Inventory Data
Yellen To Testify And Three Things Matter
All devotion would be on Janet Yellen's testimony and investors are going to focus on three major areas and that would drive the trend for the dollar. The most vital factor is the subject of the balance sheet. Investors would like to know what the Fed Chairwomen has hidden under her sleeves. The market is expecting that the Fed would declare something in September in relation to reducing the size of the balance sheet. Secondly, the focus lies on the number of interest rate hikes that are on the table for this year and if the path of the interest rate hike would also be steeper next year. Finally, the future for the Fed committee after Yellen leaves the office and what route her successor would adopt in relation to the labour market are a major point as well.
These issues are going to make the bed for today's testimony and Yellen would need to be subtle in her approach. We trust the ultimate desire is to dodge any roller coaster ride for the market. One question which would be worth raising today is if the Fed has any backup plan if the market starts to derail given that the Fed would be tightening up the screws on both sides of their monetary policy. By looking at the dollar index, it becomes evidently clear that investors are expecting more interest rate hikes for this year but they do question the matter of reducing the size of the balance sheet.
UK Wage Number Could Quell Hopes For Interest Rate Hike
Back in the UK, the pound has not recovered from its heavy blow from the Bank of England's chief economist Andrew Haldane and deputy governor Ben Broadbent. Both were extremely pessimistic about the Sterling and traders took no time in taking the advantage of that situation by pushing the currency lower. The question for today is if we are going to recover any of the losses or if the trend is going to pick up more steam.
It all depends on one important economic reading which is due this morning. It is the UK wage data that everyone has their eyes on. The question which you may want to ask yourselves is what the future would be for the U.K.'s economy if wages do not start to pick up? It has already taken a very bad toll on consumer confidence and on the recovery which was led by consumers. Last month's reading confirmed that wages are not keeping up with inflation, and the Brexit situation is making things even direr. Under this situation, the consumer confidence would continue to roll over and economic health would fade further.
Having said that, we are expecting the wage number rise to 1.9%, and we know that it would be still well below the inflation number. But the hope is that over the next few months this gap would be fully filled. If the number deteriorates even further, it would quell the chances for any interest rate hikes in the near future.
Crude Oil Eye Inventory Data
Crude oil gathered attraction amid traders in hopes that the Crude inventory data which is due today would show drawdowns. The API number released last night brought some good news for traders by showing some aggressive decline in stockpiles. However, it is important to keep in mind that oil is still in the bear territory due to concerns over a supply glut. The EIA has also reduced its estimate for 2018 for the US production to be below 10 million barrels a day. This is an encouraging sign as this was the first time that we have seen the agency cutting its production forecast for the US production. Nonetheless, traders are not going to turn a deaf ear to Saudi Arabia's oil production which informed OPEC that the production has gone above its limit which was established during the agreement.
EUR/USD Daily Outlook
Daily Pivots: (S1) 1.1406; (P) 1.1442 (R1) 1.1503; More.....
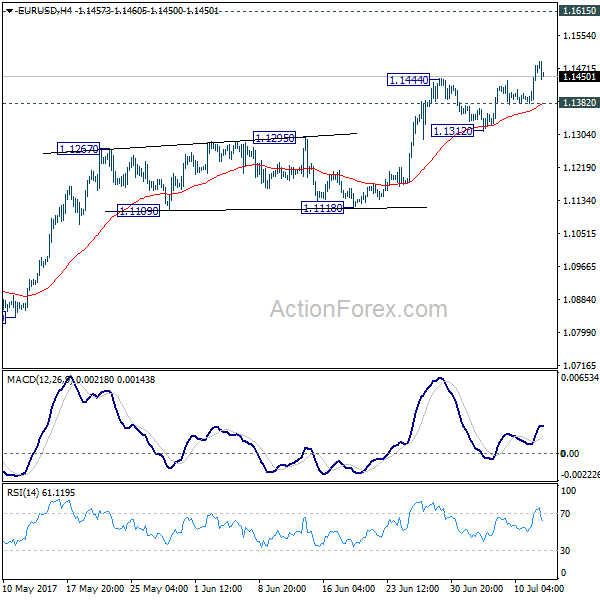
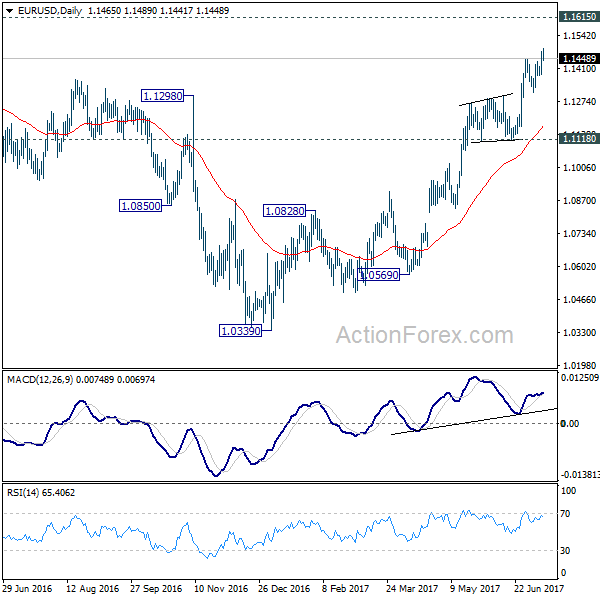
EUR/USD rises to as high as 1.1489 so far as recent rally resumed. Intraday bias is back on the upside. Current rally from 1.0339 low should extend to 1.1615 resistance next. On the downside, however, break of 1.1382 minor support will suggest short term topping, possibly on bearish divergence condition in 4 hour MACD. In such case, lengthier consolidation would be seen before another rally.
In the bigger picture, the firm break of 1.1298 resistance further affirm medium term reversal. That is an important bottom was formed at 1.0339 on bullish convergence condition in weekly MACD. Further rise would be seen to 55 month EMA (now at 1.1763). Sustained break there will pave the way to 38.2% retracement of 1.6039 (2008 high) to 1.0339 (2017 low) at 1.2516 next. This will now remain the favored case as long as 1.1118 support holds.
GBP/USD Daily Outlook
Daily Pivots: (S1) 1.2808; (P) 1.2868; (R1) 1.2905; More...
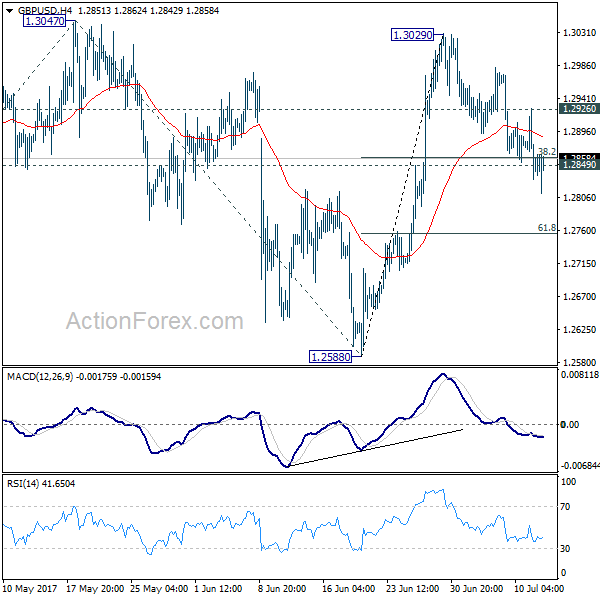
Despite breaching 1.2849 support, there is no follow through selling in GBP/USD yet. Intraday bias remains neutral for the momentum. Break of 1.2926 minor resistance will indicate completion of pull back from 1.3029. Intraday bias would then be turned back to the upside for 1.3047 resistance. Break will target 61.8% projection of 1.2108 to 1.3047 from 1.2588 at 1.3168 next. However, sustained break of 1.2849 will dampen our near term bullish view and turn focus back to 1.2588 support.
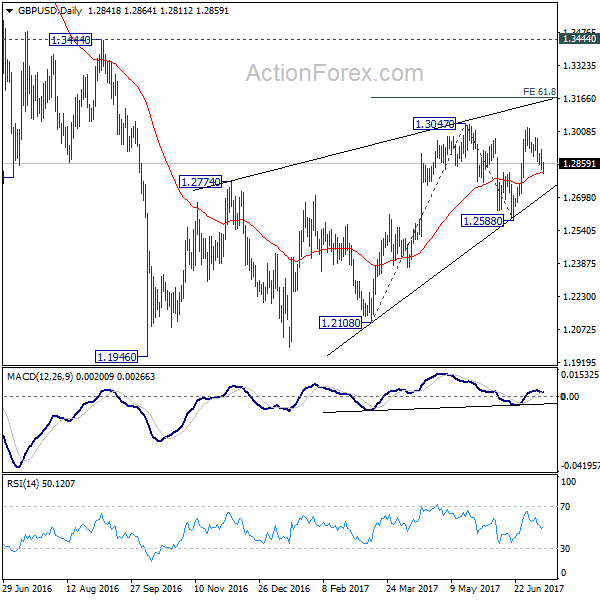
In the bigger picture, overall, price actions from 1.1946 medium term low are seen as a corrective pattern that is still in progress. While further upside is now in favor, overall outlook remains bearish as long as 1.3444 key resistance holds. Larger down trend from 1.7190 is expected to resume later after the correction completes. And break of 1.2588 will indicate that such down trend is resuming.
USD/CHF Daily Outlook
Daily Pivots: (S1) 0.9609; (P) 0.9652; (R1) 0.9681; More......
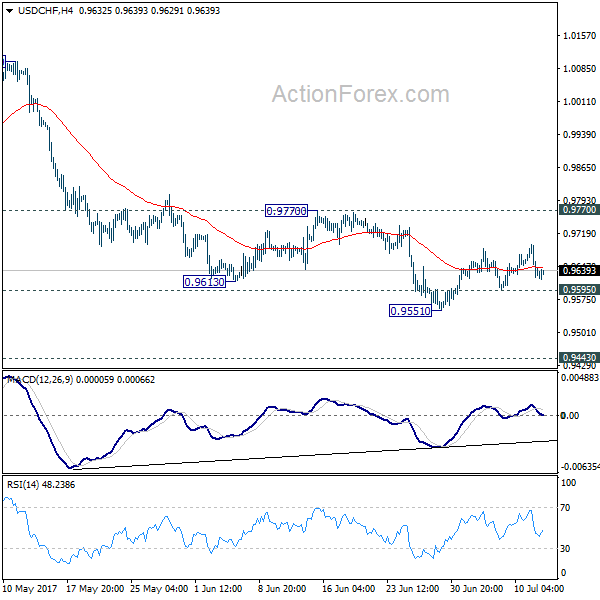
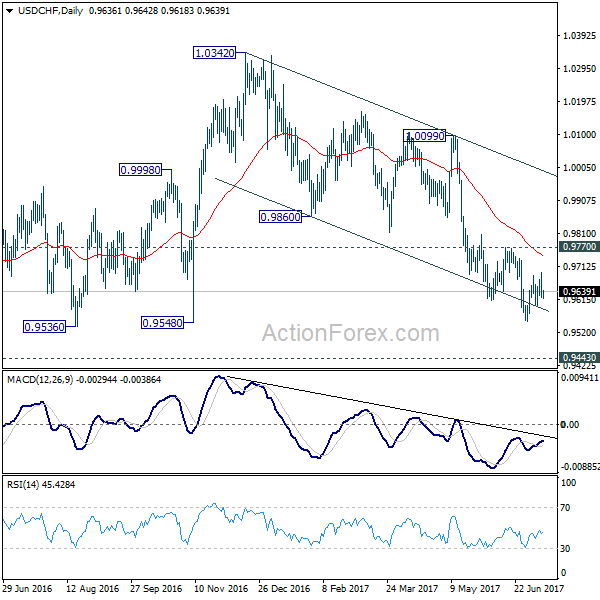
USD/CHF is staying in consolidation above 0.9551 and intraday bias stays neutral first. Upside is expected to be limited by 0.9770 resistance and bring fall resumption. Below 0.9595 minor support will turn intraday bias back to the downside. In such case, USD/CHF should fall through 0.9551 support resume the whole fall from 1.0342 and target 0.9443 key support level next. We'd expect strong support from there to bring rebound. Meanwhile, firm break of 0.9770 will indicate near term reversal, on bullish convergence condition in 4 hour MACD.
In the bigger picture, USD/CHF is still bounded in medium term range of 0.9443/1.0342 for the moment. Consolidative trading would likely continue and medium term outlook remains neutral. Break of 1.0342 key resistance is needed to confirm underlying bullish momentum in the pair. Meanwhile, downside attempts should be contained by 0.9443 key support level. However, sustained break of 0.9443 will carry larger bearish implication and target 0.9 handle.
Bank Of Canada: To Hike Or Not To Hike?
Today, the main event will be the BoC policy meeting, and the forecast is for the Bank to raise its benchmark interest rate by 25bps. Indeed, at the time of writing, the probability for such action – according to Canada's Overnight Index Swaps (OIS) – rests at 87%, suggesting that a hike is almost fully priced in.
Having said that, we stick to our non-consensus view that the BoC could remain on hold today, although we admit it's a very close call. We do expect a hike soon, but we think that this meeting is too early. Even though the Canadian economy is strong by almost all metrics, inflationary pressures are still absent.
The nation's core inflation rate has declined for 3 consecutive months and now rests at +0.9% yoy, a low last seen in 2011. In our view, it would be very strange for the BoC to hike while underlying inflation is trending lower, even if the Bank expects it to pick up soon. The only reason we see for the BoC to want to raise rates immediately is to curb rapidly rising housing prices, but even then, we are not convinced that the interest rate instrument is the appropriate one to use amid low inflation.
If we are right, the Loonie is likely to sink on the news. USD/CAD is likely to surge back above 1.3000 (R2), something that could change the outlook back to neutral (from negative) as this will bring the rate back within the sideways range that contained the price action since the 9th of September.
Even if we are wrong though and policymakers do raise rates, that does not necessarily imply a stronger CAD, as a hike is practically fully priced in. If the hike is not accompanied by strong signals that further rate increases are on the table soon, this may turn out to be a sell-the-fact event, as investors take the opportunity to lock in profits on their prior long-CAD positions. USD/CAD could rebound on that, but we expect such a move to remain limited below the psychological zone of 1.3000 (R2). In this case, the outlook would remain negative and the 1.3000 (R2) territory may be a good point for the bears to take charge again.
For CAD to rally after this decision, the BoC would need to hike and simultaneously signal further hikes in the months to come. USD/CAD may come under renewed selling interest on the news and perhaps break below the 1.2860 (S1) barrier. Something like that may initially aim for the next support of 1.2820 (S2), where another dip is possible to target the 1.2770 (S3) territory.
Concluding, we view the risks surrounding the Loonie from this decision as likely being asymmetrical, and tilted to the downside.
USD takes a dive after Trump Jr and Brainard; Focus turns to Yellen
The US dollar tumbled yesterday, following the release of some emails from President Trump's eldest son. The emails suggested that the Trump campaign was aware that the Russian government wanted to get Trump elected. The dollar took another hit a few minutes later after the Fed's Brainard said she wants to monitor inflation carefully and to move cautiously on further rate hikes.
Today, investors are likely to turn their eyes to Fed Chair Yellen's semi-annual testimony on monetary policy before the House Financial Services Committee. Usually the Fed's semi-annual monetary policy report is released on the day Yellen testifies, but this time around it's already out. Thus, focus may be primarily on the Q&A session. If she reiterates that one more hike this year is likely, USD could recover some of its latest losses. On the other hand, any deviation from that could lead to renewed USD selling. Overall though, we think that the nation's CPIs on Friday may play a bigger role in shaping market expectations regarding the Fed's next move.
EUR/USD edged north on Tuesday, after it hit support near the crossroad of the 1.1380 (S2) level and the short-term upside support line taken from the low of the 22nd of June. The pair emerged above the resistance (now turned into support) of 1.1450 (S1) to hit the 1.1485 (R1) hurdle. The price structure still suggests a short-term uptrend and thus, even if Yellen boosts the dollar and the pair slides, we would treat that as a corrective phase.
As for the economic data today:
As for the indicators, we get UK employment data for May. The forecast is for the unemployment rate to have held steady and for average weekly earnings to have slowed, something that could curb some speculation regarding a BoE hike soon and thereby, weigh on the pound.
USD/CAD
Support: 1.2860 (S1), 1.2820 (S2), 1.2770 (S3)
Resistance: 1.2940 (R1), 1.3000 (R2), 1.3080 (R3)
EUR/USD
Support: 1.1450 (S1), 1.1380 (S2), 1.1300 (S3)
Resistance: 1.1485 (R1), 1.1530 (R2), 1.1615 (R3)
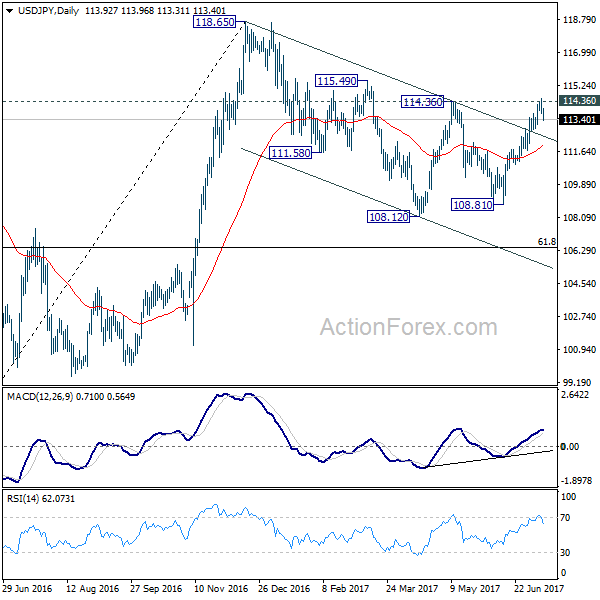
USD/JPY Daily Outlook
Daily Pivots: (S1) 113.60; (P) 114.05; (R1) 114.38; More...
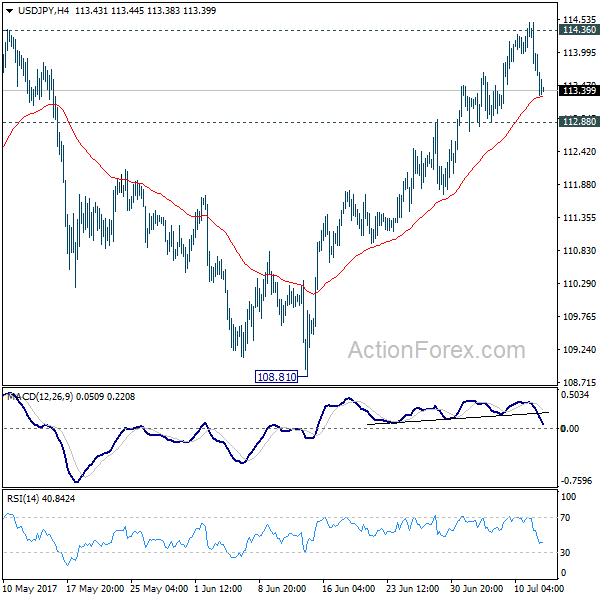
Intraday bias in USD/JPY is turned neutral with the current sharp decline. With 112.88 minor support intact, further rise remains in favor. Decisive break of 114.36 resistance will confirm our bullish view that corrective pull back from 118.65 has completed at 108.12. In that case, further rally would be seen to retest 118.65. However, break of 112.88 will indicate rejection from 114.36 and near term reversal. In such case, intraday bias will be turned back to the downside for 4 hour 55 EMA (now at 111.94).
In the bigger picture, the corrective structure of the fall from 118.65 suggests that rise from 98.97 is not completed yet. Break of 118.65 will target a test on 125.85 high. At this point, it's uncertain whether rise from 98.97 is resuming the long term up trend from 75.56, or it's a leg in the consolidation from 125.85. Hence, we'll be cautious on topping as it approaches 125.85.
Yellen And BoC Could Play Havoc With USDCAD
- BoC seen raising rates but are markets expecting too much?
- BoE Deputy Governor casts doubt on UK rate hike;
- USDCAD could be extremely lively as Yellen testifies on monetary policy.
Wednesday promises to be quite an entertaining day for markets, with central banks once again the focus as the Bank of Canada announces its latest monetary policy decision and Federal Reserve Chair Janet Yellen begins her two day testimony, firstly before the House Financial Services Committee.
The BoC has come to the fore in recent weeks, adopting a far more hawkish stance on interest rates, so much so that markets are now almost fully pricing in a rate hike this year. This comes despite inflation in the country currently sitting well below the central bank’s target and the economy doing quite well – despite a far more upbeat assessment this week from the country’s finance minister Bill Morneau – albeit with a number of potentially destabilising headwinds.
Still, key officials at the central bank have spoken in recent weeks and markets have listened, positioning themselves for a hike and possibly more in the pipeline. Investors have actually taken it on board so much that the downside risks now come from the central bank waiting to hike, an outcome that could hit the Canadian dollar quite hard and cast doubt on just how serious policy makers really are.
The sudden desire to raise interest rates at the BoC comes at the same time as their counterparts at the Bank of England have also struck a more hawkish tone. Despite the significant economic uncertainty linked to Brexit and the weakness we’re already seeing as a result of last year’s vote, there appears to be a growing consensus at the bank to raise interest rates in order to offset the rising inflationary pressures that are largely being driven by the depreciation of the currency. Still, not everyone is convinced and Deputy Governor Ben Broadbent this morning appears to have joined Governor Mark Carney in stating that it’s not the time to raise interest rates. Broadbent was being seen as the proxy for whether the consensus has shifted and his comments today – which hit the pound in early trade – suggest there may still be some way to go, although future votes are likely to be very close.
One central bank who’s monetary policy stance has barely shifted this year, if at all, is the Fed. Markets may not yet be convinced that we’ll get a third rate hike this year but they’re not dismissing it as they have in the past, either. Yellen’s testimony on the semi-annual monetary policy report will be watched very closely today for signs that the central bank is pulling back at all from its calls for another hike, amid signs that some policy makers are becoming less convinced due to low inflation.
Yellen will likely be quizzed on a number of issues related to the Fed’s plans - among other things if past testimonies are anything to go by – including its plans for interest rates beyond the end of the year and its balance sheet, which it is expected to begin unwinding as early as September. Yellen likes to keep her cards very close to her chest though so may give little new information away today, not that this often stops markets getting carried away. With her testimony coming at the same time as the BoC’s rate decision and press conference, USDCAD will likely be extremely lively today.
Euro Hits 14-Month High On US Political Risk
The euro has steadied on Wednesday, after recording considerable gains in the Tuesday session. Currently, EUR/USD is trading at 1.1460. Earlier in the day, the pair climbed to 1.1489, its highest level since May 1. On the release front, German WPI improved to 0.0%, but fell short of the estimate of 0.2%. Later in the day, the eurozone releases Industrial Production. In the US, Federal Reserve Chair Janet Yellen will testify before the House Financial Services Committee. On Thursday, the US releases PPI and unemployment claims. As well, Janet Yellen will testify before the Senate Banking Committee.
Inflation levels remain a sore point in the eurozone, and Germany, the bloc’s largest economy, has not been immune to low inflation. The Wholesale Price Index declined 0.7% in May, its worst reading in 9 months. There was some improvement in the June report, with a flat reading of 0.0%. Still, German and eurozone inflations levels remain well below the ECB’s target of 2%, and as long as this situation continues, the ECB is unlikely to taper its aggressive stimulus package. We’ll get a look at German Final CPI on Thursday. The index has looked weak in the second quarter, and the estimate for June is 0.2%.
With Germany showing healthy growth and enjoying fiscal stability, the question of the fiscal stance of the eurozone as a whole was a key topic as eurozone finance ministers met in Brussels this week. Germany has opposed attempts to define the bloc’s fiscal stance as expansionary, and at the Monday meeting, the finance ministers agreed to aim for a”broadly neutral” stance. The European Commission wants to see France and Italy work on trimming their substantial deficits. As for Germany, which is in much better fiscal shape, the Eurogroup of finance ministers has called on the country to divert more resources to investment and public spending.
After a short hiatus, Washington is again abuzz over allegations of secret ties between Russia and the Trump administration during the US election. This week’s breaking news is the revelation that Donald Trump Jr. admitted that a Russian official contacted him and offered to provide him with evidence incriminating Hillary Clinton. Trump and the White House are trying to lower the flames and put a positive spin on the meeting, but the media and lawmakers (including Republicans) aren’t about to Trump off the hook. The crisis is just the latest miscue for the Trump administration, which hasn’t been able to pass any significant laws through Congress, even though Republicans control both the House of Representatives and the Senate. The latest dark cloud over the White House has dampened investor confidence, and the euro took advantage on Tuesday, climbing close to the 1.15 line.