
Sample Category Title
DAX Ticks Upwards as German Services PMI Beats Estimate
The DAX index has inched higher in the Wednesday session, as the index is up 0.16%. Currently, the DAX is at 12,455.75. On the release front, German and Eurozone Services PMIs in June both beat their estimates, although they were weaker than the May reports. Eurozone Retail Sales climbed to 0.4%, matching the forecast. In the US, the Federal Reserve will release the minutes of the June policy meeting. On Thursday, the ECB will release the minutes of its most recent meeting.
There was positive news from the services sectors, as German and Eurozone Final Services PMIs continue to indicate expansion. German Final Services came in at 54.0, above the forecast of 53.7. Eurozone Final Services PMI came in at 55.4, easily beating the forecast of 54.7. However, both indicators weakened in June, which could be a source of concern for the markets. The German manufacturing sector is in good shape, boosted by a stronger demand for German exports. On Monday, German Manufacturing PMI came in at 59.6, pointing to expansion. We'll get a look at additional manufacturing data later in the week, with the release of Factory Orders on Thursday and Industrial Production on Friday.
The recent ECB forum of central bankers triggered a stampede to snap up euros, as the currency jumped 2.0%, following hawkish remarks from ECB President Mario Draghi. At the meeting, Draghi sounded upbeat about the euro-area economy and played down concerns about low inflation levels. Draghi did not appear to veer away from current ECB policy, but he may have learned the hard way that the markets picked up a different message than the one he delivered in his speech. The euro rally has forced ECB policymakers to reassess whether what moves, if any, it will announce at the July 20 policy meeting. In June, the ECB removed an easing bias regarding interest rates, effectively closing the door to further rate cuts. However, policymakers may now be wary about removing a second easing bias regarding the asset-purchase program, to avoid another run on the euro. The ECB has repeated loud and clear that it will not remove QE until inflation levels are closer to the bank's target of 2.0%, but the markets chose to interpret Draghi's comments as a signal that the bank was planning an exit from its easing stance. This could result in the ECB playing it safe and avoiding any meaningful discussion about QE at the July meeting, especially if the euro remains at high levels. European stock markets have made the most of the ECB's ultra-loose policy, as investors have taken advantage of "easy money" and pushed stock markets to higher levels. If the markets remain convinced that the ECB is planning to exit its stimulus program, stock markets could lose ground.
Federal Reserve policymakers have consistently said that they expect a third rate hike in 2017, but the markets are not convinced. The odds of a December rate hike are pegged at 50%, while the likelihood of an increase in September is just 18%. Consumer spending, which comprises two-thirds of US economic growth, remains soft. Another sore point in the economy is inflation, which remains below the Fed's target of 2%. In June, Fed Chair Janet Yellen shrugged off inflation worries, saying that she expected inflation to remain soft due to temporary factors. The dollar was broadly higher after the June rate statement, as Fed policymakers were surprisingly upbeat about the economy and dismissed concerns about low inflation levels. The minutes could follow suit with a positive view of the economy, but the question remains as to whether the markets will buy in to the Fed's optimism. If the answer is yes, then the dollar could respond with gains.
Euro Edges Lower Despite Solid Eurozone, German Service PMIs
The euro has dropped for a third straight session, as the pair has edged lower in the Wednesday session. Currently, the pair is trading at 1.1330. On the release front, German and Eurozone Services PMIs in June both beat their estimates, but were weaker than the May reports. In the US, the Federal Reserve will release the minutes of the June policy meeting. On Thursday, the ECB will release the minutes of its most recent meeting. It will be busy in the US, with the release of ADP Nonfarm Payrolls, unemployment claims, and the ISM Non-Manufacturing PMI.
Last week's ECB forum triggered a stampede to snap up euros, as the currency jumped 2.0%, following hawkish remarks from ECB President Mario Draghi. At the meeting, Draghi sounded upbeat about the euro-area economy and played down concerns about low inflation levels. Draghi did not say that the ECB was changing its accommodative policy, but he may have learned the hard way that the markets picked up a different message than the one he delivered in his speech. The euro rally has forced ECB policymakers to reassess whether what moves, if any, it will announce at the July 20 policy meeting. In June, the ECB removed an easing bias regarding interest rates, effectively closing the door to further rate cuts. However, policymakers may now be wary about removing a second easing bias regarding the asset-purchase program, to avoid another run on the euro. The ECB has repeated loud and clear that it will not remove QE until inflation levels are closer to the bank's target of 2.0%, but the markets chose to interpret Draghi's comments as a signal the the bank was planning an exit from its easing stance. This could result in the ECB playing it safe and avoiding any meaningful discussion about QE at the July meeting, especially if the euro remains at high levels.
Federal Reserve policymakers have consistently said that they expect a third rate hike in 2017, but the markets are not convinced. The odds of a December rate hike are pegged at 50%, while the likelihood of an increase in September is just 18%. Consumer spending, which comprises two-thirds of US economic growth, remains soft. Another sore point in the economy is inflation, which remains below the Fed's target of 2%. In June, Fed Chair Janet Yellen shrugged off inflation worries, saying that she expected inflation to remain soft due to temporary factors. The dollar was broadly higher after the June rate statement, as Fed policymakers were surprisingly upbeat about the economy and dismissed concerns about low inflation levels. The minutes could follow suit with a positive view of the economy, but the question remains as to whether the markets will buy in to the Fed's optimism. If the answer is yes, then the dollar could respond with gains.
Focus Shifts To Fed Minutes
Capital markets, thus far, have ridden out the latest rise in tensions around North Korea this week. Expect this temporary timeout to continue as investors' attention now shifts to today's FOMC minutes (02:00pm EST) from their June meeting. It should provide the latest clues for investors on the path for U.S interest rates ahead of Friday's key non-farm payroll (NFP) report.
Despite a shift towards more 'hawkish' language by several major central banks (ECB, BoJ, BoE, BoC and Riksbank) dominating proceedings over the past six-business days, expect today's Fed minutes to provide some clarity on U.S rate normalization.
What to look for:
In June, the Fed laid out its plans for how it will shrink its portfolio, but stopped short of telling the market when that process would start. Investors are looking for a clue on timing.
The Fed minutes should also be searched for signs of concern among policymakers about a downturn in inflation. The minutes could provide more detail on the internal debate. Look for signs of a split among officials over how to react to disappointing inflation numbers.
Also, a new concern is being focused on 'financial conditions' – resurfaced in recent weeks in Fed officials' public remarks – the Fed's June statement and Yellen's press conference did not suggest any concern about loose conditions, however, it is possible officials addressed the matter at greater length behind closed doors.
Note: Friday's non-farm payroll (NFP) report is expected to add around +175k workers last month and wage growth probably strengthened.
1. Stocks trying to rebound from political tension
In Japan, the Nikkei share average (+0.3%) has bounced back from an intraday three-week low as demand in cyclical stocks offset fears from tensions following North Korea's ballistic missile launch (ICBM). The broader Topix index advanced +0.6%, erasing its own session intraday loss.
Down-under, Australia's S&P/ASX 200 Index fell -0.4% after soaring +1.8% Tuesday, the most since Nov. 10, when the RBA left overnight benchmark rates unchanged.
In Hong Kong, the Hang Seng climbed +0.3%, while the Hang Seng China Enterprises Index rose +0.6%.
In China, the Shanghai Composite Index rallied +0.8%, helped by a wider quota for Hong Kong institutional investors and a cabinet paper promoting the use of commercial pension money in capital markets.
In Europe, stocks have opened broadly flat. Risk sentiment seems to be improving despite ongoing concerns over North Korea. However, liquidity remains thin ahead of the U.S open.
Note: U.S markets were closed for 4th of July holiday, to re-open this morning.
Indices: Stoxx50 -0.2% at 3,479, FTSE +0.1% at 7,362, DAX +0.1% at 12,448, CAC-40 +0.2% at 5,185, IBEX-35 flat at 10,567, FTSE MIB -0.4% at 20,949, SMI -0.3% at 8,940, S&P futures flat.
2. OPEC supplies rise again, gold little changed
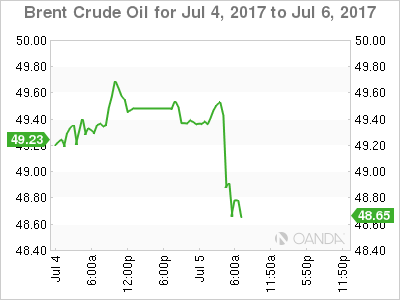
Brent crude oil prices remain below the psychological +$50 per barrel, weighed down by another rise in OPEC supplies despite a pledge to cut production – however, geopolitical tensions from North Korea and the Middle East is providing support on these pull backs for now.
Brent crude futures are at +$49.60 per barrel, little changed from yesterday's close. U.S West Texas Intermediate (WTI) crude futures are down -6c at +$47.02 per barrel.
Note: Both markets have recovered around +12% from last months lows on June 21.
However, oversupply remains the key issue for the market. Data from Thomson Reuters yesterday showed that oil exports by OPEC members climbed for a second month in June – in breach of its pledge to hold back production between January this year and March 2018 to prop up prices.
OPEC exported +25.92m bpd in June, +450k bpd above May's final count and +1.9m bpd more than its 2016 figures.
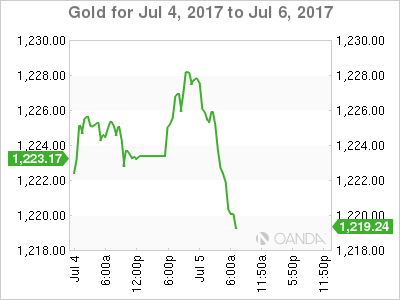
For now, rising geopolitical risks is providing some support for gold. The precious metal has edged up a tad overnight as tensions on the Korean peninsula stoked safe-haven demand for the metal (+0.2% to +$1,225.59 an ounce, paring an earlier gain of +0.5%). However, dollar strength is expected to provide weight for some metal prices.
3. Bond yields under pressure following central bank rhetoric
In the U.K, benchmark yields advanced +2 bps to +1.27% after BoE's Saunders said, 'households should prepare for rates to go higher at some point' and 'if rates do go up it will be in context of economy doing O.K and unemployment being low and probably falling.'
Down-under, Australian 10-year yields backed up +1 bps to +2.63%, after dropping -5 bps yesterday when the RBA held rates steady.
Elsewhere, French (OAT's) and German (Bund) yields were flat, while the yield on U.S 10-year Treasuries fell -2 bps to +2.33%. The rate rose +5 bps Monday, after surging +16 bps last week. Markets were closed in the U.S yesterday.
Yesterday, Sweden's Riksbank dropped its 3 bps easing bias in the rate path – it's the first time since negative rates began in February 2015 that the Riksbank doesn't have an easing bias in the rate path. The move reflects higher inflation in Sweden and the changed tone from other central banks.
4. Dollar trades little changed ahead of minutes
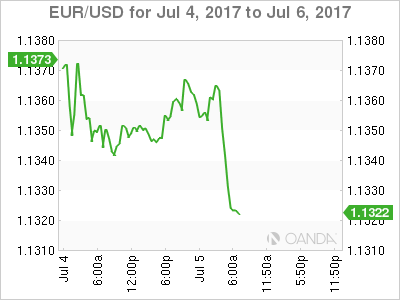
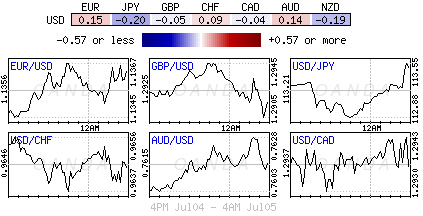
The EUR (€1.1317) is seeing some weakness after comments from an ECB official stating that ECB has not discussed 'halting easy monetary policy.' Longer-term EUR 'bulls' are looking for better levels to own the single unit. EUR/USD has outperformed the tightening spread between the 10-year German bund yields and 10-year Treasury yields. Stronger support appears at €1.1275 and resistance at €1.1360.
GBP (£1.2906) has resumed its downtrend with a four-month low post PMI reading (see below) helping to weigh on sterling. Dealers note resistance at £1.2950 level, while support lies at £1.2835-40. Recent support for the pound came from Bank of England (BoE) Governor Carney suggesting a near-term rate increase was possible.
5. Eurozone picks up speed in Q2, U.K disappoints
Data this morning shows that European services PMI's were generally positive – Germany, France and Spain all beat estimates while Italy missed.
In the U.K, service PMI's (53.4 vs. 53.6) slightly missed consensus and was lower from the prior month with many noting that momentum in the U.K economy may be slowing. The average over the three-months through June was the same as in Q1, and is consistent with growth of +0.4%. This raising question whether the Bank of England (BoE) can afford to raise rates any time soon.
Other data showed that Eurozone retail sales were stronger than expected during May, with Eurostat recording a +0.4% rise, twice the expected rate of increase.
Note: Data is consistent with other indicators that point to a further pickup in growth during the Q2, including the composite PMI, which was revised up.
However, this faster growth is 'not' translating into a sustained increase in inflation, which will provide further mixed news for the ECB.
Fed Meeting Minutes Take Center Stage
Today, investors will probably be sitting on the edge of their seats in anticipation of the minutes from the latest FOMC gathering, where the Committee raised the Federal funds rate by 25bps. In the statement accompanying the decision, Fed officials noted that they expect to begin normalizing the Bank’s balance sheet later this year in a slow and predictable manner, but left the precise timing and sequencing a mystery. Meanwhile, they kept the 'dot plot' largely unchanged, signaling that one more rate hike is on the cards for this year. In our view, market participants will dig into the minutes for more details on the timing of the balance sheet normalization, as well as any discussion with regards to the timing of the next rate increase. At the time of writing, the market is anticipating the next hike to come in March 2018. This shows that the dot plot has not convinced the financial community, which may need stronger hints before it prices in another hike for 2017.
USD/JPY traded in a consolidative manner yesterday, oscillating around the 113.25 (R1) hurdle and the downside resistance line taken from the peak of the 11th of January. On the 4-hour chart, the price structure suggests a short-term uptrend, but the bulls need to clear the 113.25 (R1) zone before we get confident on further upside extensions. Something like that could signal the break of the aforementioned downside resistance line and is possible to see scope for extensions towards our next resistance level of 113.90 (R2). The catalyst for such a move could prove an optimistic Fed tonight. On the other hand, if the Committee disappoints those who expect strong hints with regards to another rate increase this year, or those who look for extra details with regards to B/S normalization, the pair may slid and challenge the short-term uptrend line taken from the low of the 14th of June.
With what we know until now, our own view is that the Fed is indeed likely to proceed with another hike this year. The Committee has repeatedly pointed out that the softness in the economic data for Q1 was transitory. Indeed, the Atlanta Fed GDPNow model adds credibility to that scenario by indicating that GDP growth rebounded to 3.0% in Q2, while the June employment report is expected to show that the labor market continues to tighten. The key risks to our view are further weakness in growth data and/or further slowdown in the nation’s core inflation.
Qatar’s deadline expires
Turning to the political spectrum, today is the deadline of the 48-hour extension given to Qatar to comply with a list of 13 demands issued by Saudi Arabia, the UAE, Bahrain and Egypt, with the four countries meeting to take a final decision. On Monday, Qatar handed its response to Kuwait, which is the mediator of the crisis, while the other Arab nations received it earlier today and will examine it. Qatar’s Foreign Minister said that Doha replied only to the demands that did not violate international law or interfere in the country’s domestic affairs. He also noted that Doha is prepared to engage in dialogue to resolve the issue and that he believes there is good will on both sides. Combined with UAE Foreign Minister’s comments that 'the alternative is not escalation', this makes the threat of something like that minimal.
Nevertheless, if the situation does escalate, risk off may prevail. Safe havens are likely to be the main beneficiaries, while riskier assets may come under some selling interest. Oil and natural gas prices could gain as the risk of supply disruptions would likely increase. However, given that yesterday Qatar announced plans to boost gas production, speculation of increased supply in the longer run may keep any potential natural gas gains short lived and moderate.
WTI continued trading higher on Tuesday, breaking the resistance (now turned into support) level of 46.70 (S1). In our view, the short-term outlook remains positive and therefore we would expect that break to set the stage for extensions towards the 48.50 (R1) territory, marked by the peak of the 6th of June. Zooming out to the daily chart, we see that the price continues to trade within the downside channel that has been containing the price action since early February. However, given that the latest recovery started after testing the lower bound of that channel, we see the case for further near-term advances, perhaps towards the upper bound.
As for the rest of today’s events:
During the European day, we get the final services and composite PMIs from several European countries and the Eurozone as a whole. As the final figures are expected to confirm the preliminary estimates, any reaction in the euro may by muted. Eurozone’s retail sales for May are also coming out.
We get the services PMI for June from the UK as well. Expectations are for the index to have slid somewhat, to 53.5 and 53.8. Following the more-than-expected declines in both the manufacturing and construction PMIs for the month, we see the case for the services index to follow suit and perhaps fall by more than anticipated.
In the US, factory orders are expected to fall faster than the previous month. However, we expect the indicator to have little market impact as investors will probably have their gaze locked on the FOMC minutes.
USD/JPY
Support: 112.90 (S1), 112.50 (S2), 111.80 (S3)
Resistance: 113.25 (R1), 113.90 (R2), 114.40 (R3)
WTI
Support: 112.90 (S1), 112.50 (S2), 111.80 (S3)
Resistance: 113.25 (R1), 113.90 (R2), 114.40 (R3)
EUR/USD Analysis: Reveals Short Term Pattern
After a more thorough analysis, a short term descending channel was discovered on the hourly chart for the EUR/USD currency pair. In accordance with the pattern, the rate should pass the support of the weekly and monthly PP at 1.1348 and 1.1331. However, the currency exchange rate is set to have additional support from the 200-hour SMA, which on Wednesday morning was located at the 1.1320 mark. Meanwhile, as it was expected on Tuesday, the 55-hour SMA has begun to provide resistance to the currency pair near the 1.1370 mark. It is highly likely that the pair finds support at the pivot point at 1.1348 while making attempts to break the resistance of the 55-hour SMA. As a result, a small scale descending triangle might form, the breakout of which should reveal the short-term direction of the pair.
GBP/USD Analysis: Shows Lack Of Momentum
On Tuesday, the Sterling was restrained by a combination of the 55– and 100-hour SMAs that limited its gains until the 1.2950 mark. Thus, GBP/USD was characterised by a consolidation period, failing to form a distinctive move either direction. However, the pair did trade in a slight movement downwards that may result in a formation of a channel down if sustained. Technical indicators are generally neutral for the upcoming hours, but slightly bullish on the daily time-frame. However, it is more likely that the rate trades lower and tests the monthly PP at 1.2883 early on Thursday. This scenario depends on the rate's inability to cross the 55-hour SMA. On the contrary, the Sterling may also continue to move sideways, thus surpassing the 55-hour SMA at some point.
USD/JPY Analysis: Set For Appreciation
USD/JPY was trading in the 112.85/113.30 area on Tuesday's trading session. The Greenback was appreciating slightly against the Yen prior to being pushed lower late in the evening. The pair subsequently regained its upward momentum, bouncing off the lower Bollinger band and crossing the 55-hour SMA at 113.20. Today's bullish indicators suggest that a rise in price is likely to occur, especially in the upcoming 24 hours. The scope of the upward momentum is yet to be seen, as no resistance up to the monthly R1 at 113.94 exist. In case of strong upside risks, this level may be reached. The nearest support is formed by the 55– and 100-hour SMAs at 113.07 and 112.70, respectively. The latter may likewise be regarded as a possible bottom limit
XAU/USD Analysis: Faces Resistance
The yellow metal finally encountered the resistance of the 55-hour SMA just below the 1,230 mark. This resistance level managed to force the bullion into a short term retreat. However, the retreat was unlikely to last. After a review of the metal's chart, it was discovered that the bullion is in a medium term descending channel pattern. The rebound, which occurred on Monday, was not only caused by the monthly S1 at 1,220.50, but also by the lower trend-line of the channel down pattern. Thus, it can be assumed that the bullion's price will head for the upper trend line of the channel. In accordance with this hypothesis, not only the 55-hour SMA should be broken. The 100-hour SMA near the 1,235 mark would also be passed.
Technical Outlook: WTI Oil – Reversal Signal Is Forming On Daily Chart
WTI oil trades in red on Wednesday with reversal pattern forming on daily chart after broader recovery was capped by falling 55SMA at $47.30 on Tuesday and day ended in tight Doji candle. Slow stochastic is reversing lower in deep overbought territory on daily chart, supporting reversal scenario, along with bearish divergence on hourly RSI / MACD. Fresh weakness penetrated into thick hourly cloud (spanned between $46.70/00) with close below cloud to generate another bearish signal. Correction may extend to $45.29 (Fibo 38.2% of $42.04/$47.30 rally) and could travel to $44.91 (daily Tenkan-sen) on break of the latter. US weekly crude stocks are in focus for fresh signals. API data are due today at 20:30 GMT (2.6 mln bls draw is forecasted vs 0.85 mln bls build previous week). US EIA weekly crude inventories report is due to be released on Thursday at 18:00 GMT (2.8 mln bls draw forecasted vs build of 0.11 mln bls previous week).
Res: 46.75, 47.30, 48.18, 48.74
Sup: 46.00, 45.86, 45.29, 44.91
Market Update – European Session: Bond Yields Under Pressure Following Various Central Bank Commentary
EU Mid-Market Update: European Services PMI firmer; Bond yields under pressure following various central bank commentary
Notes/Observations
European Services PMI generally positive, UK Services PMI lowest since Feb
UK Bonds leading European bonds lower after hawkish comments from BoE Saunders overnight
North Korea tensions continue after South Korea and the US carried out joint missile drills in response to North Koreas Ballistic missile launch
Overnight
Asia:
(KR) North Korea leader Kim Jong Un: Will not put nuclear and ICBM on negotiating table until US abandons its hostile policy against North Korea
(KR) South Korea's Joint Chiefs of Staff (JCS): missile units of South Korea and the US carried out joint ballistic missile drills in the East Sea at 7 am local time (2200 GMT on Tuesday) in response to the North Korea's repeated ballistic missile provocations
(CN) Xinhua Op Ed discusses recent liquidity conditions in China; suggests the PBoC's recent suspensions of open market operations was indicative of abundant liquidity with no manifestation of a June-end liquidity crunch this year
Thailand keeps interest rates unchanged at 1.5% as expected
Europe:
European Services PMI generally positive, Germany, France and Spain beat, Italy misses. Germany new business marked lowest reading since Sep 2016.
UK Services PMI slightly misses consensus and was lower from the prior month with economists noting momentum in the UK economy is slowing.
ECB's Couere says has not discussed changing policy yet noting they may come but hasn't happened yet
Overnight BoE Saunders said households should prepare for rates to go higher at some point; if rates do go up it will be in context of economy doing OK and unemployment being low and probably falling
Oil
IEA Chief Birol: Expects oil market to rebalance in H2 2017 under current conditions
(RU) Russia said to oppose any deeper production cuts at ministerial meeting on July 24 in St Petersburg
Economic Data
(DE) GERMANY JUN FINAL SERVICES PMI: 54.0 V 53.7E
(FR) FRANCE JUN FINAL SERVICES PMI: 56.9 V 55.3E (confirms 12 months of expansion)
(ES) SPAIN MAY SERVICES PMI: 58.3 V 56.5E (44rd month of expansion)
(IT) ITALY JUN SERVICES PMI: 53.6 V 54.6% (13TH MONTH OF EXPANSION)
(EU) EURO ZONE JUN FINAL SERVICES PMI: 55.4 V 54.7E
(EU) EURO ZONE MAY RETAIL SALES M/M: 0.4% V 0.4%E; Y/Y: 2.6% V 2.3%E
(SE) SWEDEN MAY INDUSTRIAL PRODUCTION M/M: 2.1% V 1.0%E; Y/Y: 8.0% V 5.0%E
(IE) IRELAND JUN SERVICES PMI: 57.6 V 59.5 PRIOR
(TH) THAILAND CENTRAL BANK (BOT) LEAVES BENCHMARK INTEREST RATE UNCHANGED AT 1.50%; AS EXPECTED
(SE) SWEDEN JUN PMI SERVICES: 57.3 V 58.3E
Fixed Income Issuance:
Non seen
SPEAKERS/FIXED INCOME/FX/COMMODITIES/ERRATUM
Equities
Indices [Stoxx50 -0.2% at 3,479, FTSE +0.1% at 7,362, DAX +0.1% at 12,448, CAC-40 +0.2% at 5,185, IBEX-35 flat at 10,567, FTSE MIB -0.4% at 20,949, SMI -0.3% at 8,940, S&P futures flat ]
Market Focal Points/Key Themes: European stocks open broadly flat and slipped slightly as the session moved on; risk sentiment improving slightly despite ongoing concerns over North Korea; trading remains thin before US returns to market after holiday; oil price doesn't manage to support energy stocks; homebuilders and materials stocks the best performers; gold rose slightly, but not enough to support precious metals miners; attention shifting to Fed minutes to be released later today;
Equities
Consumer discretionary [Persimmon PSN.UK +3.3% (results), Topps Tiles TPT.UK -2.7% (earnings), Adidas ADS.DE +4.3% (analyst action), Booker Group BOK.UK +2.8% (trading update)]
Financials [Banca Cargie CRGI.IT +9.4% (continuation of trade)]
Healthcare [Ion Beam IBAB.BE -22.3% (cuts outlook)]
Industrials [Safran SAF.FR +1.4% (analyst action)]
Materials [SIG Plc SHI.UK +3.9% (trading update)]
Speakers
(EU) ECB Coeure: Has not discussed changing policy; discussion may come but hasn't happened yet
(ES) Spain PM Rajoy: Hopes world economy will grow 3.5% this year
Currencies
EURUSD saw weakness after comments from ECB officials but quickly pared losses with support found at 1.1317. The underlying downtrend continue with a move above 1.1360 needed to signal a move back higher.
GBPUSD resume its downtrend with a 4 month low PMI reading helping weigh on Sterling. Dealers not resistance at 1.2950 level while support lies at 1.2835-40.
Fixed Income
Bund futures trade lower following the lead from Gilts as more hawkish commentary out of the UK puts pressure on Yields whilst comments from ECBs Coeure kept the Bund in check. Support lies initially at Monday low at 161.52.
Wednesday’s liquidity report showed Tuesday’s excess liquidity rose to €1.647T a rise of €3B from €1.644T prior. Use of the marginal lending facility fell to €124M from €315M prior.
Corporate issuance non seen
Looking Ahead
07:00 (US) MBA Mortgage Applications w/e Jun 30th: No est v % prior
08:00 (HU) Hungary Central Bank (NBH) Jun Minutes
08:15 (UK) Baltic Dry Bulk Index
08:30 (CL) Chile May Economic Activity (Monthly GDP) M/M: 1.0 v 0.9% prior; Y/Y: 1.7 v 0.1% prior
08:55 (US) Weekly Redbook Sales
09:00 (BR) Brazil Jun PMI Services: No est v 49.2 prior, PMI Composite: No est v 50.4 prior
09:00 (MX) Mexico Apr Gross Fixed Investment: -5.9 v 3.9% prior
09:00 (MX) Mexico Jun Consumer Confidence: 88.0e v 86.8 prior
10:00 (US) May Factory Orders: -0.5%e v -0.2% prior, Factory Orders (Ex transportation): No est v 0.1% prior
10:00 (US) May Final Durable Goods Orders: -1.0%e v -1.1% prelim; Durables Ex Transportation: No est v +0.1% prelim, Capital Goods Orders (Non-defense ex aircraft): No est v 0.0% prelim, Capital Goods Shipments (Non-defense/ex-aircraft): No est v % prelim, Durables Ex-Defense: No est v % prelim
11:00 (CO) Colombia May Exports: $2.9Be v $2.6B prior
14:00 (US) FOMC Minutes from Jun 14th Meeting
16:30 (US) Weekly API Oil Inventories