
Sample Category Title
Opportunity To Build A SPI200 Short Position
We spoke about this SPI 200 daily level a couple of days ago and as the Aussie market opens today, the price action looks too good to ignore.
First of all, let's wind back to what we had to say in Tuesday's blog and focus on the daily level that we were looking to trade around:
SPI 200 Daily:
As you can see, price has once again held here at the green 'x', giving us an opportunity to try to build a short position. Zoom into the intraday charts and try to identify pullbacks into previous short term support that could be used as resistance.
Strong higher time frame resistance has held and we are therefore on the lookout for pullbacks to short.
Take a look at this morning's SPI 200 hourly chart:
SPI 200 Hourly:
(FED) Minutes of the Federal Open Market Committee June 13-14, 2017
Minutes of the Federal Open Market Committee
June 13-14, 2017
A joint meeting of the Federal Open Market Committee and the Board of Governors was held in the offices of the Board of Governors of the Federal Reserve System in Washington, D.C., on Tuesday, June 13, 2017, at 1:00 p.m. and continued on Wednesday, June 14, 2017, at 9:00 a.m.1
PRESENT:
Janet L. Yellen, Chair
William C. Dudley, Vice Chairman
Lael Brainard
Charles L. Evans
Stanley Fischer
Patrick Harker
Robert S. Kaplan
Neel Kashkari
Jerome H. Powell
Raphael W. Bostic, Loretta J. Mester, Mark L. Mullinix, Michael Strine, and John C. Williams, Alternate Members of the Federal Open Market Committee
James Bullard, Esther L. George, and Eric Rosengren, Presidents of the Federal Reserve Banks of St. Louis, Kansas City, and Boston, respectively
Brian F. Madigan, Secretary
Matthew M. Luecke, Deputy Secretary
David W. Skidmore, Assistant Secretary
Michelle A. Smith, Assistant Secretary
Scott G. Alvarez, General Counsel
Michael Held, Deputy General Counsel
Steven B. Kamin, Economist
Thomas Laubach, Economist
David W. Wilcox, Economist
Beth Anne Wilson, James A. Clouse, Thomas A. Connors, Eric M. Engen, Evan F. Koenig, Jonathan P. McCarthy, William Wascher, and Mark L.J. Wright, Associate Economists
Simon Potter, Manager, System Open Market Account
Lorie K. Logan, Deputy Manager, System Open Market Account
Ann E. Misback, Secretary, Office of the Secretary, Board of Governors
Matthew J. Eichner,2 Director, Division of Reserve Bank Operations and Payment Systems, Board of Governors; Michael S. Gibson, Director, Division of Supervision and Regulation, Board of Governors
Michael T. Kiley, Deputy Director, Division of Financial Stability, Board of Governors; Stephen A. Meyer, Deputy Director, Division of Monetary Affairs, Board of Governors
William B. English, Senior Special Adviser to the Board, Office of Board Members, Board of Governors
Trevor A. Reeve, Senior Special Adviser to the Chair, Office of Board Members, Board of Governors
David Bowman, Joseph W. Gruber, David Reifschneider, and John M. Roberts, Special Advisers to the Board, Office of Board Members, Board of Governors
Linda Robertson, Assistant to the Board, Office of Board Members, Board of Governors
Christopher J. Erceg, Senior Associate Director, Division of International Finance, Board of Governors; Joshua Gallin, Senior Associate Director, Division of Research and Statistics, Board of Governors; Gretchen C. Weinbach,2 Senior Associate Director, Division of Monetary Affairs, Board of Governors
Antulio N. Bomfim, Ellen E. Meade, and Edward Nelson, Senior Advisers, Division of Monetary Affairs, Board of Governors; Jeremy B. Rudd, Senior Adviser, Division of Research and Statistics, Board of Governors
Rochelle M. Edge, Associate Director, Division of Financial Stability, Board of Governors; Jane E. Ihrig, Associate Director, Division of Monetary Affairs, Board of Governors; Stacey Tevlin, Associate Director, Division of Research and Statistics, Board of Governors
Min Wei, Deputy Associate Director, Division of Monetary Affairs, Board of Governors
Christopher J. Gust, Assistant Director, Division of Monetary Affairs, Board of Governors; Norman J. Morin and Karen M. Pence, Assistant Directors, Division of Research and Statistics, Board of Governors
Don Kim, Adviser, Division of Monetary Affairs, Board of Governors
Penelope A. Beattie, Assistant to the Secretary, Office of the Secretary, Board of Governors
Giovanni Favara and Rebecca Zarutskie, Section Chiefs, Division of Monetary Affairs, Board of Governors
David H. Small, Project Manager, Division of Monetary Affairs, Board of Governors
Kimberly Bayard, Group Manager, Division of Research and Statistics, Board of Governors
Stephen Lin, Principal Economist, Division of International Finance, Board of Governors; Lubomir Petrasek, Principal Economist, Division of Monetary Affairs, Board of Governors
Achilles Sangster II, Information Management Analyst, Division of Monetary Affairs, Board of Governors
Marie Gooding, First Vice President, Federal Reserve Bank of Atlanta
David Altig, Kartik B. Athreya, Mary Daly, Jeff Fuhrer, and Christopher J. Waller, Executive Vice Presidents, Federal Reserve Banks of Atlanta, Richmond, San Francisco, Boston, and St. Louis, respectively
Spencer Krane and Ellis W. Tallman, Senior Vice Presidents, Federal Reserve Banks of Chicago and Cleveland, respectively
Roc Armenter and Kathryn B. Chen,3 Vice Presidents, Federal Reserve Banks of Philadelphia and New York, respectively
Andrew T. Foerster, Senior Economist, Federal Reserve Bank of Kansas City
Selection of Committee Officer
By unanimous vote, the Committee selected Mark L.J. Wright to serve as Associate Economist, effective June 13, 2017, until the selection of his successor at the first regularly scheduled meeting of the Committee in 2018.
Developments in Financial Markets and Open Market Operations
The manager of the System Open Market Account (SOMA) reported on developments in domestic and foreign financial markets over the period since the May FOMC meeting. Yields on Treasury securities and the foreign exchange value of the dollar had declined modestly, while equity prices had continued to rise, contributing to a further easing of financial conditions according to some measures. Moreover, realized and implied volatility in financial markets remained low. Meanwhile, inflation compensation edged lower. Survey results and market pricing suggested that market participants saw a high probability of an increase in the FOMC's target range for the federal funds rate at this meeting.
The deputy manager reviewed survey results on market expectations for SOMA reinvestment policy and for the evolution of the System's balance sheet over coming years. The deputy manager also commented on money market developments. Over the intermeeting period, the federal funds rate remained well within the FOMC's target range, and take-up at the System's overnight reverse repurchase agreement facility was little changed from the previous period. The spread between the three-month London interbank offered rate and the overnight index swap (OIS) rate had narrowed markedly in recent months after rising noticeably in advance of the implementation of money market fund reform in the fall of 2016. The deputy manager also summarized details of the operational approach that the Open Market Desk planned to follow if the Committee adopted the proposal for SOMA reinvestment policy to be considered at this meeting.
By unanimous vote, the Committee ratified the Desk's domestic transactions over the intermeeting period. There were no intervention operations in foreign currencies for the System's account during the intermeeting period.
System Open Market Account Reinvestment Policy
The Chair observed that, starting with the March 2017 FOMC meeting, Committee participants had been discussing approaches to reducing the Federal Reserve's securities holdings in a gradual and predictable manner. She noted that participants appeared to have reached a consensus on an approach that involved specifying caps on the monthly amount of principal payments from securities holdings that would not be reinvested; these caps would rise over the period of a year, after which they would remain constant. Given this consensus, the Chair proposed that participants approve the plan and that it be published as an addendum to the Committee's Policy Normalization Principles and Plans; the addendum would be released at the conclusion of this meeting so as to inform the public well in advance of implementing the reinvestment policy. It was anticipated that when the Committee determined that economic conditions warranted implementation of the program, that step would be communicated through the Committee's postmeeting statement. Participants unanimously supported the proposal.
POLICY NORMALIZATION PRINCIPLES AND PLANS
(Addendum adopted June 13, 2017)
All participants agreed to augment the Committee's Policy Normalization Principles and Plans by providing the following additional details regarding the approach the FOMC intends to use to reduce the Federal Reserve's holdings of Treasury and agency securities once normalization of the level of the federal funds rate is well under way.1
- The Committee intends to gradually reduce the Federal Reserve's securities holdings by decreasing its reinvestment of the principal payments it receives from securities held in the System Open Market Account. Specifically, such payments will be reinvested only to the extent that they exceed gradually rising caps.
- For payments of principal that the Federal Reserve receives from maturing Treasury securities, the Committee anticipates that the cap will be $6 billion per month initially and will increase in steps of $6 billion at three-month intervals over 12 months until it reaches $30 billion per month.
- For payments of principal that the Federal Reserve receives from its holdings of agency debt and mortgage-backed securities, the Committee anticipates that the cap will be $4 billion per month initially and will increase in steps of $4 billion at three-month intervals over 12 months until it reaches $20 billion per month.
- The Committee also anticipates that the caps will remain in place once they reach their respective maximums so that the Federal Reserve's securities holdings will continue to decline in a gradual and predictable manner until the Committee judges that the Federal Reserve is holding no more securities than necessary to implement monetary policy efficiently and effectively.
- Gradually reducing the Federal Reserve's securities holdings will result in a declining supply of reserve balances. The Committee currently anticipates reducing the quantity of reserve balances, over time, to a level appreciably below that seen in recent years but larger than before the financial crisis; the level will reflect the banking system's demand for reserve balances and the Committee's decisions about how to implement monetary policy most efficiently and effectively in the future. The Committee expects to learn more about the underlying demand for reserves during the process of balance sheet normalization.
- The Committee affirms that changing the target range for the federal funds rate is its primary means of adjusting the stance of monetary policy. However, the Committee would be prepared to resume reinvestment of principal payments received on securities held by the Federal Reserve if a material deterioration in the economic outlook were to warrant a sizable reduction in the Committee's target for the federal funds rate. Moreover, the Committee would be prepared to use its full range of tools, including altering the size and composition of its balance sheet, if future economic conditions were to warrant a more accommodative monetary policy than can be achieved solely by reducing the federal funds rate.
1. The Committee's Policy Normalization Principles and Plans were adopted on September 16, 2014, and are available at www.federalreserve.gov/monetarypolicy/files/FOMC_PolicyNormalization.pdf. On March 18, 2015, the Committee adopted an addendum to the Policy Normalization Principles and Plans, which is available at www.federalreserve.gov/monetarypolicy/files/FOMC_PolicyNormalization.20150318.pdf. Return to text
Staff Review of the Economic Situation
The information reviewed for the June 13-14 meeting showed that labor market conditions continued to strengthen in recent months and suggested that real gross domestic product (GDP) was expanding at a faster pace in the second quarter than in the first quarter. The 12-month change in overall consumer prices, as measured by the price index for personal consumption expenditures (PCE), slowed a bit further in April; total consumer price inflation and core inflation, which excludes consumer food and energy prices, were both running somewhat below 2 percent. Survey-based measures of longer-run inflation expectations were little changed on balance.
Total nonfarm payroll employment expanded further in April and May, and the average pace of job gains over the first five months of the year was solid. The unemployment rate moved down to 4.3 percent in May; the unemployment rates for African Americans and for Hispanics stepped down but remained above the unemployment rates for Asians and for whites. The overall labor force participation rate declined somewhat, and the share of workers employed part time for economic reasons decreased a little. The rate of private-sector job openings increased in March and April, while the quits rate was little changed and the hiring rate moved down. The four-week moving average of initial claims for unemployment insurance benefits remained at a very low level through early June. Measures of labor compensation continued to rise at moderate rates. Compensation per hour in the nonfarm business sector increased 2-1/4 percent over the four quarters ending in the first quarter, a bit slower than over the same period a year earlier. Average hourly earnings for all employees increased 2-1/2 percent over the 12 months ending in May, about the same as over the comparable period a year earlier.
Total industrial production rose considerably in April, reflecting gains in manufacturing, mining, and utilities output. Automakers' assembly schedules suggested that motor vehicle production would slow in subsequent months, but broader indicators of manufacturing production, such as the new orders indexes from national and regional manufacturing surveys, pointed to modest gains in factory output over the near term.
Real PCE rose solidly in April after increasing only modestly in the first quarter. Light motor vehicle sales picked up in April but then moved down somewhat in May. The components of the nominal retail sales data used by the Bureau of Economic Analysis to construct its estimate of PCE were flat in May, but estimated increases in these components of sales for the previous two months were revised up. In addition, recent readings on key factors that influence consumer spending pointed to further solid growth in total real PCE in the near term, including continued gains in employment, real disposable personal income, and households' net worth. Moreover, consumer sentiment, as measured by the University of Michigan Surveys of Consumers, remained upbeat in May.
Residential investment appeared to be slowing after increasing briskly in the first quarter. The first-quarter strength may have reflected housing activity shifting earlier in response to unseasonably warm weather last quarter, to an anticipation of higher future interest rates, or to both. Starts of new single-family homes edged up in April, but the issuance of building permits for these homes declined somewhat. Meanwhile, starts of multifamily units fell. Moreover, sales of both new and existing homes decreased in April.
Real private expenditures for business equipment and intellectual property seemed to be increasing further after rising at a solid pace in the first quarter. Both nominal shipments and new orders of nondefense capital goods excluding aircraft rose in April, and new orders continued to exceed shipments, pointing to further gains in shipments in the near term. In addition, indicators of business sentiment were upbeat in recent months. Although firms' nominal spending for nonresidential structures excluding drilling and mining declined in April, the number of oil and gas rigs in operation, an indicator of spending for structures in the drilling and mining sector, continued to rise through early June.
Nominal federal government spending data for April and May pointed to essentially flat real federal purchases in the second quarter. Real state and local government purchases appeared to be moving down, as state and local government payrolls declined, on net, in April and May, and nominal construction expenditures by these governments decreased in April.
The nominal U.S. international trade deficit widened slightly in March, with a small decline in exports and a small increase in imports. The March data, together with revised estimates for earlier months, indicated that real exports grew briskly in the first quarter and at a faster pace than in the second half of 2016. Real imports also increased in the first quarter but at a slower pace than in the second half of 2016. In April, the nominal trade deficit widened, as imports picked up while exports declined slightly. Net exports were estimated to have made a small positive contribution to real GDP growth in the first quarter. However, the April trade data suggested that net exports might be a slight drag on real GDP growth in the second quarter.
Total U.S. consumer prices, as measured by the PCE price index, increased 1-3/4 percent over the 12 months ending in April. Core PCE price inflation was 1-1/2 percent over those same 12 months. Over the 12 months ending in May, the consumer price index (CPI) rose a little less than 2 percent, while core CPI inflation was 1-3/4 percent. The median of inflation expectations over the next 5 to 10 years from the Michigan survey was unchanged in May, and the median expectation for PCE price inflation over the next 10 years from the Survey of Professional Forecasters also held steady in the second quarter. Likewise, the medians of longer-run inflation expectations from the Desk's Survey of Primary Dealers and Survey of Market Participants were essentially unchanged in June.
The economic expansions in Canada and the euro area as well as in China and many other emerging market economies (EMEs) continued to firm in the first quarter. In contrast, economic growth in the United Kingdom slowed sharply. Recent indicators suggested that real GDP growth in most foreign economies remained solid in the second quarter. Headline inflation across the advanced foreign economies (AFEs) generally appeared to moderate from the pace registered over the first quarter, as the effects of earlier increases in energy prices started to fade; core inflation continued to be subdued in many AFEs. Among the EMEs, inflation in China rose while inflation in Latin America fell. In Mexico, the effects of fuel price hikes in January and the pass-through from earlier currency depreciation to prices started to wane, but inflation remained above the central bank's target.
Staff Review of the Financial Situation
Domestic financial market conditions remained generally accommodative over the intermeeting period. U.S. equity prices increased over the period, longer-term Treasury yields declined, and the dollar depreciated. A decline in the perceived likelihood of a significant fiscal expansion and the below-expectations reading on the April CPI reportedly contributed to lower yields on longer-tenor Treasury securities. Market participants' perceptions of an improved global economic outlook appeared to provide some support to prices of risk assets.
FOMC communications over the intermeeting period were viewed as broadly in line with investors' expectations that the Committee would continue to remove policy accommodation at a gradual pace. Market participants interpreted the May FOMC statement and the meeting minutes as indicating that the Committee had not materially changed its economic outlook. In response to the discussion of SOMA reinvestment policy in the minutes, a number of market participants reportedly pulled forward their expectations for the most likely timing of a change to the Committee's reinvestment policy, a shift that was evident in the responses to the Desk's Survey of Primary Dealers and Survey of Market Participants. However, investors also reportedly viewed the Committee's planning as mitigating the risk that the process of reducing the size of the Federal Reserve's balance sheet would lead to outsized movements in interest rates or have adverse effects on market functioning.
The probability of an increase in the target range for the federal funds rate occurring at the June meeting, as implied by quotes on federal funds futures contracts, rose to a high level. However, the expected federal funds rate from late 2018 to the end of 2020 implied by OIS quotes declined slightly. Immediately following the May FOMC meeting, nominal Treasury yields rose at short and intermediate maturities, reportedly reflecting the response of investors to a passage in the postmeeting statement indicating the Committee's view that the slowing in real GDP growth during the first quarter was likely to be transitory. Later in the intermeeting period, yields declined in reaction to the release of weaker-than-expected April CPI data and the somewhat disappointing May employment report. On balance, the Treasury yield curve flattened, with short-term yields rising modestly and the 10-year yield declining. Both 5-year and 5-to-10-year-forward TIPS-based inflation compensation declined, in part reflecting the below-expectations inflation data.
Broad U.S. equity price indexes increased. One-month-ahead option-implied volatility on the S&P 500 index--the VIX--was little changed, on net, and remained near the lower end of its historical range.
Conditions in short-term funding markets were stable over the intermeeting period. Yields on a broad set of money market instruments remained in the ranges observed since the FOMC increased the target range for the federal funds rate in March. Term OIS rates rose as expectations firmed for an increase in the federal funds rate target at this meeting.
Financing conditions for nonfinancial businesses continued to be accommodative. Commercial and industrial loans outstanding increased in April and May after being weak in the first quarter, although the growth of these loans remained well below the pace seen a year ago. Issuance of both corporate debt and equity was strong. Gross issuance of institutional leveraged loans was solid in April and May, although it receded from the near-record levels seen over the previous two months.
Commercial real estate (CRE) loans on banks' books grew robustly in April and May, with nonfarm nonresidential loans leading the expansion. However, recent CRE loan growth was a bit slower than that during the first quarter, in part reflecting a slowdown in lending for both construction and multifamily units. Issuance of commercial mortgage-backed securities (CMBS) through the first five months of this year was similar to the issuance over the same period a year earlier. While delinquency rates on CRE loans held by banks edged down further in the first quarter, the delinquency rates on loans in CMBS pools continued to increase. The rise in CMBS delinquency rates was mostly confined to loans that were originated during the period of weak underwriting before the financial crisis. The increase in those delinquencies had generally been expected by market participants and was not anticipated to have a material effect on credit availability or market conditions.
Residential mortgage rates declined slightly, in line with yields on longer-term Treasury and mortgage-backed securities, but remained elevated relative to the third quarter of 2016. Despite the higher level of mortgage rates, growth in mortgage lending for home purchases remained near the upper end of its recent range during the first quarter. Delinquency rates on residential mortgage loans continued to edge down amid robust house price growth and still-tight lending standards for households with low credit scores and hard-to-document incomes.
Financing conditions in consumer credit markets remained generally accommodative, although some indicators pointed to modest reductions in credit availability in recent months. Tighter conditions for credit card borrowing were especially apparent within the subprime segment, where there had been some further deterioration of credit performance. On a year-over-year basis, overall credit card balances continued to grow in April at a robust rate, although the pace had moderated a bit from that of 2016.
Growth in auto loans remained solid through the first quarter. Overall delinquency rates on auto loans continued to be relatively low, but the delinquency rate among subprime borrowers remained elevated, reflecting easier lending standards in 2015 and 2016. Recent evidence suggested that these lending standards had tightened; the credit rating of the average borrower had trended higher, and new extensions of subprime auto loans had declined.
Over the period since the May FOMC meeting, foreign financial markets were influenced by incoming economic data and by political developments both abroad and in the United States. Most AFE and EME equity indexes edged higher, supported by robust first-quarter earnings reports and generally positive data releases overseas. The broad U.S. dollar depreciated about 1-3/4 percent over the intermeeting period, weakening against both AFE and EME currencies. In particular, the dollar depreciated against the Canadian dollar following communications by the Bank of Canada suggesting that the removal of policy accommodation could occur sooner than previously expected by market participants. The dollar also depreciated against the euro, which was supported by the results of the French presidential election and by stronger-than-expected macroeconomic releases. Those data releases prompted the European Central Bank at its June 8 meeting to change its assessment of risks to the economic outlook from "tilted to the downside" to "balanced." U.S. developments, including mixed economic data reports, also weighed on the dollar. In contrast, the dollar strengthened against sterling following the U.K. parliamentary election. Changes in longer-dated AFE sovereign bond yields were mixed, while shorter-dated yields moved slightly higher. EME sovereign spreads were little changed, while flows into EME mutual funds remained robust. However, Brazilian sovereign spreads widened and the Brazilian realdepreciated notably amid increased political uncertainty.
Staff Economic Outlook
In the U.S. economic projection prepared by the staff for the June FOMC meeting, real GDP growth was forecast to step up to a solid pace in the second quarter following its weak reading in the first quarter, primarily reflecting faster real PCE growth. On balance, the incoming data on aggregate spending were a little stronger than the staff had expected, and the forecast of real GDP growth for the current year was a bit higher than in the previous projection. Beyond this year, the projection for real GDP growth was essentially unchanged. The staff continued to project that real GDP would expand at a modestly faster pace than potential output in 2017 through 2019, supported in part by the staff's maintained assumption that fiscal policy would become more expansionary in the coming years. The unemployment rate was projected to decline gradually over the next couple of years and to continue running below the staff's estimate of its longer-run natural rate over this period.
The staff's forecast for consumer price inflation, as measured by the change in the PCE price index, was revised down slightly for 2017 because of the weaker-than-expected incoming data for inflation. However, the projection was little changed thereafter, as the recent weakness in inflation was viewed as transitory. Inflation was still expected to be somewhat higher this year than last year, largely reflecting an upturn in the prices for food and non-energy imports. The staff projected that inflation would increase further in the next couple of years, and that it would be close to the Committee's longer-run objective in 2018 and at 2 percent in 2019.
The staff viewed the uncertainty around its projections for real GDP growth, the unemployment rate, and inflation as similar to the average of the past 20 years. Many financial market indicators of uncertainty were subdued, and the uncertainty associated with the foreign outlook appeared to have subsided further, on balance, since late last year; these developments were judged as counterweights to elevated measures of economic policy uncertainty. The staff saw the risks to the forecasts for real GDP and the unemployment rate as balanced; the staff's assessment was that the downside risks associated with monetary policy not being well positioned to respond to adverse shocks had diminished since its previous forecast. The risks to the projection for inflation also were seen as roughly balanced. The downside risks from the possibility that longer-term inflation expectations may have edged down or that the dollar could appreciate substantially were seen as essentially counterbalanced by the upside risk that inflation could increase more than expected in an economy that was projected to continue operating above its longer-run potential.
Participants' Views on Current Conditions and the Economic Outlook
In conjunction with this FOMC meeting, members of the Board of Governors and Federal Reserve Bank presidents submitted their projections of the most likely outcomes for real output growth, the unemployment rate, and inflation for each year from 2017 through 2019 and over the longer run, based on their individual assessments of the appropriate path for the federal funds rate.4 The longer-run projections represented each participant's assessment of the rate to which each variable would be expected to converge, over time, under appropriate monetary policy and in the absence of further shocks to the economy.5 These projections and policy assessments are described in the Summary of Economic Projections (SEP), which is an addendum to these minutes.
In their discussion of the economic situation and the outlook, meeting participants agreed that the information received over the intermeeting period indicated that the labor market had continued to strengthen and that economic activity had been rising moderately, on average, so far this year. Job gains had moderated since the beginning of the year but had remained solid, on average, and the unemployment rate had declined. Household spending had picked up in recent months, and business fixed investment had continued to expand. Inflation measured on a 12-month basis had declined recently and, like the measure excluding food and energy prices, had been running somewhat below 2 percent. Market-based measures of inflation compensation remained low; survey-based measures of longer-term inflation expectations were little changed on balance.
Participants generally saw the incoming information on spending and labor market indicators as consistent, overall, with their expectations and indicated that their views of the outlook for economic growth and the labor market had changed only slightly since the May FOMC meeting. As anticipated, growth in consumer spending seemed to have bounced back from a weak first quarter, and participants continued to expect that, with further gradual adjustments in the stance of monetary policy, economic activity would expand at a moderate pace and labor market conditions would strengthen somewhat further. In light of surprisingly low recent readings on inflation, participants expected that inflation on a 12-month basis would remain somewhat below 2 percent in the near term. However, participants judged that inflation would stabilize around the Committee's 2 percent objective over the medium term.
Growth in consumer spending appeared to be rebounding after slowing in the first quarter of this year. Participants generally continued to expect that ongoing job gains, rising household income and wealth, and improved household balance sheets would support moderate growth in household spending over the medium term. However, District contacts reported that automobile sales had slowed recently; some contacts expected sales to slow further, while others believed that sales were leveling out.
Participants generally agreed that business fixed investment had continued to expand in recent months, supported in particular by a rebound in the energy sector. District contacts suggested that an expansion in oil production capacity was likely to continue in the near term, though the longer-term outlook was more uncertain. Conditions in the manufacturing sector in several Districts were reportedly strong, but activity in a couple of them had slowed in recent months from a high level, and some contacts in the automobile industry reported declines in production that they expected to continue in the near term. District reports regarding the service sector were generally positive. In contrast, contacts in a couple of Districts indicated that conditions in the agricultural sector remained weak. Contacts in many Districts remained optimistic about business prospects, which were supported in part by improving global conditions. However, this optimism appeared to have recently abated somewhat, partly because contacts viewed the likelihood of significant fiscal stimulus as having diminished. Contacts at some large firms indicated that they had curtailed their capital spending, in part because of uncertainty about changes in fiscal and other government policies; some contacts at smaller firms, however, indicated that their capital spending plans had not been appreciably affected by news about government policy. Reports regarding housing construction from District contacts were mixed.
Labor market conditions continued to strengthen in recent months. The unemployment rate fell from 4.5 percent in March to 4.3 percent in May and was below levels that participants judged likely to be normal over the longer run. Monthly increases in nonfarm payrolls averaged 160,000 since the beginning of the year, down from 187,000 per month in 2016 but still well above estimates of the pace necessary to absorb new entrants in the labor force. A few participants interpreted this slowing in payroll growth as an expected development that reflected a tight labor market. Other labor market indicators, such as the number of job openings and broader measures of unemployment, were also seen as consistent with labor market conditions having strengthened in recent months. Moreover, contacts in several Districts reported shortages of workers in selected occupations and in some cases indicated that firms were significantly increasing salaries and benefits in order to attract or keep workers. However, other contacts reported only modest wage gains, and participants observed that measures of labor compensation for the overall economy continued to rise only moderately despite strengthening labor market conditions. A couple of participants saw the restrained increases in labor compensation as consistent with the low productivity growth and moderate inflation experienced in recent years. In light of the recent behavior of labor compensation and consumer prices as well as demographic trends, a number of participants lowered their estimate of the longer-run normal level of the unemployment rate.
Recent readings on headline and core PCE price inflation had come in lower than participants had expected. On a 12-month basis, headline PCE price inflation was running somewhat below the Committee's 2 percent objective in April, partly because of factors that appeared to be transitory. Core PCE price inflation--which historically has been a more useful predictor of future inflation, although it, too, can be affected by transitory factors--moved down from 1.8 percent in March to 1.5 percent in April. In addition, CPI inflation in May came in lower than expected. Most participants viewed the recent softness in these price data as largely reflecting idiosyncratic factors, including sharp declines in prices of wireless telephone services and prescription drugs, and expected these developments to have little bearing on inflation over the medium run. Participants continued to expect that, as the effects of transitory factors waned and labor market conditions strengthened further, inflation would stabilize around the Committee's 2 percent objective over the medium term. Several participants suggested that recent increases in import prices were consistent with this expectation. However, several participants expressed concern that progress toward the Committee's 2 percent longer-run inflation objective might have slowed and that the recent softness in inflation might persist. Such persistence might occur in part because upward pressure on inflation from resource utilization may be limited, as the relationship between these two variables appeared to be weaker than in previous decades. However, a couple of other participants raised the concern that a tighter relationship between inflation and resource utilization could reemerge if the unemployment rate ran significantly below its longer-run normal level, which could result in inflation running persistently above the Committee's 2 percent objective.
Overall, participants continued to see the near-term risks to the economic outlook as roughly balanced. Participants again noted the uncertainty regarding the possible enactment, timing, and nature of changes to fiscal and other government policies and saw both upside and downside risks to the economic outlook associated with such changes. A number of participants, pointing to improved prospects for foreign economic growth, viewed the downside risks to the U.S. economic outlook stemming from international developments as having receded further over the intermeeting period. With regard to the outlook for inflation, some participants emphasized downside risks, particularly in light of the recent low readings on inflation along with measures of inflation compensation and some survey measures of inflation expectations that were still low. However, a couple of participants expressed concern that a substantial undershooting of the longer-run normal rate of unemployment could pose an appreciable upside risk to inflation or give rise to macroeconomic or financial imbalances that eventually could lead to a significant economic downturn. Participants agreed that the Committee should continue to monitor inflation developments closely.
In their discussion of recent developments in financial markets, participants observed that, over the intermeeting period, equity prices rose, longer-term interest rates declined, and volatility in financial markets was generally low. They also noted that, according to some measures, financial conditions had eased even as the Committee reduced policy accommodation and market participants continued to expect further steps to tighten monetary policy. Participants discussed possible reasons why financial conditions had not tightened. Corporate earnings growth had been robust; nevertheless, in the assessment of a few participants, equity prices were high when judged against standard valuation measures. Longer-term Treasury yields had declined since earlier in the year and remained low. Participants offered various explanations for low bond yields, including the prospect of sluggish longer-term economic growth as well as the elevated level of the Federal Reserve's longer-term asset holdings. Some participants suggested that increased risk tolerance among investors might be contributing to elevated asset prices more broadly; a few participants expressed concern that subdued market volatility, coupled with a low equity premium, could lead to a buildup of risks to financial stability.
In their discussion of monetary policy, participants generally saw the outlook for economic activity and the medium-term outlook for inflation as little changed and viewed a continued gradual removal of monetary policy accommodation as being appropriate. Based on this assessment, almost all participants expressed the view that it would be appropriate for the Committee to raise the target range for the federal funds rate 25 basis points at this meeting. These participants agreed that, even after an increase in the target range for the federal funds rate at this meeting, the stance of monetary policy would remain accommodative, supporting additional strengthening in labor market conditions and a sustained return to 2 percent inflation. A few participants also judged that the case for a policy rate increase at this meeting was strengthened by the easing, by some measures, in overall financial conditions over the previous six months. One participant did not believe it was appropriate to raise the federal funds rate target range at this meeting; this participant suggested that the Committee should maintain the target range for the federal funds rate at 3/4 to 1 percent until the inflation rate was actually moving toward the Committee's 2 percent longer-run objective.
Participants noted that, with the process of normalization of the level of the federal funds rate continuing, it would likely become appropriate this year for the Committee to announce and implement a specific timetable for its program of reducing reinvestment of the Federal Reserve's securities holdings. It was observed that the ensuing reduction in securities holdings would be gradual and would follow an extended period of Committee communications on balance sheet normalization policy, including the information that would be released at the conclusion of this meeting. Consequently, the effect on financial market conditions of the eventual announcement of the beginning of the Federal Reserve's balance sheet normalization was expected to be limited.
Participants expressed a range of views about the appropriate timing of a change in reinvestment policy. Several preferred to announce a start to the process within a couple of months; in support of this approach, it was noted that the Committee's communications had helped prepare the public for such a step. However, some others emphasized that deferring the decision until later in the year would permit additional time to assess the outlook for economic activity and inflation. A few of these participants also suggested that a near-term change to reinvestment policy could be misinterpreted as signifying that the Committee had shifted toward a less gradual approach to overall policy normalization.
Several participants indicated that the reduction in policy accommodation arising from the commencement of balance sheet normalization was one basis for believing that, if economic conditions evolved broadly as anticipated, the target range for the federal funds rate would follow a less steep path than it otherwise would. However, some other participants suggested that they did not see the balance sheet normalization program as a factor likely to figure heavily in decisions about the target range for the federal funds rate. A few of these participants judged that the degree of additional policy firming that would result from the balance sheet normalization program was modest.
Participants generally reiterated their support for continuing a gradual approach to raising the federal funds rate. Several participants expressed confidence that a series of further increases in the federal funds rate in coming years, along the lines implied by the medians of the projections for the federal funds rate in the June SEP, would contribute to a stabilization, over the medium term, of the inflation rate around the Committee's 2 percent objective, especially as this tightening of monetary policy would affect the economy only with a lag and would start from a point at which policy was still accommodative. However, a few participants who supported an increase in the target range at the present meeting indicated that they were less comfortable with the degree of additional policy tightening through the end of 2018 implied by the June SEP median federal funds rate projections. These participants expressed concern that such a path of increases in the policy rate, while gradual, might prove inconsistent with a sustained return of inflation to 2 percent.
Several participants endorsed a policy approach, such as that embedded in many participants' projections, in which the unemployment rate would undershoot their current estimates of the longer-term normal rate for a sustained period. They noted that the longer-run normal rate of unemployment is difficult to measure and that recent evidence suggested resource pressures generated only modest responses of nominal wage growth and inflation. Against this backdrop, possible benefits cited by policymakers of a period of tight labor markets included a further rise in nominal wage growth that would bolster inflation expectations and help push the inflation rate closer to the Committee's 2 percent longer-run goal, as well as a stimulus to labor market participation and business fixed investment. It was also suggested that the symmetry of the Committee's inflation goal might be underscored if inflation modestly exceeded 2 percent for a time, as such an outcome would follow a long period in which inflation had undershot the 2 percent longer-term objective. Several participants expressed concern that a substantial and sustained unemployment undershooting might make the economy more likely to experience financial instability or could lead to a sharp rise in inflation that would require a rapid policy tightening that, in turn, could raise the risk of an economic downturn. However, other participants noted that if a sharp rise in inflation or inflation expectations did occur, the Committee could readily respond using conventional monetary policy tools. With regard to financial stability, one participant emphasized the importance of remaining vigilant about financial developments but observed that previous episodes of elevated financial imbalances and low unemployment had limited relevance for the present situation, as the current system of financial regulation was likely more robust than that prevailing before the financial crisis.
Committee Policy Action
In their discussion of monetary policy for the period ahead, members judged that information received since the Federal Open Market Committee met in May indicated that the labor market had continued to strengthen and that economic activity had been rising moderately so far this year. Job gains had moderated but had been solid, on average, since the beginning of the year, and the unemployment rate had declined. Household spending had picked up in recent months, and business fixed investment had continued to expand.
Inflation on a 12-month basis had declined recently and was running somewhat below 2 percent. The measure of inflation excluding food and energy prices was likewise running somewhat below 2 percent. Market-based measures of inflation compensation remained low; survey-based measures of longer-term inflation expectations had changed little on balance.
With respect to the economic outlook and its implications for monetary policy, members continued to expect that, with gradual adjustments in the stance of monetary policy, economic activity would expand at a moderate pace, and labor market conditions would strengthen somewhat further. Inflation on a 12-month basis was expected to remain somewhat below 2 percent in the near term, but almost all members expected it to stabilize around 2 percent over the medium term, although they were monitoring inflation developments closely. Members continued to judge that there was significant uncertainty about the effects of possible changes in fiscal and other government policies but that near-term risks to the economic outlook appeared roughly balanced, especially as risks related to foreign economic and financial developments had diminished.
After assessing current conditions and the outlook for economic activity, the labor market, and inflation, all but one member agreed to raise the target range for the federal funds rate to 1 to 1-1/4 percent. They noted that the stance of monetary policy remained accommodative, thereby supporting some further strengthening in labor market conditions and a sustained return to 2 percent inflation.
Members agreed that, in determining the timing and size of future adjustments to the target range for the federal funds rate, the Committee would assess realized and expected economic conditions relative to its objectives of maximum employment and 2 percent inflation. This assessment would take into account a wide range of information, including measures of labor market conditions, indicators of inflation pressures and inflation expectations, and readings on financial and international developments. Members also agreed that they would carefully monitor actual and expected developments in inflation in relation to the Committee's symmetric inflation goal. They expected that economic conditions would evolve in a manner that would warrant gradual increases in the federal funds rate, and they agreed that the federal funds rate was likely to remain, for some time, below levels that are expected to prevail in the longer run. However, the actual path of the federal funds rate would depend on the economic outlook as informed by incoming data.
The Committee also decided to maintain its existing policy of reinvesting principal payments from its holdings of agency debt and agency mortgage-backed securities in agency mortgage-backed securities and of rolling over maturing Treasury securities at auction. The Committee expected to begin implementing a balance sheet normalization program in 2017, provided that the economy evolves broadly as anticipated. This program, which would gradually reduce the Federal Reserve's securities holdings by decreasing reinvestment of principal payments from those securities, was described in an addendum to the Committee's Policy Normalization Principles and Plans to be released after this meeting.
At the conclusion of the discussion, the Committee voted to authorize and direct the Federal Reserve Bank of New York, until it was instructed otherwise, to execute transactions in the SOMA in accordance with the following domestic policy directive, to be released at 2:00 p.m.:
"Effective June 15, 2017, the Federal Open Market Committee directs the Desk to undertake open market operations as necessary to maintain the federal funds rate in a target range of 1 to 1-1/4 percent, including overnight reverse repurchase operations (and reverse repurchase operations with maturities of more than one day when necessary to accommodate weekend, holiday, or similar trading conventions) at an offering rate of 1.00 percent, in amounts limited only by the value of Treasury securities held outright in the System Open Market Account that are available for such operations and by a per-counterparty limit of $30 billion per day.
The Committee directs the Desk to continue rolling over maturing Treasury securities at auction and to continue reinvesting principal payments on all agency debt and agency mortgage-backed securities in agency mortgage-backed securities. The Committee also directs the Desk to engage in dollar roll and coupon swap transactions as necessary to facilitate settlement of the Federal Reserve's agency mortgage-backed securities transactions."
The vote also encompassed approval of the statement below to be released at 2:00 p.m.:
"Information received since the Federal Open Market Committee met in May indicates that the labor market has continued to strengthen and that economic activity has been rising moderately so far this year. Job gains have moderated but have been solid, on average, since the beginning of the year, and the unemployment rate has declined. Household spending has picked up in recent months, and business fixed investment has continued to expand. On a 12-month basis, inflation has declined recently and, like the measure excluding food and energy prices, is running somewhat below 2 percent. Market-based measures of inflation compensation remain low; survey-based measures of longer-term inflation expectations are little changed, on balance.
Consistent with its statutory mandate, the Committee seeks to foster maximum employment and price stability. The Committee continues to expect that, with gradual adjustments in the stance of monetary policy, economic activity will expand at a moderate pace, and labor market conditions will strengthen somewhat further. Inflation on a 12-month basis is expected to remain somewhat below 2 percent in the near term but to stabilize around the Committee's 2 percent objective over the medium term. Near-term risks to the economic outlook appear roughly balanced, but the Committee is monitoring inflation developments closely.
In view of realized and expected labor market conditions and inflation, the Committee decided to raise the target range for the federal funds rate to 1 to 1-1/4 percent. The stance of monetary policy remains accommodative, thereby supporting some further strengthening in labor market conditions and a sustained return to 2 percent inflation.
In determining the timing and size of future adjustments to the target range for the federal funds rate, the Committee will assess realized and expected economic conditions relative to its objectives of maximum employment and 2 percent inflation. This assessment will take into account a wide range of information, including measures of labor market conditions, indicators of inflation pressures and inflation expectations, and readings on financial and international developments. The Committee will carefully monitor actual and expected inflation developments relative to its symmetric inflation goal. The Committee expects that economic conditions will evolve in a manner that will warrant gradual increases in the federal funds rate; the federal funds rate is likely to remain, for some time, below levels that are expected to prevail in the longer run. However, the actual path of the federal funds rate will depend on the economic outlook as informed by incoming data.
The Committee is maintaining its existing policy of reinvesting principal payments from its holdings of agency debt and agency mortgage-backed securities in agency mortgage-backed securities and of rolling over maturing Treasury securities at auction. The Committee currently expects to begin implementing a balance sheet normalization program this year, provided that the economy evolves broadly as anticipated. This program, which would gradually reduce the Federal Reserve's securities holdings by decreasing reinvestment of principal payments from those securities, is described in the accompanying addendum to the Committee's Policy Normalization Principles and Plans."
Voting for this action: Janet L. Yellen, William C. Dudley, Lael Brainard, Charles L. Evans, Stanley Fischer, Patrick Harker, Robert S. Kaplan, and Jerome H. Powell.
Voting against this action: Neel Kashkari.
Mr. Kashkari dissented because he preferred to maintain the existing target range for the federal funds rate at this meeting. In his view, recent data, while suggesting that the labor market had improved further, had increased doubts about achievement of the Committee's 2 percent longer-run inflation objective and thus had not provided a compelling basis on which to firm monetary policy at this meeting. He preferred to await additional evidence that the recent decline in inflation was temporary and that inflation was moving toward the Committee's symmetric 2 percent inflation objective. He was concerned that raising the federal funds rate target range too soon increased the likelihood that inflation expectations would decline and that inflation would continue to run below 2 percent.
To support the Committee's decision to raise the target range for the federal funds rate, the Board of Governors voted unanimously to raise the interest rates on required and excess reserve balances 1/4 percentage point, to 1-1/4 percent, effective June 15, 2017. The Board of Governors also voted unanimously to approve a 1/4 percentage point increase in the primary credit rate (discount rate) to 1-3/4 percent, effective June 15, 2017.6
It was agreed that the next meeting of the Committee would be held on Tuesday-Wednesday, July 25-26, 2017. The meeting adjourned at 10:35 a.m. on June 14, 2017.
Notation Vote
By notation vote completed on May 23, 2017, the Committee unanimously approved the minutes of the Committee meeting held on May 2-3, 2017.
_____________________________
Brian F. Madigan
Secretary
1. The Federal Open Market Committee is referenced as the "FOMC" and the "Committee" in these minutes. Return to text
2. Attended through the discussion of System Open Market Account reinvestment policy. Return to text
3. Attended through the staff report on the economic and financial situation. Return to text
4. Four members of the Board of Governors, one fewer than in March 2017, were in office at the time of the June 2017 meeting and submitted economic projections. The office of the president of the Federal Reserve Bank of Richmond was vacant at the time of this FOMC meeting; First Vice President Mark L. Mullinix submitted economic projections. Return to text
5. One participant did not submit longer-run projections for real output growth, the unemployment rate, or the federal funds rate. Return to text
6. In taking this action, the Board approved requests submitted by the boards of directors of the Federal Reserve Banks of Boston, Philadelphia, Cleveland, Richmond, Atlanta, Chicago, Kansas City, Dallas, and San Francisco. This vote also encompassed approval by the Board of Governors of the establishment of a 1-3/4 percent primary credit rate by the remaining Federal Reserve Banks, effective on the later of June 15, 2017, and the date such Reserve Banks informed the Secretary of the Board of such a request. (Secretary's note: Subsequently, the Federal Reserve Banks of New York, St. Louis, and Minneapolis were informed by the Secretary of the Board of the Board's approval of their establishment of a primary credit rate of 1-3/4 percent, effective June 15, 2017.) The second vote of the Board also encompassed approval of the establishment of the interest rates for secondary and seasonal credit under the existing formulas for computing such rates. Return to text
North Korea Adds Tail Risk
The latest North Korean missile test and hostile words from the US in reaction raise the risk of a destabilizing surprise. The Swiss franc was the top performer Wednesday while the Canadian dollar lagged but the magnitude of the moves was small. Australian trade balance is up next. A new Premium trade has been issued with 4 supporting charts backing the trade.
United States ambassador to the UN Nikki Haley had strong words for North Korea on Wednesday. She said the latest missile test was a sharp escalation and that the US will use its military if it must and could go its own path.
Markets largely ignored the rhetoric but it's a clear escalation. US leaders are also increasingly pointing the finger at China as the enabler of North Korea. The latest tweet from Trump noted that trade between the countries grew 40% in Q1. 'So much for China working with us,' he wrote.
We don't think words – even harsher words – will rattle markets but the moment any actions are taken it will be a game changer. China has said that military must not be an option but if the US puts it in play it would threaten to rollback China-US relations and plunge South Korea into war. It would be a sharp retrenchment in risk assets and a flight to bonds.
In separate news, the FOMC minutes highlighted messages the Fed had already sent. Namely that most officials don't believe that the latest downtick in inflation is real or long-lasting. On bond purchases, they are undecided about whether to start the run-off in September or later.
Looking towards Asia-Pacific trading, the lone data point to watch is the 0130 GMT release of Australian trade balance for May. A surplus of A$1 billion is expected after a $555m surplus in April.
FOMC Minutes: Fed Likely To Announce Start Of QT In September
As expected, not much new in the FOMC minutes from the June meeting, as Yellen was quite clear during the press conference after the policy announcement and most FOMC members have expressed their views in speeches and/or interviews afterwards.
The most interesting part of the minutes was about the timing of the balance sheet run-off, as 'several preferred to announce a start to the process within a couple of months', if the economy evolves as expected. 'Some' want to wait until later in the year. Overall, it supports our view that the Fed can make an announcement in September and start actual run-off in Q4. Although the Fed recognises that the size of the balance sheet must be higher now than pre-crisis, as demand for central bank reserves has increased due to increasing financial regulation (see Research US: Fed's regulatory hurdle for starting quantitative tightening, 13 March), the risk remains that the Fed is too optimistic about how much it can shrink the balance sheet. That said, we still do not know what level of the balance sheet the Fed aims at.
With respect to inflation, the minutes say low inflation is likely 'transitory', in line with what Fed Chair Yellen said at the press conference. Fed still has faith in the Phillips curve, which says that the tighter labour market should push up wage growth eventually. The problem is that tightness of the labour market is not the only factor determining wage growth, as second-round effects from the many years with inflation below 2% have hit wage growth. When employees expect to remain low, they can live with low wage growth, as real wage growth may still be solid, see also Strategy: Central banks consider leaving the party, 30 June.
We expect the Fed to hike one more time this year in December due to the focus on the unemployment rate and easy financial conditions. Note, though, that four FOMC members signalled no further hikes this year in the updated projections in connection with the June meeting. By skipping September, the Fed can also get some more clarification about whether the low inflation prints in recent months were temporary or not. Instead, we expect an announcement on the balance sheet in September as written in the second bullet. We still think risks are skewed towards the Fed pausing its hiking cycle next year,
No Shortage of Drivers
No shortage of drivers leading to very aggressive price action overnight with US traders eager to re-engage after the holiday break.
Oil prices tanked with WTI plummeting from the $47 level to $45. However, we did see a significant bounce at the close with API data coming in a bit better than anticipated. No specific catalyst for the aggressive move lower but likely down to traders eager to re-engage post-holiday views with stop losses likely feeding the frenzy on the break of $46.level.
The FOMC minutes were perceived hawkish with US yields moving higher and USDJPY following suit. The Fed's verbal gymnastic surrounding inflation was rather pragmatic attributing the inflationary soft patch on idiosyncratic factors. They also made a note of systemic financial risk from elevated asset prices which supports the case for rate hike without data dependence. But with no consensus on the balance sheet runoff timing, investors USD appetite dwindled a touch heading into the Asia Trade However, the Feds acknowledgement to elevated asset prices will likely keep the dollar bears at bay as this view provides more fodder to the rate hike narrative.
Anticipating a reduction in short dollar positions after the hawkish FOMC minutes and as traders flatten out heading into Friday's NFP No risk reward on coin flips as there will be plenty of opportunities to express views post data
EURO
ECB member Coeuré's dovish comments have been weighing on investors sentiment as the EUR struggles to gain any traction above 1.1350. Coeuré's lean does question the current ECB hawkish narrative the markets have been running with, but he's likely doing little more than tapping the markets brakes after it's overzealous read on Draghi's Sintra comments when EU equities cratered.
Canadian Dollar
CAD predictably took its lumps as oil prices came off in early NY trade and continued to wobble at the beginning of Asia trading above 1.2960 level as US dollar remains firm in early trade. But with the BoC's July meeting next week and Governor Poloz confirming his hawkish view entering the official blackout ( no comment) period which begins on the week before the formal policy announcement it shouldn't run too far off course. But the oil price storyline and positions squaring remains the wild card factor in the absence of central bank guidance.
Australian Dollar
Weaker oil and a slightly stronger USD in early Asia has dented Aussie sentiment.However, it remains tentatively bid on dips despite the RBA failing to live up to the markets hawkish lean. While commodity currencies lead by USDCAD staying in favour and providing support for the Aussie the shifting oil price narrative does raise concerns.
Japanese Yen
The USDJPY is entirely correlated to moves on US fixed income but worth noting 30-year JGB's are trading at the highest level since late Feb
Canadian Dollar Lower After Fed Minutes Hint at Balance Sheet Reduction
The Canadian dollar depreciated on Wednesday versus the US dollar. The publication of the Federal Open Market Committee (FOMC) meeting two weeks after the Fed announced it was hiking rates gave the dollar some breathing room and helped the greenback recover from some of the weekly losses versus other major pairs.
Oil prices fell more than 4 percent ahead of the release of US crude inventories tomorrow at 11:00 am EDT. The price of energy had stringed together 8 winning sessions but that all came to an end with a stronger USD and reports of Organization of the Petroleum Exporting Countries (OPEC) production rising. The OPEC production cut deal with other producers has led to stability on oil prices, but the impact has been subdued thanks to the increase in US production. If OPEC members Nigeria and Libya who are exempt from the terms of the agreement are increasing output to recover from earlier disruptions.
The Canadian economic calendar was light on Wednesday with traders looking ahead to tomorrow's trade balance and building permits both to be released at 8:30 am EDT. The Canadian indicators could get lost in the shuffle with the start of the US employment data deluge. The ADP non-farm report at 8:15 am EDT and unemployment claims at 8:30 am EDT. Non manufacturing PMI in the US will be published at 10:00 am EDT and the Energy Information Administration (EIA) will release the weekly crude inventories at 11:00 am EDT.

The USD/CAD gained 0.264 percent in the last 24 hours. The currency pair is trading at 1.2972 after the Fed meeting minutes highlighted the central bank's commitment to keep tightening monetary policy. The loonie lost on a daily basis, but continues to be ahead of the USD in the last five days. The hawkish rhetoric from the Bank of Canada (BoC) put a rate move in July as a definite possibility taking the USD/CAD pair below the 1.30 price level. How much lower the pair can go depends on US employment with private payrolls due on Thursday and then the biggest indicator in the market the U.S. non farm payrolls (NFP) to be delivered on Friday, July 8 at 8:30 am EDT.
The Fed FOMC minutes did not shed any new light on the topics under discussion within the central bank. Fed speakers have been divided on the issues of inflation and the interest rate hike path which were highlighted in the notes from the last monetary policy meeting. The vote on that meeting was for the second rate hike in 2017. There is also now more details on the Fed's plans for its reduction of the balance sheet it accumulated during the lifespan of the quantitative easing program. The only question mark that remains is when will it start to shrink. The takeaway from the FOMC minutes is "within months" which leaves both the September and December FOMC meetings as heavy candidates. If the Fed decides to hike rates for a final time in 2017 it could decide either to split the announcements between the two meetings with September being the kickoff of balance sheet reduction and December reserved for a rate hike announcement.
CAD traders will be on the lookout for employment releases out of the US as the dollar found little support from the Fed minutes, but could turn around if the inflation component of the private and public job reports show signs of wage growth. Canadian jobs are expected to have risen by more than 11,000 positions following the massive gain of 54,500 last month and could support the CAD against the USD ahead of the Bank of Canada (BoC) monetary policy meeting on July 12.
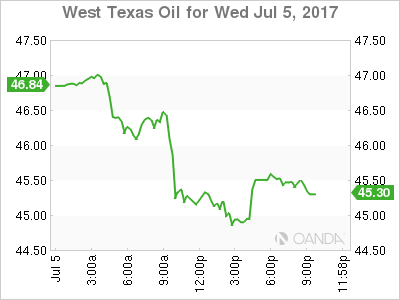
Oil dropped 4.226 percent on Wednesday. The price of West Texas Intermediate is trading at $44.94 ahead of Thursday's release of crude inventory data. The price of oil has been caught between the OPEC cut agreement and ramping production from other producers. Russia signed on to the OPEC deal but according to some officials they will not push for deeper cuts in the upcoming meeting. US producers have slowed down the number of oil rigs that are back online, but as price stays or rises from current levels the ramp up will continue putting pressure on the OPEC leadership.
The weekly API oil inventories showed a large drawdown of 5.8 million barrels of crude and -5.7 million barrels of gasoline with a small buildup of 0.4 in distillates giving a late Wednesday session boost to crude ahead of the government's official data to be released tomorrow at 11:00 am EDT.
Market events to watch this week:
Thursday, July 6
- 8:15 am USD ADP Non-Farm Employment Change
- 8:30 am CAD Trade Balance
- 8:30 am USD Unemployment Claims
- 10:00 am USD ISM Non-Manufacturing PMI
- 11:00 am USD Crude Oil Inventories
Friday, July 7
- 4:30 am GBP Manufacturing Production m/m
- 8:30 am CAD Employment Change
- 8:30 am CAD Unemployment Rate
- 8:30 am USD Average Hourly Earnings m/m
- 8:30 am USD Non-Farm Employment Change
*All times EDT
FOMC Members Divided over Balance Sheet Reduction Schedule
The FOMC minutes for the June meeting unveiled that members were divided over the timing of balance sheet reduction while there was also discussion over the recent inflation weakness. At the meeting, the Fed raised its policy rate, by +25 bps, to a target range of 1-1.25%.Given the fact that the economic and medium-term inflation outlooks was largely unchanged since May, members generally judged that it was appropriate to adopt the continued removal of monetary policy accommodation. The rate hike decision was not unanimous. Minneapolis Fed president Neel Kashkari dissented as he preferred to keep the policy rate unchanged until inflation was "actually moving toward the 2% longer-run objective". Meanwhile, "a few" members who voted in favor of a rate hike in June indicated that "they were less comfortable with the degree of additional policy tightening through the end of 2018 implied by the June SEP median federal funds rate projections" (i.e. three rate hike as suggested at the June SEP). These participants noted that "such a path of increases in the policy rate, while gradual, might prove inconsistent with a sustained return of inflation to +2%".
The minutes reflected the division among members regarding the timing of balance sheet reduction as well as how it would affect the path of interest rate hike. While "several preferred to announce a start to the process within a couple of months", "some others emphasized that deferring the decision until later in the year would permit additional time to assess the outlook for economic activity and inflation". Concerning the interaction with the monetary policy, the minutes revealed that "several participants indicated that the reduction in policy accommodation arising from the commencement of balance sheet normalization was one basis for believing that, if economic conditions evolved broadly as anticipated, the target range for the federal funds rate would follow a less steep path than it otherwise would". Yet, "some other participants suggested that they did not see the balance sheet normalization program as a factor likely to figure heavily in decisions about the target range for the federal funds rate". Some members holding the latter view "judged that the degree of additional policy firming that would result from the balance sheet normalization program was modest".
The members also debated over the appropriate response to the tightening employment market. The minutes revealed that "several participants endorsed a policy approach" where the employment market would fall below the estimated NAIRU for a sustained period, while some others "expressed concern that a substantial and sustained unemployment undershooting might make the economy more likely to experience financial instability or could lead to a sharp rise in inflation".
Recently, both headline and core readings of inflation came in lower-than-expected. Regarding this, most members viewed the weakness as "largely reflecting idiosyncratic factors, including sharp declines in prices of wireless telephone services and prescription drugs. They expected these developments as transitory and having "little bearing on inflation over the medium run". The members retained the view that, as "the effects of transitory factors waned and labor market conditions strengthened further, inflation would stabilize around the Committee's +2% objective over the medium term". Yet, "several" members raised concerns that progress toward the Committee's +2% longer-run inflation objective might have "slowed and that the recent softness in inflation might persist". They believed that limited upward pressure on inflation from resource utilization might have been a reason causing the softness. There were also "a couple" of members raising the concern that "a tighter relationship between inflation and resource utilization could reemerge if the unemployment rate ran significantly below its longer-run normal level, which could result in inflation running persistently above the Committee's +2% objective".
The minutes unveiled that the Fed still lacked consensus over the balance sheet reduction schedule. Therefore, it would be very unlikely to begin in September though some members suggested it could begin in as soon as a few months. Should the economic activities and the job market maintain the current pace of improvement, we maintain the view that the Fed would announce a more detailed plan (schedule and mechanism, etc.) on balance sheet reduction in September while a +25 bps rate hike would be adopted in December.
FOMC Debated Inflation Weakness in June, Divided on Timing of Balance Sheet Normalization
The minutes from the June meeting where it opted to raise rates a quarter point showed that Federal Open Market Committee participants generally saw the outlook for economic activity and the medium-term outlook for inflation as little changed since May. Therefore, it viewed a continued removal of monetary policy accommodation as being appropriate.
In light of surprisingly low recent readings on inflation, participants expected that inflation on a 12-month basis would remain somewhat below 2 percent in the near term. Most participants viewed the recent softness in price data as largely reflecting idiosyncratic factors including sharp price declines for wireless phone services and prescription drugs. As these transitory impacts wane and the labor market strengthens further, participants expect that inflation would stabilize around the Committee's 2% objective over the medium term.
Unsurprisingly, views on inflation were mixed. "Several" participants pointed to recent increases in import prices as consistent with inflation stabilizing around 2% over the medium term. While "several" others expressed concern that progress towards the 2% objective has slowed, and that the recent softness in inflation might persist. But, overall near-term risks to the economic outlook were viewed as roughly balanced, and that the Committee should continue to monitor inflation developments closely.
One member (likely Kashkari, who dissented on the rate hike) did prefer to keep the fed funds rate unchanged until inflation was actually moving toward the 2% longer-run objective. Also, a few participants who supported the increase in the funds rate in June indicated they were less comfortable with the degree of additional tightening in 2018 (currently 3 hikes in June's SEP), worried that it is inconsistent with a sustained return to the 2% inflation target.
On the plus side, a number of participants cited that improved prospects for foreign economic growth meant risks to the U.S. economic outlook from overseas had diminished in the intermeeting period. Moreover, job gains were viewed as having moderated, but had been solid on average, household spending had picked up, and business fixed investment had continued to expand.
On business investment, contacts in many districts remained optimistic about business prospects, supported in part by improved global conditions. However, that optimism appears to have abated somewhat in part due to diminished prospects for fiscal stimulus. Notably some large firms had curtailed capital spending due to uncertainty about changes in fiscal policy.
The Committee expected to begin implementing its balance sheet normalization plan in 2017, but there were a range of views on exact timing. Several participants preferred to announce the start of reducing reinvestments within a couple of months (meaning the July or September meeting), while others preferred to wait until later in the year in order to assess the economic outlook and inflation developments.
The Fed had outlined its plan to gradually reduce its holdings by tapering reinvestments in its Treasury and MBS portfolio in June along with its statement. The Fed expects to cap runoff at $10 billion per month initially ($6bn for UST/$4bn for MBS) before raising it to $50bn per month within a year, with the same 60/40 split between UST and MBS. The implications of this are discussed in TD's recent report.
Key Implications
For now the consensus view among FOMC participants is that while near-term inflation would remain somewhat below 2% due to idiosyncratic factors, the economic outlook for moderate growth and labor market tightening is expected to see it stabilize around the 2% objective over the medium term. However, it is clear three months of soft inflation readings have members concerned, with some questioning whether three quarter point hikes in 2018 are necessary given weakness in the recent data. As outlined in our latest forecast, the risks are skewed to two hikes in 2018, rather than our baseline expectation of three.
The minutes didn't clear up the precise timing on when in 2017 the Fed would start adjusting its reinvestment policy, with members divided on the precise timing. However, with only half a year left the possible options are limited. TD Economics expects that as long as the economy progresses as expected, the Fed is likely to start the process in the fall, and then raise rates another quarter point in December.
Pound Ticks Lower as UK Construction PMI Slips
GBP/USD has recorded small losses in the Wednesday session. In North American trade, the pair is trading at 1.2920. On the release front, British Services PMI posted a reading of 53.4, shy of the forecast of 53.6. Later in the day, the Federal Reserve releases the minutes of its June policy meeting. On Thursday, the US releases three key indicators – ADP Nonfarm Payrolls, unemployment claims, and the ISM Non-Manufacturing PMI.
This week's British PMI reports are raising concerns, as all three PMIs pointed to slower growth in June. The PMIs gauge the strength in the manufacturing, construction and services sectors, and all three reports pointed to expansion, but at a weaker pace than in May. The double whammy of the British election and the start of Brexit talks with Europe have increased uncertainty and resulted in a decrease in new orders across the economy, has underscored by the softer PMI readings. Weaker economic conditions will compound the difficult situation of the BoE with regard to interest rate policy – the economy may not be ready for a rate hike, but inflation, which is running at a 3% clip, is also hurting the economy and is above the BoE's target of 2%. BoE policymakers have not hesitated to air their differences in public, with BoE Governor Mark Carney at odds with MPC member Ande Haldane at others regarding raising rates. Just a few weeks ago, Carney appeared adamantly opposed to raising rates, but he has since softened his approach, and this triggered a strong pound rally last week, as the currency briefly punched above the 1.30 level.
The Federal Reserve will be back in the spotlight on Wednesday, with the release of the minutes from the June meeting. Federal Reserve policymakers have consistently projected one final rate hike in 2017, but the markets remain skeptical. The odds of a December rate hike are pegged at only 50%, while the likelihood of an increase in September is just 18%. The US economy slowed down in the first quarter, and there are signs that Q2 will also be soft. Consumer spending, which comprises two-thirds of US economic growth, remains soft. Another sore point in the economy is inflation, which remains below the Fed's target of 2%. In June, Fed Chair Janet Yellen shrugged off inflation worries, saying that she expected inflation to remain soft due to temporary factors. The dollar was broadly higher after the June rate statement, as Fed policymakers were surprisingly upbeat about the economy and dismissed concerns about low inflation levels. Traders should keep a close eye on the minutes, which could be a market-mover. Will the Fed minutes present a positive view of the US economy? If yes, the dollar could respond with gains.
Yen Dips Ahead of FOMC Minutes
USD/JPY has posted gains on Wednesday. In the North American session, the pair is trading at 113.20. On the release front, US Factory Orders declined 0.8%, missing the forecast of -0.5%. Later in the day, the Federal Reserve releases the minutes of its June policy meeting. There are no major Japanese events on the schedule. On Thursday, the US releases three key indicators – ADP Nonfarm Payrolls, unemployment claims, and the ISM Non-Manufacturing PMI.
Bank of Japan policymakers have reason to smile, as the economy has rebounded in 2017. A stronger global economy has boosted exports and revived the manufacturing sector. Consumers and businesses are spending more, and GDP expanded at an annualized rate of 1.0% in the first quarter. The fly in the ointment? Inflation is stuck below 1 percent, well below the BoJ's target of 2 percent. Tokyo Core CPI, the primary gauge of consumer inflation, edged down to 0.0%, below the estimate of 0.2%. The BOJ has implemented a radical accommodative monetary policy, but inflation levels remain well below the BOJ's target of 2.0%. After a fruitless battle to raise inflation, the BoJ appears ready to raise a white flag (of sorts) and lower its inflation target when policymakers gather for a rate meeting on July 20. It remains to be seen to what extent the bank lowers the bar, but traders should be prepared for some volatility from the yen if the BoJ does adjust its inflation target.
Federal Reserve policymakers have consistently projected one final rate hike in 2017, but the markets remain skeptical. The odds of a December rate hike are pegged at only 50%, while the likelihood of an increase in September is just 18%. The US economy slowed down in the first quarter, and there are signs that Q2 will also be soft. Consumer spending, which comprises two-thirds of US economic growth, remains soft. Another sore point in the economy is inflation, which remains below the Fed's target of 2%. In June, Fed Chair Janet Yellen shrugged off inflation worries, saying that she expected inflation to remain soft due to temporary factors. The dollar was broadly higher after the June rate statement, as Fed policymakers were surprisingly upbeat about the economy and dismissed concerns about low inflation levels. Traders should keep a close eye on the minutes, which could be a market-mover. Will the Fed minutes present a positive view of the US economy? If yes, the dollar could respond with gains.