
Sample Category Title
Trade Idea Wrap-up: USD/CHF – Buy at 0.9600
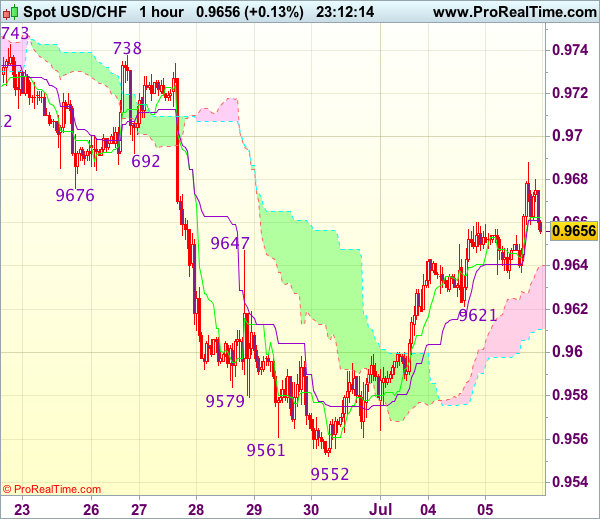
USD/CHF - 0.9654
Most recent candlesticks pattern : N/A
Trend : Near term down
Tenkan-Sen level : 0.9663
Kijun-Sen level : 0.9661
Ichimoku cloud top : 0.9640
Ichimoku cloud bottom : 0.9611
Original strategy :
Buy at 0.9600, Target: 0.9700, Stop: 0.9565
Position : -
Target : -
Stop : -
New strategy :
Buy at 0.9600, Target: 0.9700, Stop: 0.9565
Position : -
Target : -
Stop : -
As the greenback surged again earlier today after staging a strong rebound from 0.9552 (last week’s low), retaining our view that a temporary low has been formed there and consolidation with mild upside bias is seen for this move to bring retracement of recent decline, hence gain to 0.9690-00 is likely, however, reckon upside would be limited and price should falter below resistance area at 0.9738-43, bring retreat later.
In view of this, would not chase this rise here and we are looking to buy dollar on pullback as 0.9600 should limit downside and bring another rise later. Below 0.9565-70 would abort and signal intra-day top is formed, risk retest of 0.9552 first.
Trade Idea Wrap-up: GBP/USD – Buy at 1.2865
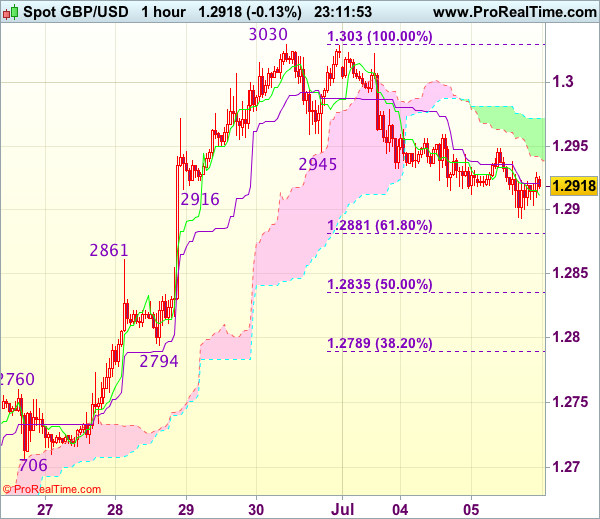
GBP/USD - 1.2912
Most recent candlesticks pattern : N/A
Trend : Near term up
Tenkan-Sen level : 1.2911
Kijun-Sen level : 1.2921
Ichimoku cloud top : 1.2972
Ichimoku cloud bottom : 1.2942
Original strategy :
Buy at 1.2865, Target: 1.3000, Stop: 1.2830
Position : -
Target : -
Stop : -
New strategy :
Buy at 1.2865, Target: 1.3000, Stop: 1.2830
Position : -
Target : -
Stop : -
Although the British pound has remained under near term downward pressure and initial downside risk remains for the corrective fall from 1.3030 (last week’s high) to bring retracement of recent upmove to 1.2880-85 (38.2% Fibonacci retracement of 1.2640-1.3030), reckon downside would be limited to 1.2865-70 and bring another upmove later, above 1.2960 would signal low is formed, bring rebound to 1.3000 but break of said resistance at 1.3030 is needed to signal recent upmove has resumed and extend further gain towards recent high 1.3048.
In view of this, we are looking to buy cable again on further corrective fall as previous resistance at 1.2861 should turn into support and contain downside, bring another rise. Below 1.2830-35 (50% Fibonacci retracement of 1.2640-1.3030) would abort and signal top is formed, bring further fall towards support at 1.2794.
Trade Idea Wrap-up: EUR/USD – Buy at 1.1290
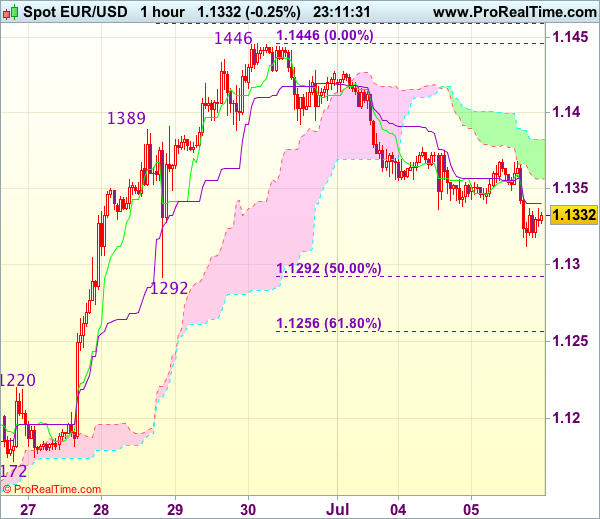
EUR/USD - 1.1333
Most recent candlesticks pattern : N/A
Trend : Near term up
Tenkan-Sen level : 1.1340
Kijun-Sen level : 1.1341
Ichimoku cloud top : 1.1382
Ichimoku cloud bottom : 1.1356
Original strategy :
Buy at 1.1290, Target: 1.1390, Stop: 1.1255
Position : -
Target : -
Stop : -
New strategy :
Buy at 1.1290, Target: 1.1390, Stop: 1.1255
Position : -
Target : -
Stop : -
As the single currency has slipped again after brief recovery, suggesting near term downside risk remains for the fall from 1.1446 (last week’s high) to bring retracement of recent upmove, hence weakness to 1.1292 (previous support as well as 50% Fibonacci retracement of 1.1139-1.1446) cannot be ruled out, however, reckon sharp fall below there should not be repeated today and bring rebound later, above 1.1375-80 would signal an intra-day low is formed, bring test of 1.1400-10, break there would suggest the pullback from 1.1446 has ended, then retest of this resistance would follow.
In view of this, we are inclined to buy euro on further corrective fall as 1.1292 (previous support as well as 50% Fibonacci retracement of 1.1139-1.1446) should limit downside, bring rebound. Below 1.1270 would abort and signal a temporary top is formed, bring correction to 1.1250-55 (61.8% Fibonacci retracement) first.
Trade Idea Wrap-up: USD/JPY – Stand aside
USD/JPY - 113.25
Most recent candlesticks pattern : N/A
Trend : Near term up
Tenkan-Sen level : 113.39
Kijun-Sen level : 113.26
Ichimoku cloud top : 113.06
Ichimoku cloud bottom : 112.67
Original strategy :
Buy at 112.85, Target: 113.85, Stop: 112.50
Position : -
Target : -
Stop : -
New strategy :
Stand aside
Position : -
Target : -
Stop : -
Despite intra-day resumption of upmove to 113.69, lack of follow through buying and the subsequent retreat suggest consolidation below this level would be seen and weakness to 113.00 is likely, however, break of support at 112.74 is needed to signal top has been formed there, bring retracement of recent rise to 112.40-45, then 112.20 but reckon 111.95-00 would hold from here.
In view of this, would not chase this rise here and would be prudent to stand aside for now. Above said resistance at 113.69 would signal recent upmove is still in progress and may extend further gain to 114.00 but loss of momentum should prevent sharp move beyond 114.25-30.

Dollar Continues Rally ahead of Fed Minutes and Friday’s Jobs Report; Oil Plummets
The US dollar put in a strong performance in post-July 4th trading ahead of key data releases tomorrow and Friday and as traders eagerly expected the minutes from the latest Fed meeting.
Euro/dollar dropped to as low as 1.1311 during Wednesday's European trading while dollar/yen rose to as high as 113.67 in a broad move higher for the greenback. The dollar index reached a 1-week high of 96.23 and thereby recovered some of the losses it suffered the previous week. Buying of the dollar was in anticipation of strong data to come later in the week and particularly the June employment report.
In economic news, US factory orders for May disappointed by dropping 0.8% month-on-month instead of the 0.5% fall expected by analysts. The previous month's contraction was revised down to -0.3% from -0.2% initially reported.
Earlier in the day, there was a flurry of European services purchasing managers indices (PMIs). The final June services number for the Eurozone was revised higher to 55.4 from the preliminary 54.7 print. In the UK, the services PMI came in at 53.4; close to the forecast of 53.5 made by analysts but down from the previous month's 53.8 figure. Pound/dollar briefly dipped below 1.29 to 1.2892 but managed to climb above that level later and was last trading at 1.2913.
In commodities, oil dropped sharply to below $46 a barrel at $45.60, from above $47 during the previous day's trading. News that Russia did not favor even more production cuts to support the price seemed to weigh on the commodity. The release of US energy inventories was delayed by a day due to the 4th of July holiday and will take place on Thursday. Gold traded as low as $1217 an ounce, which was a fresh 1 ½ month low. Gold was last at $1221.
Looking ahead, forex traders will be eagerly expecting the minutes from the June 13/14 Fed meeting, when the benchmark target rate was hiked by 0.25% to 1-1.25%. The minutes are expected to show how the discussion inside the committee went, as well as maybe reveal some of the deliberations that concern the details of the plan to gradually the Fed's huge balance sheet.
Dollar Drifting Cautiously Higher
- Stock markets in Asia and Europe rode out the latest rise in tensions around North Korea and are showing small gains. The dollar firmed today and US equities opened little changed as attention turns to the minutes from the US June Fed meeting.
- The revision of the Eurozone services PMI for June surprised on the upside. The flash reading of 54.7 was revised up to 55.4. This brings the final PMI closer to the May figure of 56.3. The composite PMI went from 56.8 in May to 56.3 in June (flash at 55.7). For Q2, the average composite PMI was 56.6. This is the best outcome since Q1 2011.
- The UK services PMI slipped to 53.4 in June from May's 53.8. That was broadly as expected but takes the index to its lowest since February. Business expectations saw a sharper fall, pointing to growing pessimism about the outlook as higher inflation is biting and Brexit uncertainties loom.
- The Eurozone retail sales for May came in bang on consensus at 0.4% M/M. In Y/Y-terms, retails sales rose 2.6% above the 2.3% consensus and the 2.5% April reading. Automotive fuel (+1.7% M/M) saw the biggest volume increases.
- A Saudi-led bloc of nations isolating Qatar are meeting to discuss how to go forward as their deadline for Qatari compliance with a list of tough demands expires. Additional punitive measures may emerge from the meeting.
- Markets are awaiting the publication of the US minutes later today which could give clues on when the Fed balance-sheet runoff could start and what the sequencing would be. Another topic is the level of concern among officials over financial stability after several, including Yellen, spoke out about high asset prices
Rates
Calm temporarily interrupted by stronger EMU PMI's
Boring sideway trading with a shy fourth attempt of the Bund to attack key support. It was a waiting game on the FOMC Minutes later today and labour market data tomorrow and Friday. German bonds started little changed but went for another test of key support at 161.68/58 when EMU June countries' services PMI's were unexpectedly revised substantially higher, halving the earlier reported decline (see headlines). However, the support proved too strong, given the information value of the revised figures and ahead of the more important US data on Thursday and Friday. The Bund rebounded in two steps to opening levels at noon. After this, the Bund hovered listless near these levels, before falling slightly lower once more. The German 5-yr OBL auction, as usual, drew little interest (see below), and didn't affect trading either. US Treasuries showed even less volatility and traded close to opening levels.
At the time of writing, the German yield curve had shifted marginally higher by about 1 bp. A benchmark change in the 5-yr distorted the picture. The US curve showed even less variation notably between flat and -0.4 bp. Similar lacklustre trading happened in the intra-EMU markets with 10-yr yield spreads remaining virtually unchanged.
Germany sold €3.22B of its new 0% October 2022 at an average yield of -0.14%. The Bundesbank retained €780M for its market regulation. Total bids amounted to €4.518B, which resulted in a real bid/cover of a meagre 1.1. The auction tailed 1 eurocent. That was close to the average of past auctions though. The Bundesbank retention of 19.5% was also near recent retained percentages.
Currencies
Dollar drifting cautiously higher
The dollar followed the trading pattern of previous days. The US currency enjoyed a cautious bid as investors awaited the Minutes of the June Fed meeting (this evening) and the key US data later this week. Strong EMU data again failed to support the euro. EUR/USD drifted further south and trades in the 1.1320 area. USD/JPY is trending higher in the 113 big figure.
Overnight, Asian equities took again a hesitant start due to lingering geopolitical tensions on North Korea, but market sentiment improved throughout the session. USD/JPY dropped temporary to the 112.83 area, but traded again north of 113 going into the start of the European session. In technical trade, EUR/USD traded marginally stronger at 1.1350/60.
European equities didn't find a clear direction and finally settled in a sideways range close to, mostly marginally above yesterday's close. The EMU services PMI's showed a remarkably big upward surprise (see headlines). European yields tried a shy attempted to go higher, but the move faded fast and didn't help the euro. On the contrary, the dollar soon resumed the gradual uptrend. ECB's Coeuré commented a report on the international use of the euro in 2016. He indicated that the role of the euro as reserve currency could strengthen. At the same time, he downplayed recent moves/volatility of the euro. He also said the ECB had not discussed changes in monetary policy. The comments maybe slightly accelerated the decline of the euro. Even so, dollar strength still prevailed. EUR/USD drifted to the 1.1315 area. USD/JPY filled offers in the 113.65/70 area.
There were no early morning US data and the factory orders, which are published at 16.00 CET, are no market mover. US trading took a slow start after the 4th of July holiday. The dollar rebound slowed as investors await the FED Minutes this evening and, even more the US data tomorrow and on Friday. The dollar maintained its recent gains, but the rally slowed. EUR/USD trades in the 1.1325 area. USD/JPY hovers just north of 113.50. Will hints in the Minutes from the Fed on the balance sheet reduction allow the dollar to extend its rebound?
Few UK drivers for sterling trading
The UK services PMI eased slightly more than expected from 53.8 to 53.4 (53.5), but the deviation from consensus was too small to really affect sterling trading. As was the case earlier this week, EUR/GBP and cable trading was technical in nature or driven by the broader trends in the euro or the dollar. The gradual USD rebound pushed cable to the low 1.29 area. (currently 1.5 area). BoE Saunders warned households should prepare for interest rates to go higher. However, his assessment also brought little news for markets as he already voted for a rate hike last month.
Elliott Wave Analysis: GBPJPY Missing One More Leg Higher; Maybe Bulls Will Slowdown
GBPJPY is clearly bullish and may still be for a little while, as we see current price activity as part of red wave v). Ideally correction in red wave iv) had already ended, which means one more push higher can come in play. Hopefully we will see red wave v) extend towards the 148.08 region, where Fibonacci measurement of 100.0 would equal the first and current fifth wave. From there a new three wave pullback can come in play.
GBPJPY, 1H
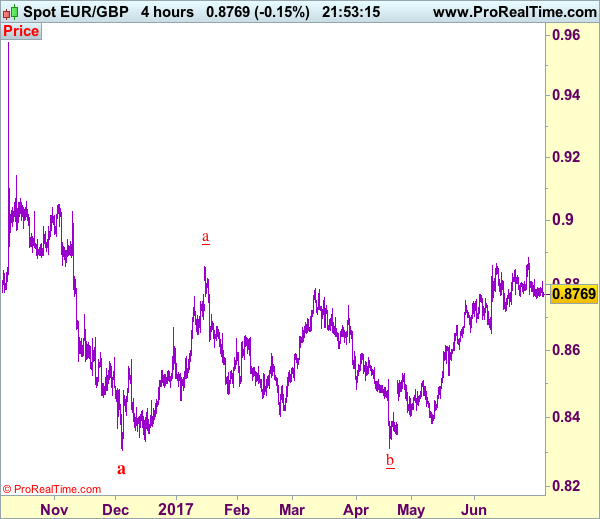
Trade Idea: EUR/GBP – Stand aside
EUR/GBP - 0.8773
Recent wave: Major double three (A)-(B)-(C)-(X)-(A)-(B)-(C) is unfolding and 2nd (A) has possibly ended at 0.6936.
Trend: Near term up
New strategy :
Stand aside
Position : -
Target : -
Stop : -
Despite last week’s brief rise to 0.8882, the subsequent retreat has retained our view that a temporary top is possibly formed there and few days of consolidation would be seen with mild downside bias, below 0.9755-60 would add credence to this view, bring retracement of recent upmove to 0.8730-35, however, still reckon downside would be limited to 0.8719 support.
In view of this, would be prudent to stand aside for now and look to turn short on recovery as 0.8840-50 should limit upside. Above 0.8882 would revive bullishness and extend recent upmove from 0.8304 low to 0.8900-10, having said that, as broad outlook remains consolidative, reckon current c leg of larger degree wave b should be limited to 0.8950 and price should falter well below 0.9000 psychological level.
Our preferred count is that, after forming a major top at 0.9805 (wave V), (A)-(B)-(C) correction is unfolding with (A) leg ended at 0.8400 (A: 0.8637, B: 0.9491 and 5-waver C ended at 0.8400. Wave (B) has ended at 0.9413 and impulsive wave (C) has either ended at 0.8067 or may extend one more fall to 0.8000 before prospect of another rally. Current breach of indicated resistance at 0.9043 confirms our view that the (C) leg has ended and bring stronger rebound towards 0.9150/54, then towards 0.9240/50.
Trade Idea: USD/CAD – Sell at 1.3115
USD/CAD - 1.2983
Recent wave: Only wave v of c has ended at 0.9407 and wave C of major A-B-C correction is underway for headway to 1.4700
Trend: Near term down
Original strategy :
Sell at 1.3115, Target: 1.2915, Stop: 1.3175
Position: -
Target: -
Stop: -
New strategy :
Sell at 1.3115, Target: 1.2915, Stop: 1.3175
Position: -
Target: -
Stop:-
As the greenback has rebounded after brief fall to 1.2912, suggesting at least a minor wave iii trough was formed there, hence consolidation with initial upside bias is seen for test of resistance at 1.3015, break there would add credence to this view, bring retracement of recent decline to 1.3075-80, however, reckon 1.3115-20 would limit upside and bring another decline later, below support at 1.2912 would extend the fall from 1.3794 top (wave c of larger degree wave b top) to 1.2895-00 but loss of momentum should limit downside to 1.2870 and reckon 1.2850 would hold from here.
In view of this, would not chase this fall here and would be prudent to sell the pair again on recovery as 1.3115-20 should limit upside. Above 1.3160-70 would defer and suggest low is formed, bring a stronger rebound to 1.3215-20 and possibly towards 1.3260-65 but only break there would abort and signal a temporary low is formed instead, then test of resistance at 1.3308 would follow.
To recap, wave B from 1.3066 is unfolding as an a-b-c and is sub-divided as a: 1.2192, b: 1.2716 and wave c is a 5-waver with i: 1.1983, ii: 1.2506, extended wave iii with minor iii at 1.0206, wave iv ended at 1.0781 and wave v as well as wave iii has ended at 0.9931, hence the subsequent choppy trading is the wave iv which is unfolding as (a)-(b)-(c) with (a) leg of iv ended at 1.0854, followed by (b) leg at 1.0108 and (c) leg as well as the wave iv ended at 1.0674. The wave v is sub-divided by minor wave (i): 0.9980, (ii): 1.0374, (iii): 0.9446, (iv): 0.9913 and (v) as well as v has possibly ended at 0.9407, therefore, consolidation with upside bias is seen for major correction, indicated target at 1.3700 and 1.4000 had been met and further gain to 1.4700 would be seen later.

CAC Steady on Strong French Services PMI
The CAC index is showing little movement on a Wednesday session. In North American trade, the index is currently trading at 5185.15 and is down 0.19% on the day. On the release front, French and Eurozone Services PMIs in June both beat their estimates, but were weaker than the May reports. In the US, the Federal Reserve will release the minutes of the June policy meeting.
There was positive news from the euro-area, as French and Eurozone Final Services PMIs continue to point to expansion. Eurozone Final Services PMI came in at 55.4, easily beating the forecast of 54.7. French Final Services PMI posted a reading of 56.9, easily beating the estimate of 55.3 points. Still, both PMIs lost ground in June, compared to the May reports. This could worry the markets and weigh on European stock exchanges. In France, the CAC has stabilized after a poor performance last week, as the index dropped 3.3%. The catalyst for the plunge was the market reaction to Mario Draghi's comments at the ECB forum, with expectations climbing that the ECB was close to exiting its stimulus package. The ECB tried to dampen the speculation after the stampede to snap up euros, but the currency nonetheless posted sharp gains. Investors soured on the stock markets, as a winding down of the stimulus program would signal an end to the "easy money" that has helped fuel record levels for European stock markets.
Last week's "Draghi rally"caught the ECB by surprise, and may force the bank to reassess what moves, if any, it will announce at the July 20 policy meeting. In June, the ECB removed an easing bias regarding interest rates, effectively closing the door to further rate cuts. However, policymakers may now be wary about removing a second easing bias regarding the asset-purchase program, to avoid another run on the euro. The ECB has repeated loud and clear that it will not remove QE until inflation levels are closer to the bank's target of 2.0%, but the markets chose to interpret Draghi's comments as a signal that the bank was planning an exit from its easing stance. This could result in the ECB playing it safe and avoid any announcements about any bias removal at the July meeting, especially if the euro remains at high levels.
Federal Reserve policymakers have consistently projected one final rate hike in 2017, but the markets are not biting just yet. The odds of a December rate hike are pegged at only 50%, while the likelihood of an increase in September is just 18%. Consumer spending, which comprises two-thirds of US economic growth, remains soft. Another sore point in the economy is inflation, which remains below the Fed's target of 2%. In June, Fed Chair Janet Yellen shrugged off inflation worries, saying that she expected inflation to remain soft due to temporary factors. The dollar was broadly higher after the June rate statement, as Fed policymakers were surprisingly upbeat about the economy and dismissed concerns about low inflation levels. Traders should keep a close eye on the minutes, which could be a market-mover. Will the Fed minutes present a positive view of the US economy? If so, stock markets could respond with gains.