Sample Category Title
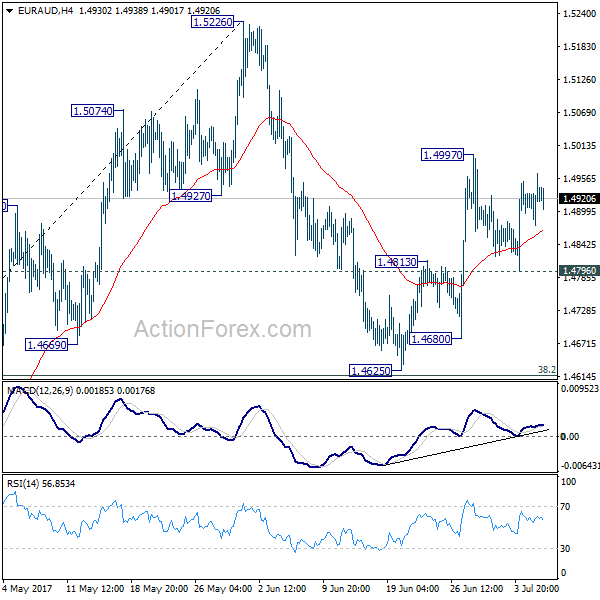
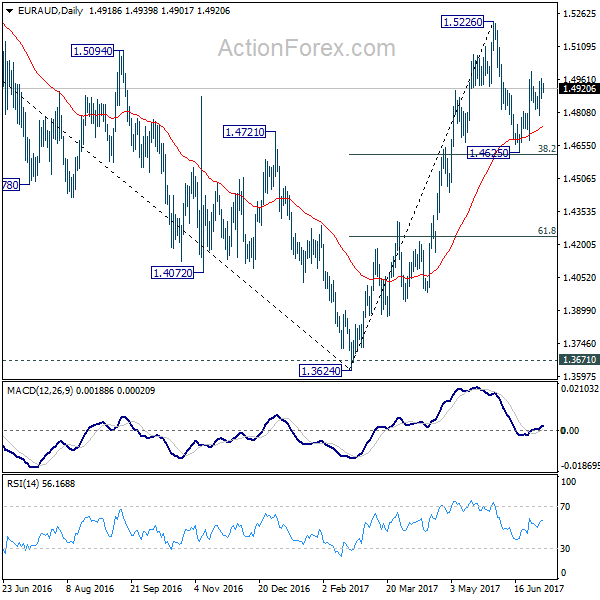
EUR/AUD Daily Outlook
Daily Pivots: (S1) 1.4879; (P) 1.4922; (R1) 1.4969; More...
Intraday bias in EUR/AUD remains neutral at this point. Further rise is in favor with 1.4796 minor support intact. We're holding on to the bullish view that pull back from 1.5226 has completed at 1.4625, ahead of 38.2% retracement of 1.3624 to 1.5226 at 1.4614. Above 1.4997 will turn bias back to the upside for 1.5226 first. However, firm break of 1.4796 will dampen this view and turn bias back to the downside for 1.4625 support.
In the bigger picture, price actions from 1.6587 medium term top are viewed as a corrective pattern. Such correction should be completed at 1.3624 after defending 1.3671 key support. Rise from 1.3642 would extend to 61.8% retracement of 1.6587 to 1.3624 at 1.5455. Sustained break there will pave the way to retest 1.6587. However, sustained break of 1.4669 support will dampen this bullish view. We'll assess the outlook later after looking at the structure and depth of the pull back.
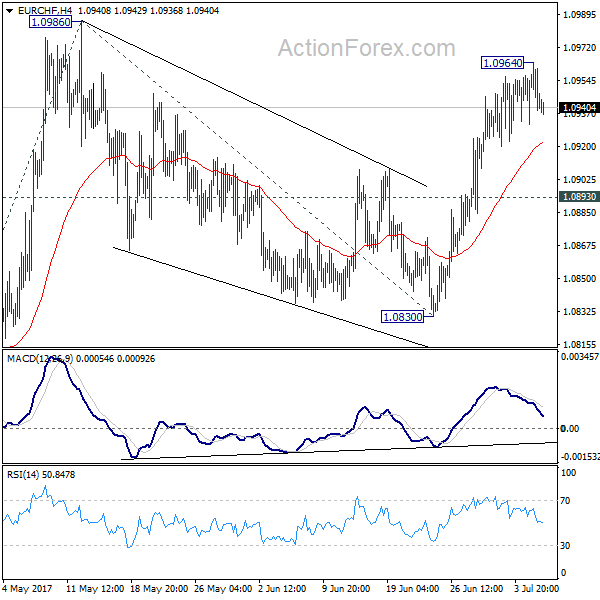
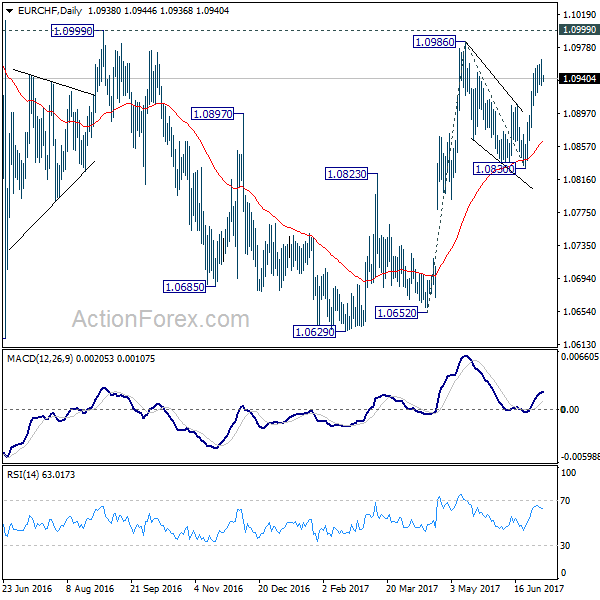
EUR/CHF Daily Outlook
Daily Pivots: (S1) 1.0929; (P) 1.0946; (R1) 1.0960; More...
A temporary top is formed at 1.0964 again and intraday bias in EUR/CHF is turned neutral for consolidation. Downside of retreat should be contained by 1.0893 support to bring another rally. Above 1.0964 will target 1.0986/0999 resistance zone. Break there will extend whole rally from 1.0629 to 61.8% projection of 1.0652 to 1.0986 from 1.0830 at 1.1036.
In the bigger picture, the price actions from 1.1198 are seen as a corrective move. Such correction could have completed after defending 38.2% retracement of 0.9771 to 1.1198 at 1.0653. Decisive break of 1.0999 resistance will target a test on 1.1198 high. For now, this will be the preferred case as long as 1.0830 support holds.
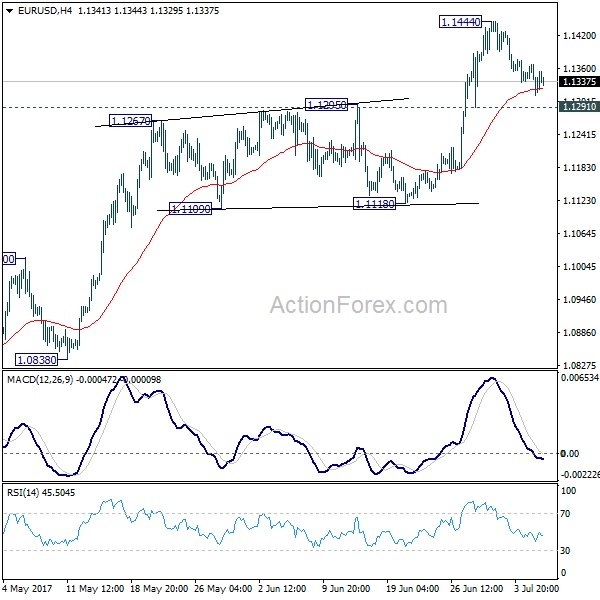
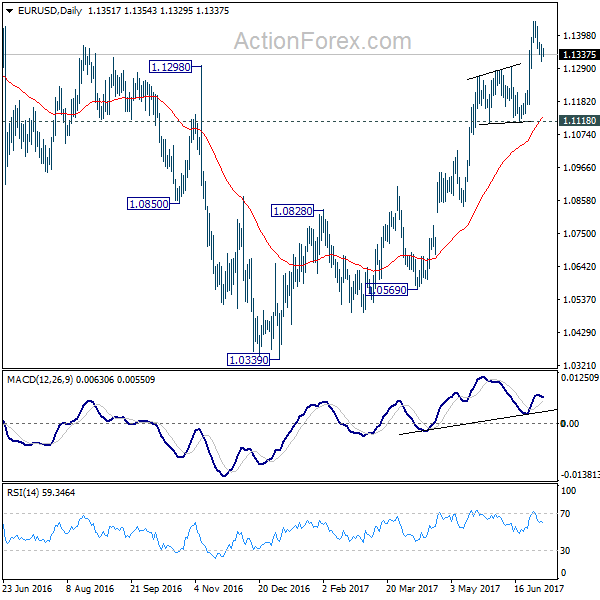
EUR/USD Daily Outlook
Daily Pivots: (S1) 1.1319; (P) 1.1344 (R1) 1.1375; More.....
Intraday bias in EUR/USD remains neutral as consolidation from 1.1444 is still in progress. We'd expect downside to be contained by 1.1291 resistance turned support to bring rally resumption. Break of 1.1444 will extend the rise from 1.0339 low to 1.1615 resistance next. Meanwhile, break of 1.1291 will turn focus back to 1.1118 support.
In the bigger picture, the firm break of 1.1298 resistance further affirm medium term reversal. That is an important bottom was formed at 1.0339 on bullish convergence condition in weekly MACD. Further rise would be seen to 55 month EMA (now at 1.1776). Sustained break there will pave the way to 38.2% retracement of 1.6039 (2008 high) to 1.0339 (2017 low) at 1.2516 next. This will now remain the favored case as long as 1.1118 support holds.
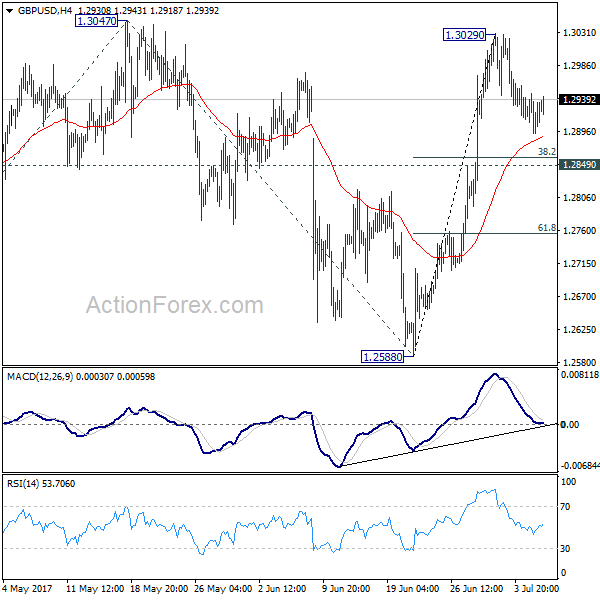
GBP/USD Daily Outlook
Daily Pivots: (S1) 1.2900; (P) 1.2924; (R1) 1.2955; More...
Intraday bias in GBP/USD remains neutral as consolidation from 1.3029 is in progress. While deeper retreat cannot be ruled out, downside should be contained above 1.2849 support to bring rise resumption. Break of 1.3029 should then send GBP/USD through 1.3047 to 61.8% projection of 1.2108 to 1.3047 from 1.2588 at 1.3168 next.
In the bigger picture, overall, price actions from 1.1946 medium term low are seen as a corrective pattern that is still in progress. While further upside is now in favor, overall outlook remains bearish as long as 1.3444 key resistance holds. Larger down trend from 1.7190 is expected to resume later after the correction completes. And break of 1.2588 will indicate that such down trend is resuming.

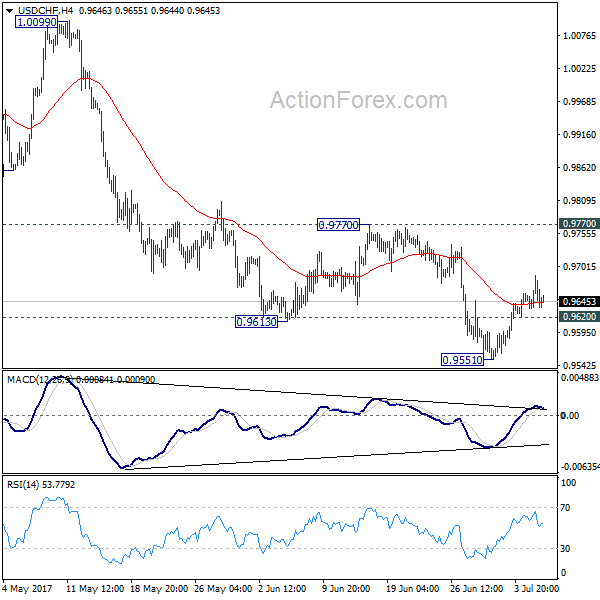
USD/CHF Daily Outlook
Daily Pivots: (S1) 0.9617; (P) 0.9652; (R1) 0.9675; More......
No change in USD/CHF's outlook as price actions from 0.9551 are seen as a corrective move. Intraday bias stays neutral at this point. Outlook remains bearish as long as 0.9777 resistance holds. Below 0.9620 minor support will turn bias back to the downside first. Further break of 0.9551 will extend the decline from 1.0342 to 0.94443 key support level. At this point, we'd expect strong support from there to bring rebound. Meanwhile, break of 0.9777 will now indicate short term reversal, on bullish convergence condition in 4 hour MACD.
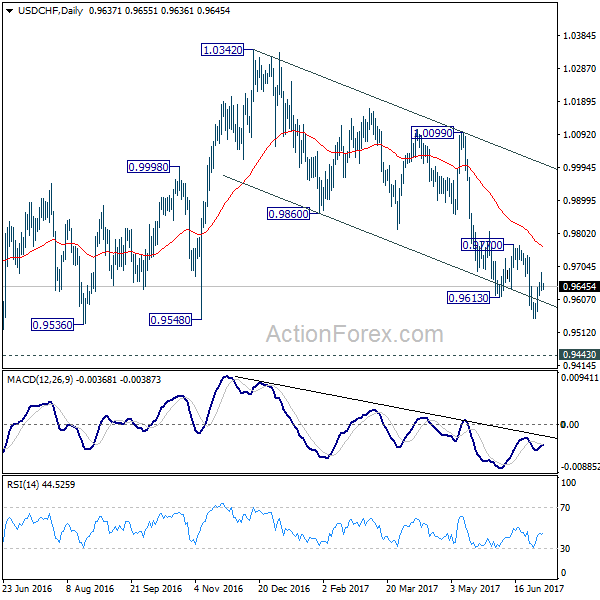
In the bigger picture, USD/CHF is still bounded in medium term range of 0.9443/1.0342 for the moment. Consolidative trading would likely continue and medium term outlook remains neutral. Break of 1.0342 key resistance is needed to confirm underlying bullish momentum in the pair. Meanwhile, downside attempts should be contained by 0.9443 key support level. However, sustained break of 0.9443 will carry larger bearish implication and target 0.9 handle.
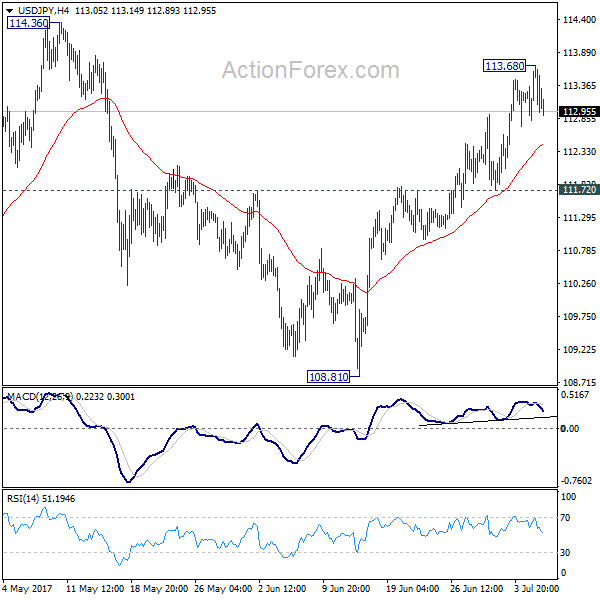
USD/JPY Daily Outlook
Daily Pivots: (S1) 112.85; (P) 113.14; (R1) 113.57; More...
A temporary top is in place at 113.68 as USD/JPY lost upside momentum. Intraday bias is turned neutral for consolidation. Downside of retreat should be contained by 111.72 support to bring another rally. Above 113.68 will target 114.36 resistance next. Decisive break there will confirm our bullish view that corrective pull back from 118.65 has completed at 108.12. In that case, further rally would be seen to retest 118.65.
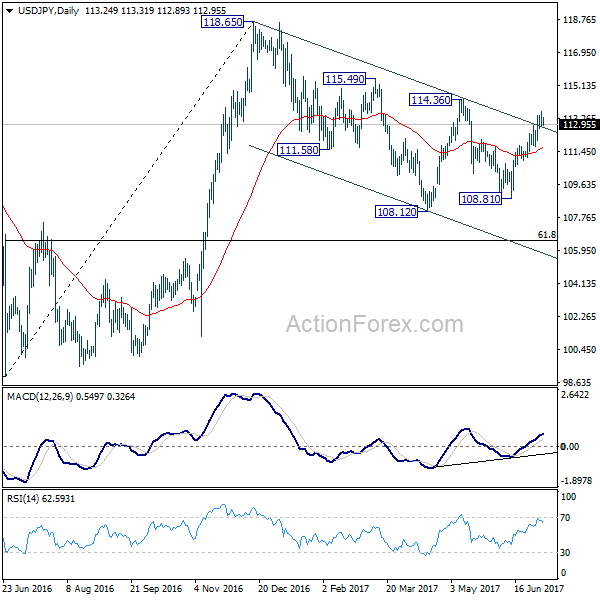
In the bigger picture, the corrective structure of the fall from 118.65 suggests that rise from 98.97 is not completed yet. Break of 118.65 will target a test on 125.85 high. At this point, it's uncertain whether rise from 98.97 is resuming the long term up trend from 75.56, or it's a leg in the consolidation from 125.85. Hence, we'll be cautious on topping as it approaches 125.85.
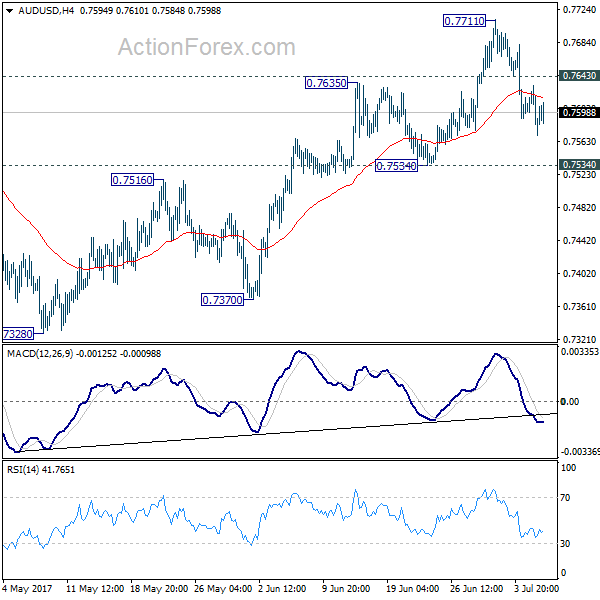
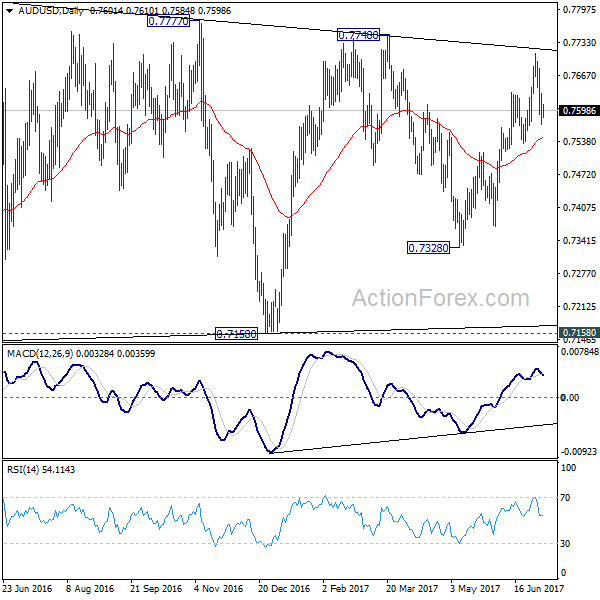
AUD/USD Daily Outlook
Daily Pivots: (S1) 0.7569; (P) 0.7626; (R1) 0.7660; More...
No change in AUD/USD's outlook as price actions from 0.7711 are viewed as a corrective move so far. Intraday bias remains neutral at this point. With 0.7534 support intact, another rise is in favor. Above 0.7643 will bring retest of 0.7711. Break will extend the rally from 0.7328 to 0.7748 resistance and above. At this point, there is no clear sign of range breakout yet. Hence, we'd be cautious on topping again as it approaches medium term fibonacci level at 0.7849. On the downside, break of 0.7534 will indicate near term reversal and turn bias back to the downside for 0.7370 support.
In the bigger picture, we're still treating price actions from 0.6826 low as a corrective pattern. And, as long as 38.2% retracement of 0.9504 to 0.6826 at 0.7849 holds, long term down trend from 1.1079 is expected to resume sooner or later. Break of 0.6826 low will target 0.6008 key support level. However, firm break of 0.7849 will indicate that rise from 0.6826 is developing into a medium term rebound, rather than a sideway pattern. In such case, stronger rise should be seen to 55 month EMA (now at 0.8096) and above.
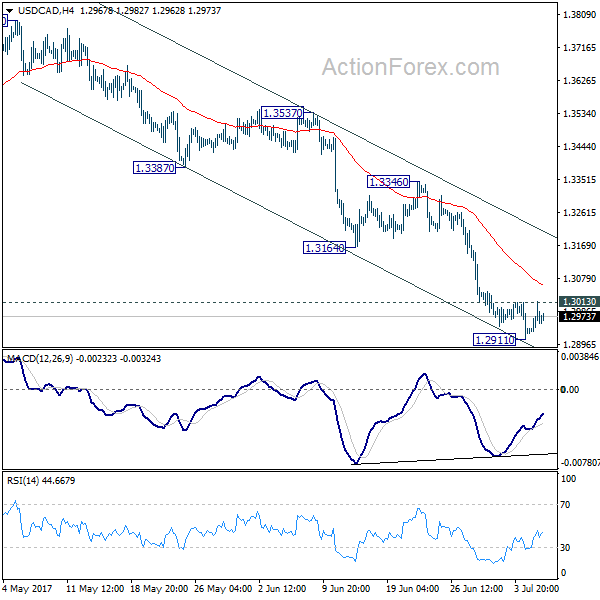
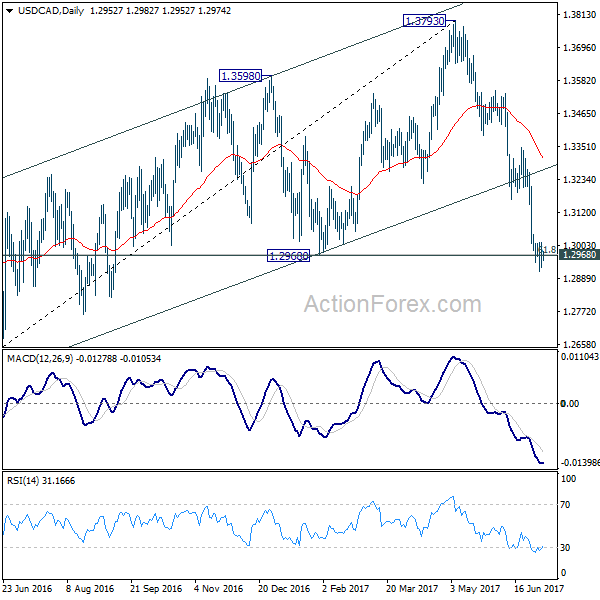
USD/CAD Daily Outlook
Daily Pivots: (S1) 1.2892; (P) 1.2953; (R1) 1.2994; More....
A temporary top is in place at 1.2911 after touching 1.3013 minor resistance. Intraday bias in USD/CAD is turned neutral first. Considering bullish convergence condition in 4 hour MACD, break of 1.3013 will indicate short term bottoming. In such case, stronger rebound would be seen back to 1.3164/3346 resistance zone first, before staging another fall. Overall, we'd expect decline from 1.3793 to extend later and sustained trading below 1.2968 cluster support, 61.8% retracement of 1.2460 to 1.3793 at 1.2969 will pave the way to retesting 1.2460 low.
In the bigger picture, price actions from 1.4689 medium term top are seen as a correction pattern. The second leg should have finished at 1.3793. Break of 1.2460 will extend such correction to 50% retracement of 0.9406 to 1.4869 at 1.2048. At this point, we'd look for strong support from there to contain downside and bring rebound. However, firm break there will target 100% projection of 1.4689 to 1.2460 from 1.3793 at 1.1564.
Dollar Stays firm after FOMC Minutes, But Losing Momentum
Dollar and Canadian Dollar remain the strongest major currencies for the week, but both are losing momentum. Markets are rather unmoved by the highly anticipated FOMC minutes released overnight. DOW closed down -0.01% t 21478.17 after struggling in tight range for all the session. S&P 500 closed up 0.15% at 2432.54. NSADAQ is the more vulnerable one even though it closed up 0.67% at 6150.86. 10 year yield edged higher to 2.357 but failed to extend recent gain and closed down -0.012 at 2.334. In other markets, gold is trying to stabilize 1225 after diving to as low as 1216.5 earlier this week. WTI crude oil suffered steep selloff yesterday, from 47.3 to 44.51 and is now at around 45.3. The selloff in oil price accompanied the pull back in Canadian Dollar.
Fed policy makers divided over timing of balance sheet reduction
The FOMC minutes for the June meeting unveiled that members were divided over the timing of balance sheet reduction while there was also discussion over the recent inflation weakness. At the meeting, the Fed raised its policy rate, by 25 bps, to a target range of 1-1.25%. The minutes reflected the division among members regarding the timing of balance sheet reduction as well as how it would affect the path of interest rate hike. While "several preferred to announce a start to the process within a couple of months", "some others emphasized that deferring the decision until later in the year would permit additional time to assess the outlook for economic activity and inflation".
Concerning the interaction with the monetary policy, the minutes revealed that "several participants indicated that the reduction in policy accommodation arising from the commencement of balance sheet normalization was one basis for believing that, if economic conditions evolved broadly as anticipated, the target range for the federal funds rate would follow a less steep path than it otherwise would". Yet, "some other participants suggested that they did not see the balance sheet normalization program as a factor likely to figure heavily in decisions about the target range for the federal funds rate". Some members holding the latter view "judged that the degree of additional policy firming that would result from the balance sheet normalization program was modest".
More on FOMC minutes:
Also:
- FOMC Minutes: Fed Likely To Announce Start Of QT In September
- FOMC Debated Inflation Weakness in June, Divided on Timing of Balance Sheet Normalization
IMF Lagarde: Financial vulnerabilities present an immediate concern
IMF Managing Director Christine Lagarde warned in a blog post that "financial vulnerabilities present an immediate concern." And, "after a long period of favorable financial conditions, including low-interest rates and easier access to credit, corporate leverage in many emerging economies is too high." In Europe, she noted that "bank balance sheets still need repair following the crisis." In China, "a faster-than-projected expansion - if it continues to be fueled by rapid credit and increased spending - would potentially lead to unsustainable public and private debt in the future".
Australia trade surplus widened
From Australia, trade surplus widened to AUD 2.47b in May, up from AUD 0.09b and beat expectation of AUD 1.11b. That was driven by the 9% growth in exports over the month while imports rose 1%. However, it should be noted that coal exports jumped 62% over the month, for supply was disrupted back in April after Queensland was hit by cyclone in late March. Aussie remains the weakest major currency for the week as markets were dissatisfied that RBA didn't turn hawkish, following other major central banks.
ECB accounts and US data to highlight the day
More market moving events are scheduled for today. ECB meeting accounts will be a major focus as markets will look into how policy makers are ready for tapering asset purchases. Germany will release factory orders while Swiss will release CPI. US ADP employment, jobless claims and ISM services will be featured in US session. After the release, markets will get a sense of how tomorrow's non-farm payroll report would be like. US will also release trade balance. From Canada, trade balance and building permits will be featured
USD/CAD Daily Outlook
Daily Pivots: (S1) 1.2892; (P) 1.2953; (R1) 1.2994; More....
A temporary top is in place at 1.2911 after touching 1.3013 minor resistance. Intraday bias in USD/CAD is turned neutral first. Considering bullish convergence condition in 4 hour MACD, break of 1.3013 will indicate short term bottoming. In such case, stronger rebound would be seen back to 1.3164/3346 resistance zone first, before staging another fall. Overall, we'd expect decline from 1.3793 to extend later and sustained trading below 1.2968 cluster support, 61.8% retracement of 1.2460 to 1.3793 at 1.2969 will pave the way to retesting 1.2460 low.
In the bigger picture, price actions from 1.4689 medium term top are seen as a correction pattern. The second leg should have finished at 1.3793. Break of 1.2460 will extend such correction to 50% retracement of 0.9406 to 1.4869 at 1.2048. At this point, we'd look for strong support from there to contain downside and bring rebound. However, firm break there will target 100% projection of 1.4689 to 1.2460 from 1.3793 at 1.1564.
Economic Indicators Update
| GMT | Ccy | Events | Actual | Forecast | Previous | Revised |
|---|---|---|---|---|---|---|
| 01:30 | AUD | Trade Balance (AUD) May | 2.47B | 1.11B | 0.56B | 0.09B |
| 06:00 | EUR | German Factory Orders M/M May | 1.80% | -2.10% | ||
| 07:15 | CHF | CPI M/M Jun | 0.00% | 0.20% | ||
| 07:15 | CHF | CPI Y/Y Jun | 0.30% | 0.50% | ||
| 08:10 | EUR | Eurozone Retail PMI Jun | 52 | |||
| 11:30 | USD | Challenger Job Cuts Y/Y Jun | 9.70% | |||
| 11:30 | EUR | ECB Monetary Policy Meeting Accounts | ||||
| 12:15 | USD | ADP Employment Change Jun | 180K | 253K | ||
| 12:30 | CAD | Building Permits M/M May | -0.20% | |||
| 12:30 | CAD | International Merchandise Trade (CAD) May | -0.4B | |||
| 12:30 | USD | Trade Balance May | -46.3B | -47.6B | ||
| 12:30 | USD | Initial Jobless Claims (JUL 01) | 243K | 244K | ||
| 14:00 | USD | ISM Services/Non-Manufacturing Composite Jun | 56.5 | 56.9 | ||
| 15:00 | USD | Crude Oil Inventories | 0.1M |
Elliott Wave View: USDX 7.6.2017
Short term USDX (USD Index) Elliott Wave view suggests the rally to 97.88 high on 6/20 ended Intermediate wave (X). Decline from there is unfolding as an impulse Elliott Wave structure with extension and ended at 95.47 low on 6/29. This 5 wave move could be Minor wave A of an Elliott wave zigzag structure structure, where Minute wave ((i)) ended at 97.17 and Minute wave ((ii)) ended at 97.47. Minute wave ((iii)) ended at 96.15, Minute wave ((iv)) at 96.61 and Minute wave ((v)) of A ended at 95.47.
Minor wave B bounce is currently in progress to correct cycle from 6/20 peak. Revised view suggests the subdivision of Minor wave B is unfolding as an Elliott wave double three structure. Minute wave ((w)) ended at 96.51 and near term, Minute wave ((x)) pullback is in progress to correct cycle from 6/29 low in 3, 7, or 11 swing before turning higher again. While the pullback stays above pivot at 6/29 low (95.47), USDX has scope to extend higher one more leg towards 96.67 – 97.31 area to end Minute wave ((y)) of B. Afterwards, while bounces stay below pivot at 6/20 high (97.88), expect USDX to resume lower again. We don’t like buying the proposed bounce.
USDX 1 Hour Elliott Wave Chart