Sample Category Title
EUR/GBP Candlesticks and Ichimoku Analysis
Weekly
• Last Candlesticks pattern: N/A
• ime of formation: N/A
• Trend bias: Near term up
Daily
• Last Candlesticks pattern: Hammer
• Time of formation: 3 Feb 2016
• Trend bias: Up
EURGBP – 0.8776
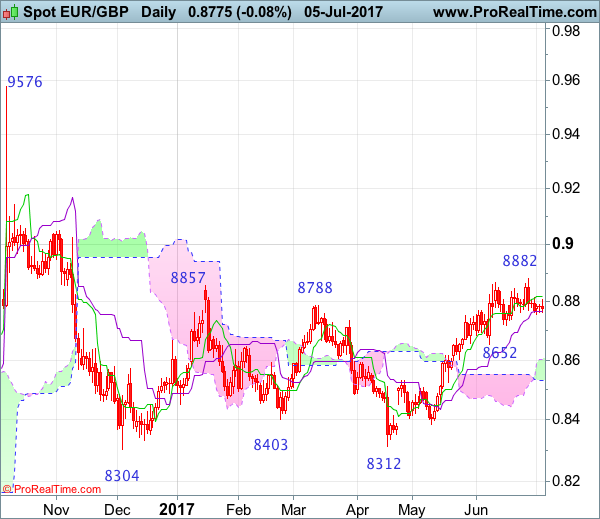
As the single currency has retreated after last week’s brief rise to 0.8882, retaining our view that further consolidation below this level would be seen and pullback to 0.8723 support cannot be ruled out, however, reckon previous support at 0.8652 would contain downside and bring another upmove later, above said resistance at 0.8882 would extend recent upmove to 0.8900 but overbought condition should prevent sharp move beyond 0.8940-50 (50% Fibonacci retracement of 0.9576-0.8304) and reckon psychological resistance at 0.9000 would hold from here, price should falter well below 0.9090 (61.8% Fibonacci retracement), bring retreat later.
On the downside, whilst initial pullback to 0.8723 support is likely, reckon support at 0.8652 would attract renewed buying interest and bring another upmove later. Only a break below support at 0.8603 would suggest top is formed instead, bring retracement of recent upmove to 0.8550 but reckon previous support at 0.8524 would contain downside and price should stay well above 0.8450-60, bring a strong rebound later next month.
Recommendation: Buy again at 0.8660 for 0.8880 with stop below 0.8560.
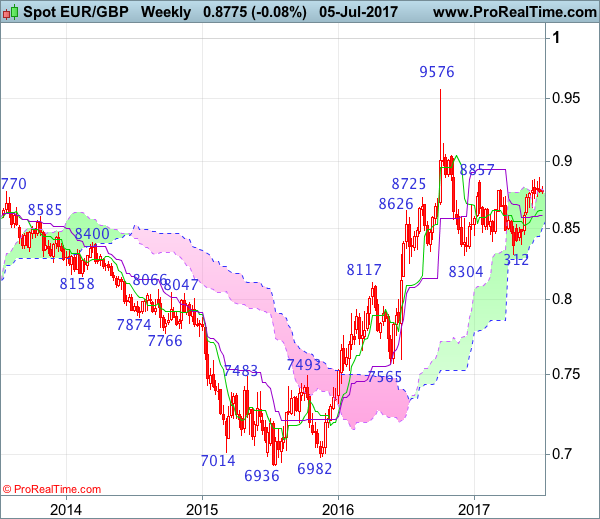
On the weekly chart, last week’s retreat after brief rise to 0.8882 formed a shooting star as suggested in our previous update, retaining our view that consolidation below this level would be seen and initial downside bias remains for pullback to 0.8720-25, then 0.6890-00, however, reckon support at 0.8652 would limit downside and bring another rise later. Above said resistance at 0.8882 would signal the rise from 0.8304 low is still in progress for headway to 0.8900-10, then 0.8950, however, reckon upside would be limited to 0.9000 and 0.9045-50 should hold from here, price should falter well below 0.9090 (61.8% Fibonacci retracement).
On the downside, although pullback to 0.8720-25 cannot be ruled out, reckon support at 0.8652 would hold and bring another rise to aforesaid upside targets. A weekly close below the Kijun-Sen (now at 0.8597) would defer and suggest top is possibly formed, risk weakness to 0.8550 but a drop below previous resistance at 0.8531 is needed to add credence to this view, bring further fall to 0.8490-00, then towards support at 0.8457 which is likely to hold from here.
Divided Fed Keeps Markets Directionless, Oil Recovers Slightly
Minutes from the Federal Reserve's meeting on 13-14 June showed that monetary policy members were split over the timing of shrinking the balance sheet. While some Fed officials want to kick off the process for reducing the holdings of treasuries and asset-backed securities in September, others want to see more clues on inflation, which hasbeen edging lower. These mixed signalshave kept the bulls and bears on the sidelines and that is why it is not surprising to see a muted market reaction.
While U.S. Treasury yields declined slightly, they are still trading at multi-week highs, providing little incentive to short the U.S. dollar. Traders are still awaiting Friday's Labor Report for fresh signals on the health of the U.S. job market. I think this report will be of more importance than the released minutes and will be a critical test to the U.S. currency. While charts are still indicating oversold signals on the USD, it will require a fundamental catalyst to convince bulls to return. The 138,000 jobs added to the economy in May came sharply below the expected increase of 185,000. Wage growth also disappointed, with average earnings rising 2.5% annually. If the NFP report managed to surprise by moving to the upside on Friday, the USD will likely find a near-term bottom. However, the headline figure wouldnot be enough, even if it came above 180,000. Wage growth is what's needed to narrow the gapbetween the Fed's dot plot and the markets own dot plot. Today's agenda includes the ISM Non-Manufacturing Report and ADP Employment Change; ifboth of these report more robust figures, they could provide fresh support to the USD.
Oil prices made most of the headlines yesterday after declining more than 4%. The steep fall occurred after an eight-session rally, but thanks to the American Petroleum Institute Report releasedon Wednesday, which showeda huge drop of 5.8 million barrels in crude supplies, an endwas put to the steep fall. Today's EIA Report will likely confirm that inventories declined last week by more than 2 million barrels. Overall, one report is not enough to generatea bullish market sentiment. It requires steady declines in inventories, along with a drop in drilling activities. Traders will also keep a close eye on Libya's and Nigeria's production, which accounted for half of OPEC's production increase in June. Given that nothing has changed fundamentally this week and yesterday's selloff looks mostly technical, I believe prices will stabilize for the rest of the week.
EUR/CHF Candlesticks and Ichimoku Analysis
Weekly
• Last Candlesticks pattern: Doji
• Time of formation: 20 Feb 2017
• Trend bias: Up
Daily
• Last Candlesticks pattern: Doji
• Time of formation: 1 Sep 2016
• Trend bias: Near term down
EUR/CHF – 1.0958
As the single currency has maintained a firm undertone after staging a strong rebound from 1.0833, adding credence to our bullish view that correction from 1.0988 has ended and upside bias remains for test of this level, break there would encourage for headway to previous resistance at 1.1001. Looking ahead, only a break above there would retain bullishness and bring subsequent rise to 1.1050-60, then 1.1100, having said that, price should falter below another previous resistance at 1.1201.
On the downside, whilst pullback to 1.0920-25 cannot be ruled out, reckon the Tenkan-Sen (now at 1.0906) would limit downside and bring another rise to aforesaid upside targets. A daily close below the Kijun-Sen (now at 1.0900) would defer and risk weakness to 1.0845 but only break there would signal another leg of corrective fall from 1.0988 is underway for test of 1.0833, then towards previous support at 1.0792 which is likely to hold from here.
Recommendation: Hold long entered at 1.0865 for 1.1065 with stop below 1.0835.

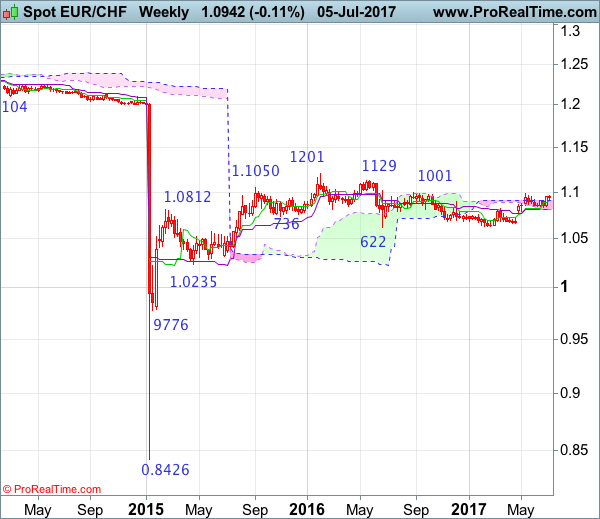
On the weekly chart, last week’s rebound did form a long white candlestick as suggested in our previous update and bullishness remains for gain to resistance at 1.0988, however, above there is needed to retain bullishness and extend recent upmove from 1.0631 to previous resistance at 1.1001, a sustained breach above this level would signal the fall from 1.1201 has ended, bring further gain to 1.1100 and possibly test of resistance at 1.1129 but price should falter below said recent high at 1.1201.
On the downside, whilst pullback to the Tenkan-Sen (now at 1.0911) cannot be ruled out, price should stay well above indicated support at 1.0833, bring another rebound later. A break of said support at 1.0833 would risk test of the Kijun-Sen (now at 1.0810) but only break of previous support at 1.0780 would abort and signal top has been formed at 1.0988 instead, bring further weakness to 1.0720, however, still reckon support at 1.0656 would remain intact, bring another rebound later.
NZDUSD Shifts To Neutral After Pausing Uptrend At 5-Month High
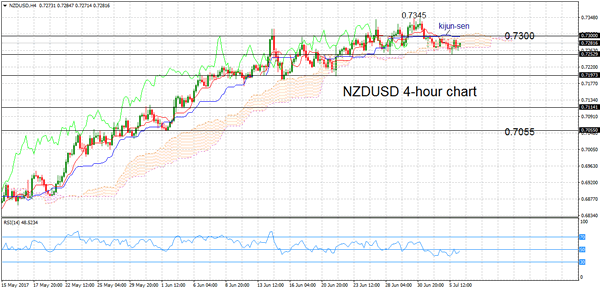
NZDUSD has shifted to a neutral stance on the 4-hour chart, after a strong rally that took prices to a 5-month high of 0.7345 on June 30.
An uptrend took place when prices bounced from the May 11 low of 0.6816, but upside momentum stalled and RSI fell back below 50 into bearish territory. The oscillator stopped declining and is currently moving sideways, suggesting that NZDUSD is now in a consolidation phase.
The risk has tilted to the downside since the Tenkan-sen line crossed below the Kijun-sen line on July 4. NZDUSD is currently trading within the Ichimoku cloud and support was provided at 0.7253 after prices fell briefly below the cloud. Further support is located at the June 22 low of 0.7196. From here, an early June support level at 0.7114 comes into view. A drop below 0.7055 would change the current bullish market structure.
A move back above resistance at the Kijun-sen line and key level of 0.7300 would open the way for a re-test of the 0.7345 high and from here there would be a resumption of the recent uptrend to target the February 7 high of 0.7374.
NZDUSD is neutral in the short-term as long as prices remain above 0.7250. The overall market structure on the 4-hour chart remains bullish.
USDJPY Bullish Phase Stalls As RSI Reaches Overbought Levels
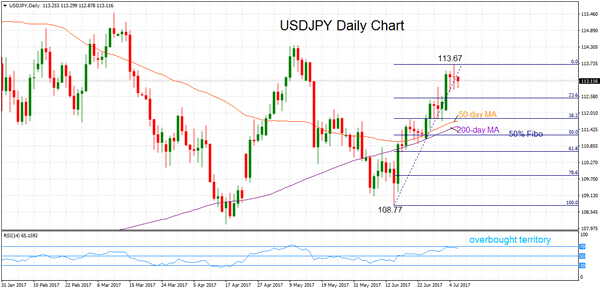
The short-term bullish phase that started on June 14 has stalled at a high of 113.67 reached on July 5. The subsequent corrective move lower is not surprising since the market reached overbought conditions as indicated by the RSI reaching near 70.
The key psychological level at 113.00 appears to be supportive, as USDJPY has been closing above this level all week. If prices fall below this level and continue to decline, then the next support level at 111.80 comes into view. This happens to be the 38.2% Fibonacci retracement level of the upleg from 108.77 to 113.67. A further decline risks a break below the 50% Fibonacci at 111.22, which would lead to a retracement of more than half of the uptrend from June 14 and would change the trend.
For now there are no signs yet of a shift in the short-term uptrend, as the market is above both the 50-day and 200-day moving averages, which are still pointing north and are positively aligned, while the shorter-term MA is above the longer-term MA. The RSI is in bullish territory above 50. However, it has flattened, suggesting that a consolidation phase is possible in the near term.
Should USDJPY regain its upside momentum, there is scope to re-test 113.67. Surpassing this peak would open the way towards the May 10 high of 114.36. This move would help strengthen the upside momentum and bring a resumption of the uptrend to target the key 115.00 level.
While the short-term market structure remains bullish, in the bigger picture, USDJPY has been neutral since March. The market needs to rise above 115.00 in order to provide a stronger bullish outlook.
Fed Split Opinions Weaken Dollar Short-Term, Euro Under Pressure
The US dollar had weakened against the yen during the early Asian trading session on the mixed tone from the minutes of the Fed's latest meeting. However, the greenback gathered strength as the yen gave up gains ahead of the European open. Australia's trade surplus lent some short-lived gains to the aussie.
Minutes from the Fed's latest meeting in June, at which the US central bank voted to raise interest rates, showed an absence of consensus about when to start the process of Fed's balance sheet reduction. In a time of low inflation, some of the officials wanted to wait until later in the year to start the balance sheet reduction. Looking at forex markets, the greenback weakened against the yen following the release. However, the dollar regained some ground against the yen near the close of Asian trading, last trading at 113.33 yen. Several key US data will be released later in the day, including the ADP employment report, ISM non-manufacturing PMI and the initial jobless claims. All of these could have a significant impact on the greenback.
The Australian dollar rose against the greenback after stronger than expected trade data. Australia's trade surplus in May was A$2.47 billion, coming in well above the expected A$1.1 billion. Aussie/dollar went from 0.7595 to 0.7610 as the data was released, but the gains were short-lived. The pair was last trading at 0.7600 ahead of the European open.
The euro was under pressure against the dollar during the early Asian session, but managed to recover some of the losses as the session was ending. Euro/dollar opened at 1.1351 and fell to 1.1338 ahead of the European open.
Disappointing May industrial orders out of Germany added to the euro pressure in the late Asian trading session. Markets were expecting industrial orders to had grown 2% month-on-month in May, but the number came at only half of that growth, after a decline of 2.1% in April. However, currency traders didn't attribute much significance to it as euro/dollar bounced up shortly after the release. The release of the European Central Bank minutes from the bank's latest meeting might be closely watched later in the day.
Sterling rose modestly against the greenback, last trading at $1.2933, ahead of some UK key data releases tomorrow.
Oil retraced some of yesterday's heavy losses, on a report that showed a decline in US crude and gasoline stockpiles. WTI was last trading at $45.61 a barrel, up from yesterday's heavy plunge when it reached a low of $44.51.
Looking at gold, the precious metal was under pressure today after two days of gains. The commodity's price fell to $1,223.60 as the Asian markets were closing for the day.
Short USD Covering
According to the minutes release on Wednesday evening, from the last Fed policy meeting on June 13-14, it appears that Federal Reserve policymakers are increasingly split on the outlook for inflation and how it might affect the future pace of US interest rate rises. Fed Chair Janet Yellen, at a press conference after the minutes were released, described a recent decline in inflation as temporary and the central bank kept its forecast of one more rate rise this year and three the next. However, some policymakers have been increasingly worried about the Fed's struggle to get inflation back to its 2% objective. Underlying inflation slipped again in May to 1.4 % and has run below target for more than five years. In the minutes, some policymakers also stated that 'the inflation weakness made them less comfortable with the current implied path of rate hikes”. Traders will now be looking ahead to tomorrow's Non Farm Payroll release for further guidance.
USDJPY climbed nearly 0.5% on Wednesday to 113.681, the highest levels seen for 2 months, as traders trimmed down short USD positions before upcoming data sheds more light on the ongoing recovery in the US economy. USDJPY has retraced since making that high to currently trade around 113.15.
EURUSD fell to 1.1312 on Wednesday following comments made by ECB´s Benoit Coeuré who said that 'the Governing Council has not discussed policy changes”, cooling down hopes of tapering. Mr. Coeuré also played down recent financial market volatility that was partly sparked by comments from ECB President Draghi that were viewed as an indication of a coming policy change. In addition, the release of German and Eurozone Services PMIs in June both beat their estimates, but were weaker than the May reports, further pressuring EUR. Currently EURUSD is trading around 1.1340.
GBPUSD traded near to 1 week lows as the poor data release of Britain's Service Sector added confirmation to growing barriers to growth for the UK economy and deter the Bank of England raising interest rates any time soon. Following the release GBPUSD traded down to a low on the day of 1.2893 before rebounding to currently trade around 1.2945.
Gold remains relatively flat after 2 days of gains currently trading around $1,227.
OPEC Oil exports climbed for a second month in June per Thomson Reuters Oil Research data. In June OPEC exported 25.92 million barrels per day (bpd), up 450,000 bpd from May and 1.9 million bpd more than a year earlier. The head of the International Energy Agency commented that 'rising output from key oil producers could hamper expectations that the oil market would rebalance in the second half of the year”. As a result, Oil prices fell nearly 4% on Wednesday, ending its longest bull-run in more than 5 years with WTI trading as low as $45.32pb on the day. Currently WTI is trading around $45.60pb with Brent trading around $48.25pb.
Today, at 12:30 BST, the ECB Monetary Policy Meeting Accounts are released. The report contains an overview of financial market, economic and monetary developments, which should provide more insight into future interest rate decisions in the Eurozone.
Later, at 13:15 BST, US ADP Employment change for June is released. The consensus is 185K (previously 235K). If we see a release worse than expectations, it will have negative implications for consumer spending and discouraging economic growth and therefore put downward pressure on USD.
This release will be followed at 13:30 by US Initial Jobless Claims. The release is expected to be 243K (244K previously). Jobless Claims has a direct bearing on the US Labour Market, whereby a higher than expected number indicates weakness and therefore is bearish for USD.
The EIA Crude Oil Stocks change (Jun 30) data release at 16:00 BST rounds off the day's economic data releases. The consensus is for a decrease of 2.833 Million compared to the previous slight gain of 0.118 Million. With Oil under recent downward pressure we would expect this data release to provide additional volatility in the Market.
Trade Idea : USD/CHF – Buy at 0.9600
USD/CHF - 0.9655
Most recent candlesticks pattern : N/A
Trend : Near term down
Tenkan-Sen level : 0.9649
Kijun-Sen level : 0.9663
Ichimoku cloud top : 0.9643
Ichimoku cloud bottom : 0.9624
Original strategy :
Buy at 0.9600, Target: 0.9700, Stop: 0.9565
Position : -
Target : -
Stop : -
New strategy :
Buy at 0.9600, Target: 0.9700, Stop: 0.9565
Position : -
Target : -
Stop : -
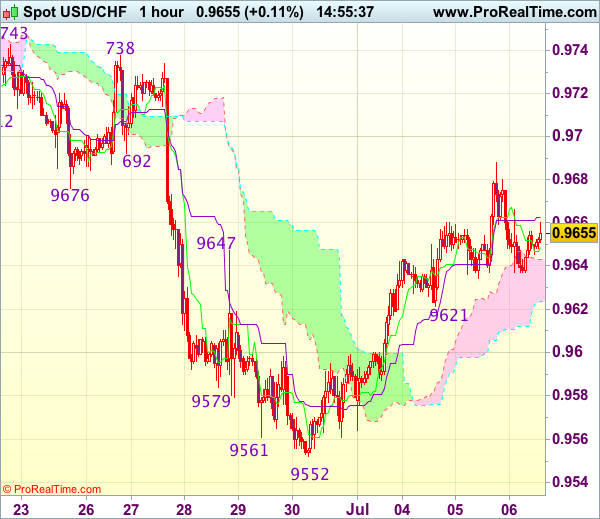
As the greenback retreated after rising to 0.9688, suggesting consolidation below this level would be seen and pullback to 0.9621 support cannot be ruled out, however, if our view that low has been formed at 0.9552 is correct, downside would be limited to 0.9600 and bring another rebound later, above said resistance would extend the rise from 0.9552 low for retracement of recent decline to 0.9700 but reckon upside would be limited and price should falter below resistance area at 0.9738-43.
In view of this, would not chase this rise here and we are looking to buy dollar on pullback as 0.9600 should limit downside and bring another rise later. Below 0.9565-70 would abort and signal intra-day top is formed, risk retest of 0.9552 first.
Market Update – Asian Session: Japan 10-Yr JGB Yield Reaches 0.1%
Asia Summary
Sentiment remains a bit risk off in the region amid Fed meeting minutes showing some uncertainty about when the next rate hike would be and tensions in the region continue to increase as Trump criticizes China in a tweet,“Trade between China and North Korea grew almost 40% in the first quarter. So much for China working with us - but we had to give it a try!”. Crude gained some of its overnight losses in the session after a larger draw down in weekly API figures and speculation about production levels in the next OPEC meeting.
The main economic data point for the session was Australia May trade balance, which came in nearly A$1.5B higher than analysts expectations. The A$2.47B surplus helped the A$ pair losses, before dipping to 0.7596. Notably coal exports rose 62% m/m, however the jump was likely due to Cyclone Debbie impact on April figures.
China again skipped open market operations for a 10th day and PBOC Gov Zhou reiterated to keep prudent monetary policy stance.
Key economic data
(AU) AUSTRALIA MAY TRADE BALANCE (A$): +2.47B V +1.0BE (7th consecutive surplus)
(CO) Colombia Jun CPI M/M: 0.1% v 0.2%e; Y/Y: 4.0% v 4.1%e
(JP) Japan investors net bought ¥772.8B in foreign bonds v bought ¥322B in prior week; Foreign investors net sold ¥14.0B in Japan stocks v sold ¥26.3B in prior week
Speakers and Press
China
(CN) PBoC Gov Zhou: Reiterates to keep 'prudent, neutral' monetary policy in 2017 - 2016 Annual Report
(CN) China Ministry of Commerce (MOFCOM): Trade probes against China fell noticeably in H1
Japan
(JP) BOJ Minutes of the Fifth Round of the "Bond Market Group" Meetings; questions leaving ¥80T market operation pledge
(JP) BOJ likely to keep policy steady and cut inflation forecast for year ending in Mar 2018 at quarterly review on July 20th - financial press
Korea
(KR) S&P: North Korea's ICBM launch NOT at level which hurts South Korea's credit rating
(KR) Moody's affirms South Korea Aa2 sovereign rating; Raises 2017 GDP outlook to 2.8% from 2.5%
Australia
(AU) Reserve Bank of Australia (RBA) Harper: RBA comfortable holding interest rates for now; no reason “to scare the horses at the moment” by signaling coming interest rate increases - financial press
Asian Equity Indices/Futures (00:30ET)
Nikkei -0.6%, Hang Seng -0.3%, Shanghai Composite -0.3%, ASX200 -0.1%, Kospi -0.2%
Equity Futures: S&P500 +0.0%; Nasdaq -0.1%, Dax +0.1%, FTSE100 +0.1%
FX ranges/Commodities/Fixed Income (00:30ET)
EUR 1.1355-1.1329; JPY 113.31-113.89; AUD 0.7611-0.7585; NZD 0.7292-0.7264
Aug Gold +0.4% at 1,226/oz; Aug Crude Oil +0.8% at $45.48/brl; Sept Copper -0.3% at $2.66/lb
China Shenhua Energy,1088.HK To raise July spot coal prices by 5% to CNY600/ton - Chinese Press
(CN) PBOC skips open market operations (10th consecutive skip)
(CN) PBOC SETS YUAN MID POINT AT 6.7953 V 6.7922 PRIOR
(JP) Japan MoF sells ¥650B v ¥800B indicated in 0.8% (0.8% prior) 30-yr bonds; Avg yield: 0.8780% v 0.817% prior; Bid to cover: 3.62x
(MY) Malaysia sells MYR3.0B in 2024 bonds; avg yield 3.919%; bid-to-cover 2.88x
JGB 10-yr yield rises to 0.1% (1st time since mid-Feb)
Asia equities notable movers
Australia
Galaxy Resources, GXY.AU Production at Mt Cattlin exceeded target, +7.5%
Doray Minerals,DRM.AU Says mining at the underground Andy Well to be suspended on Nov 1st, -23%
Japan
Seven & I, 3382.JP To form an e-commerce and distribution tie up with Askul - Japan press; Askul +5.5%
Hong Kong/China
Gemdale Properties ,535.HK Reports June Contracted sales CNY6.33B, +92% y/y; +17%, over 2-year high
China New City Commercial Development ,1321.HK Discloses entered into the Placing Agreement for 260M shares – filing; +21.6%
US
COST Reports Jun SSS (ex gas) +6.5%; US SSS (ex gas) +6.3% v 3.9%e
US Session Highlights
US markets ended mixed, with the Dow slightly negative, while the NASDAQ bounced and handily outperformed that of the other major indices thanks to strength from tech. The focal point this afternoon was the release of the minutes from the FOMC's June meeting, which pointed to a divided Fed on when to begin the balance sheet runoff and on the outlook for inflation with its effect on the future path of rate hikes. Treasuries were mostly stronger, while the energy complex saw sellers emerge after the 8-day winning streak in oil prices came to an end. Outperformers on the day were tech and healthcare; laggards were energy and real estate.
Russia is said to oppose any deeper oil production cuts at the upcoming OPEC ministerial meeting on July 24th, reportedly believing further supply reductions so soon after the existing agreement was extended would send the wrong message to the oil market.
(US) President Trump lamented in an early morning tweet that “Trade between China and North Korea grew almost 40% in the first quarter. So much for China working with us - but we had to give it a try!” Later in the day, US Ambassador to the UN Haley indicated the US will propose new sanctions on North Korea in the coming days.
US markets on close: Dow 0.0%, S&P500 +0.2%, Nasdaq +0.7%
Best Sector in S&P500: IT
Worst Sector in S&P500: Energy
Biggest gainers: AMD +8.6%; MU +4.7%; PYPL +3.3%
Biggest losers: ORLY -18.9%; AAP -11.2%; AZO -9.6%
At the close: VIX 11.07 (-1.3%); Treasuries: 2-yr 1.41% (-0.5%), 10-yr 2.33% (-0.8%), 30-yr 2.85% (-0.5%)
US Dollar Trades Flat After FOMC Minutes
The US Federal Reserve released the meeting minutes from the June monetary policy. The minutes showed that Fed officials debated the plans on how to start shrinking the balance sheet in the coming months. The debate was also mixed with some of the officials noting that the Fed had adequately prepared the markets, while some participants said that more proof of inflationary pressures was required.
Overall, the meeting minutes showed a broadly positive tone from the central bank. The US dollar index closed positive but gave up most of the intraday gains.
In the UK, services PMI fell to 53.4, lower than the median expectations of 53.6 and down from 53.8 that was registered in May. The British pound did not react much to the data.
Looking ahead, the private payrolls data from ADP/Moody's will be released today. Economists polled are expecting a headline jobs report of 184k, lower than May's 253k. The weekly US unemployment claims and the ISM non-manufacturing PMI data will also be coming out later in the day.
EURUSD intraday analysis
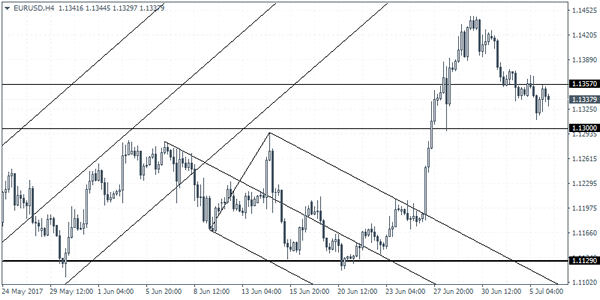
EURUSD (1.1337): The EURUSD extended the declines for three consecutive days after briefly breaking above the $1.1400 handle. Price action is currently seen consolidating near the 1.1357 level. Resistance is likely to be developed here which could push the currency pair towards 1.1300 in the near term. Below $1.1300, further declines could see EURUSD falling towards the support level at 1.1129. To the upside, considering the three day decline, if price action manages to stay supported above 1.1357, then we can expect some near-term gains back towards 1.1400 handle.
GBPUSD intraday analysis
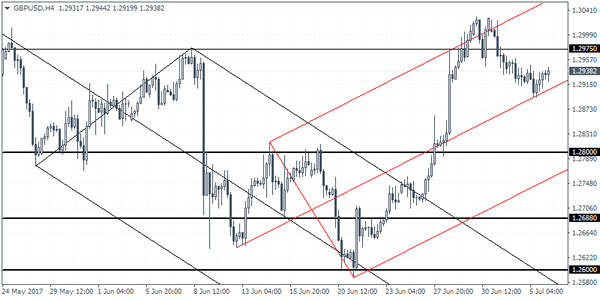
GBPUSD (1.2938): The British pound closed on a moderately positive note yesterday which comes after two days of declines. Therefore, a higher close above yesterday's high at 1.2948 will signal further upside in prices. Watch for the resistance level at 1.2975 to cap gains in prices. This could also potentially form a lower high in price. A reversal at 1.2975 will signal a decline back to the 1.2800 handle in the near term. With the PMI data released already from the UK, today's ADP payrolls and Friday's nonfarm payrolls report will be the key event to watch for.
AUDUSD intraday analysis
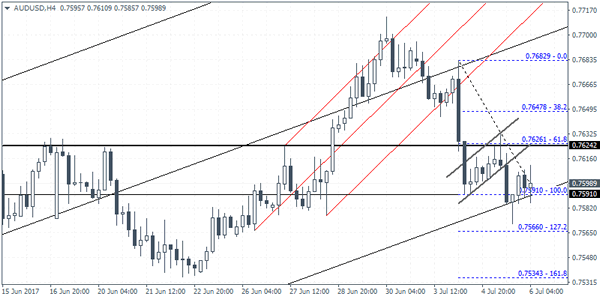
AUDUSD (0.7598): The Australian dollar continued its descent, but price action closed with a doji candlestick pattern yesterday after two days of declines. This could potentially signal a reversal or a temporary pause in price. On the 4-hour chart, price action has formed a bearish flag continuation pattern, but theprice fell to the lows of 0.7591 before consolidating at this level. In the near term, expect a bounce back to 0.7624 where resistance could be forming. A reversal from here could send AUDUSD down towards 0.7534 which marks the completion of the bearish flag pattern.