Sample Category Title
EUR/GBP Elliott Wave Analysis
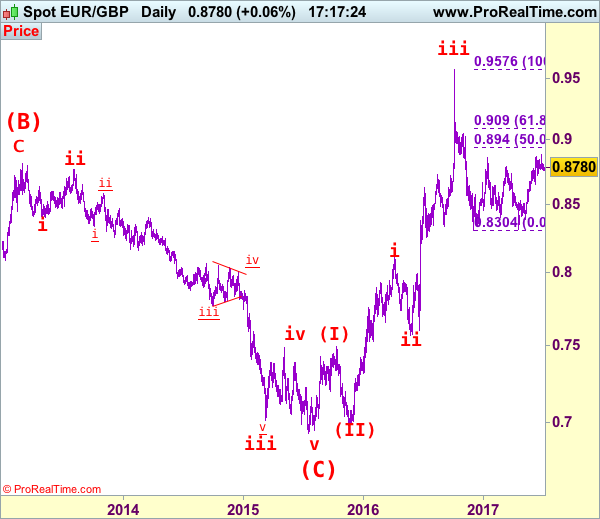
EUR/GBP – 0.8779
EUR/GBP – The major (A)(B)(C)-(X)-(A)(B)(C) correction from 0.9805 is unfolding and 2nd (A) has possibly ended at 0.6936.
As the single currency retreated after rising marginally to 0.8882 last week, retaining our view that consolidation below this level would be seen and initial downside risk is for pullback to support at 0.8719, however, still reckon downside would be limited and support at 0.8652 should hold, bring another rise later. Above said resistance at 0.8882 would signal the erratic rise from 0.8304 low is still in progress and may extend gain to 0.8940-50 (50% Fibonacci retracement of 0.9576-0.8304) but loss of upward momentum should prevent sharp move beyond 0.9000 psychological level and price should falter below 0.9090-00 (61.8% Fibonacci retracement) and bring retreat later.
Our latest preferred count is that the wave V of a 5-wave series from 0.5682 ended at 0.9805 earlier and major from there has possibly ended at 0.8067 as A-B-C-X-A-B-C. We are keeping our view that the entire correction from 0.9805 has possibly ended at 0.7756 and as labeled as the attached daily chart and impulsive move from 0.9084 has ended at 0.7756 as a 5-waver which marked either the (C) wave or the A leg of (C), a daily close above resistance at 0.8831 would suggest (C) leg has ended and headway towards 0.9084.
On the downside, whilst initial pullback to 0.8735-40 cannot be rule out, reckon 0.8680-90 would limit downside and bring another rise later. A daily close below support at 0.8652 would suggest top is possibly formed and risk weakness towards 0.8600-05 but reckon downside would be limited to 0.8550 and previous support at 0.8524 should hold from here, bring rebound later.
Recommendation: Buy at 0.8680 for 0.8880 with stop below 0.8580
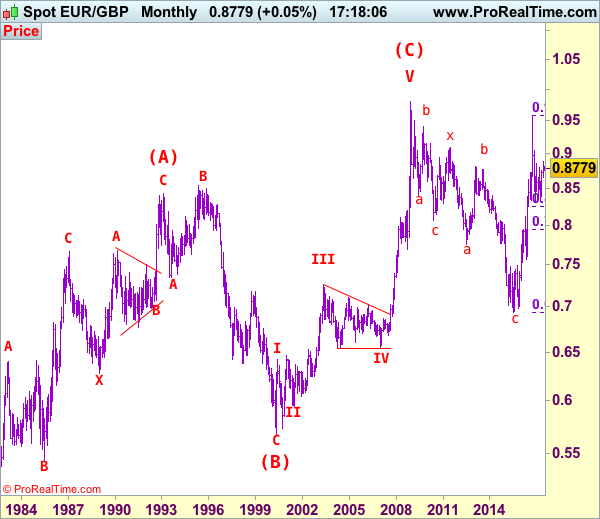
Euro's long term uptrend started in Feb 1981 at 0.5039 and is unfolding as a (A)-(B)-(C) move with (A): 0.8433 (Feb 1993), (B): 0.5682 (May 2000) and impulsive wave (C) should have ended at 0.9805 with wave III ended at 0.7254 (May 2003), triangle wave IV at 0.6536 (23 Jan 2007) and wave V as well as wave (C) has ended at 0.9805.
We are keeping an alternate count that only wave III ended at 0.9805 and the correction from there is the wave IV and may extend weakness to 0.7700, however, it is necessary to see a daily close above resistance at 0.9143 would change this to be the preferred count.
USD/CAD Elliott Wave Analysis
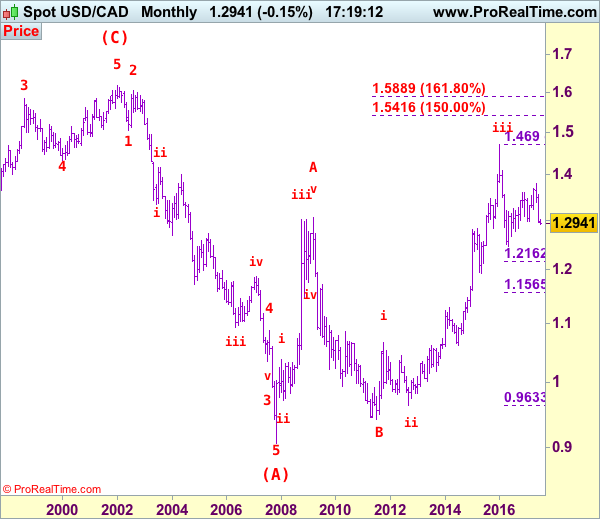
USD/CAD – 1.2943
USD/CAD – Wave v ended at 0.9407 and only wave (3) of c ended at 1.4690 and one more rise cannot be ruled out.
The greenback has remained under pressure after recent anticipated selloff, adding credence to our bearish view that the decline from 1.3794 top is still in progress and bearishness remains for weakness to 1.2900, break there would suggest the rebound from 1.2461 has ended at 1.3794 (tentatively wave b top), hence further weakness to 1.2850-55 would be seen but near term oversold condition should prevent sharp fall below previous support at 1.2763, risk from there has increased for a rebound later.
We are keeping our view that the wave b from 1.0657 (a leg top) has possibly ended at 0.9633 with (a): 0.9800, wave (b): 1.0447 and wave c at 0.9633, the subsequent rise from there is now treated as wave c exceeded indicated upside target at 1.3770-80 and 1.4000 and wave (3) has possibly ended at 1.4690 and wave (4) correction has commenced for retracement back to 1.2832 support, then 1.2410-20.
On the daily chart, our latest preferred count remains that the A of (B) rally from 0.9059 low (7 Nov 2007) unfolded into an impulsive wave with i: 0.9059-1.0380, ii ended at 0.9819, iii at 1.3019 followed by triangle wave iv at 1.2026 , then wave v formed a top at 1.3066 and also ended the wave A. The wave B is unfolding as an double three a-b-c-x-a-b-c and is sub-divided as a: 1.2192, b: 1.2716 and wave c at 1.0784, followed by wave x at 1.1725, another set of a-b-c unfolded with 2nd a at 0.9931, 2nd b at 1.0674. the 2nd c has possibly ended at 0.9407, therefore, consolidation with upside bias is seen for major correction, indicated target at 1.3900 had been met and gain to 1.4700 would follow.
On the upside, whilst initial recovery to 1.3040-45 cannot be ruled out, reckon upside would be limited to previous support at 1.3165 (now resistance) and bring another decline later. Above 1.3260-65 would defer and risk a stronger rebound to 1.3300 but said resistance at 1.3348 would remain intact, bring another decline later.
Recommendation: Sell at 1.3150 for 1.2950 with stop above 1.3250.

Longer term - The selloff from 1.6194 (21 Jan 2002) to 0.9059 (07 Nov 2007) is viewed as (A) wave which is a 5-waver as labeled on the monthly chart as below, the subsequently rally is labeled as (B) with impulsive A leg of (B) ended at 1.3066, wave B of (B) is unfolding which has either ended at 0.9407 or would extend one more fall but downside should be limited to 0.9200 and 0.9000 should hold.
XAU/USD Analysis: Reveals Short Term Trend
On Thursday morning the yellow metal still traded near the 1,225 mark. However, the main difference, compared to the Wednesday’s trading session was that the commodity price was being supported by the 55-hour SMA, which was located just below the 1,225 level. Meanwhile, the 100-hour SMA was moving in on the commodity price from the just above the 1,231 level. Although, a new discovery was made on Thursday morning. The possible borders of a short term ascending channel have been drawn. If the yellow metal continues to trade in the drawn borders, the commodity price will not reach above the 1,230 mark. The hypothesis might become stronger, as the 100 and 200-hour SMAs move downwards and the 55-hour moving average would decline down to the 1,220 level.
USD/JPY Analysis: Unchanged From Wednesday
The US Dollar appreciated strongly against the Yen on Wednesday morning, reaching intraday high circa 113.60. Nevertheless, it had lost most of its gains by late evening and, thus, started this session at a relatively similar level as yesterday. Subsequently, the rate was supported by the 100-hour SMA near the 112.94 mark prior to testing a resistance cluster formed by the 20– and 55-hour SMAs. It is possible that the rate approaches the monthly R1 at 113.94 in the upcoming hours. However, the rate’s general movement sideways during the past three sessions suggests that some changes may occur in the nearest time. In general, the rate is likely to remain within the boundaries of the current channel if today’s fundamentals from the US do not change this technical information substantially.
EUR/USD Analysis: Remains Below 1.1350 Mark
The common European currency is trading against the US Dollar as expected. The pair surged on Wednesday and hit the resistance put up by the 55-hour SMA just above the 1.1350 mark. As a result of that, a retreat began, which has been stalled by the support of the monthly PP at the 1.1331 level. However, the pair is still set to decline due to various reasons. First of all the 55-hour SMA continues to move lower, as it is strengthening the resistance of the weekly PP. Secondly, the currency exchange rate has passed the support of the 200-hour SMA, which on Thursday morning was providing resistance. Moreover, the 200-hour SMA near the 1.1340 level managed to hold off any attempted rebounds by the Euro against the Greenback. Due to that a fall down to the 1.1250 mark can be expected.
GBP/USD Analysis: Finds Support At Weekly PP
After bouncing off the lower channel boundary, the Pound appreciated gradually against the US Dollar on Wednesday. Bulls pushed the rate through the upper channel boundary, the weekly PP and the 55 and 20-hour SMAs, adding to the overall bullish sentiment. Other technical indicators have likewise turned bullish, thus favouring further upward potential. Upside risks should prevail in this session; however, the scope of the given outcome is yet unclear. By and large, the Pound is likely to be supported by the 55-hour SMA. An immediate support to the upside is the 100-hour SMA near the 1.2960 mark. In case this level is surpassed, the upside target for today may be the June high at 1.3030, as no other resistance is located in between these levels.
Elliott Wave Analysis: EURUSD Trading In A Minimum Reversal Lower
EUR/USD can be trading at the beginning of a minimum three wave reversal from the top as market show us an evidences of a top around 1.1445. The reason for a temporary bearish bias is an impulsive intraday decline that can belong to a bigger sell-off which can take the pair back beneath 1.1280. If NFP tomorrow will prove to be positive for the USD then pair can fall much lower, within a context of a higher degree triangle pattern as shown on a daily chart.
EURUSD, 4H
Trade Idea: GBP/USD – Buy at 1.2835
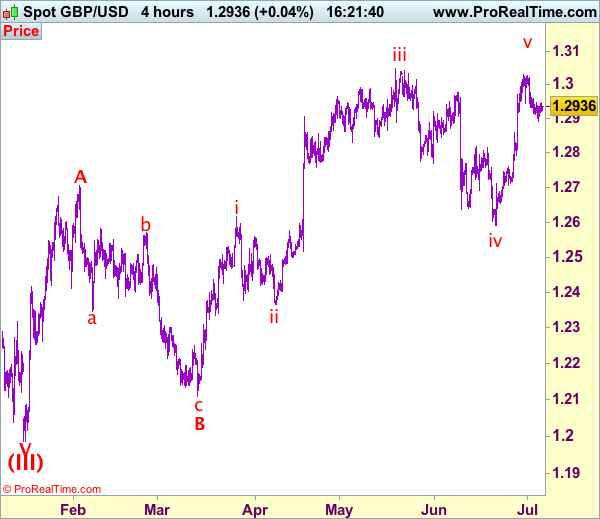
GBP/USD – 1.2929
Recent wave: Wave V of larger degree wave (III) has ended at 1.1986 and major correction has commenced from there for gain to 1.3000 and 1.3140-50
Trend: Near term up
Original strategy :
Buy at 1.2835, Target: 1.3000, Stop: 1.2800
Position: -
Target: -
Stop: -
New strategy :
Buy at 1.2835, Target: 1.3000, Stop: 1.2800
Position: -
Target: -
Stop:-
Although sterling recovered after falling to 1.2893 yesterday, reckon upside would be limited to 1.2975-80 and near term downside risk remains for the retreat from 1.3030 to bring retracement of recent rise, below said support at 1.2893 would extend weakness to previous resistance at 1.2861 (now support), however, reckon 1.2830-35 (50% Fibonacci retracement of 1.2640-1.3030) would limit downside and bring another rise later, above 1.3000 would bring test of said resistance at 1.3030, break there would extend the rise from 1.2589 low towards recent high at 1.3048 but break there is needed to retain bullishness and bring subsequent headway towards 1.3090-00.
Our preferred count on the daily chart is that cable's rebound from 1.3500 (wave (A) trough) is unfolding as a wave (B) with A ended at 1.7043, followed by triangle wave B and wave C as well as wave (B) has ended at 1.7192, the subsequent selloff is the larger degree wave (C) which is still unfolding with minor wave (III) of larger degree wave 3 ended at 1.1986, hence wave (IV) correction is in progress which could either be a triangle wave (IV) of a complex formation but upside should be limited to 1.3500 and price should falter well below 1.4000, bring another decline in wave (V) of 3 for weakness to 1.1500, then 1.1200.
On the downside, whilst initial pullback to 1.2900 is likely, reckon 1.2861 (previous resistance turned support) would limi downside and 1.2830-35 should hold, bring such a rise. Below support at 1.2794 would abort and signal top is formed instead, risk further fall to 1.2750, then towards 1.2706 support.
Technical Outlook: USDJPY Is Awaiting US Data For Break Out Of Current Congestion
The pair failed to clear strong 113.50 barrier for the third time, as Wednesday's spike to 113.68 high was short-lived. Long-legged Doji candle was left on Wednesday, signaling strong indecision, however dips remain limited and contained by rising 7SMA for now.
Near-term action is holding within 112.80/113.68 range and awaiting stronger direction signal which would be generated by a number of important US data due today and Friday.
Studies on daily chart are bullish while overbought slow stochastic warns of correction (the indicator was holding within narrow range, in and out of overbought zone but without firmer bearish signal for now.
Initial signal of pullback will be generated on sustained break below 112.80 (base of three-day congestion) and violation of rising 10 SMA at 112.55 (also Fibo 23.6% of 108.80/113.68 upleg) for extension towards strong support at 111.80 (Fibo 38.2% / 100SMA) break of which will confirm reversal.
At the upside, eventual close above 113.50 pivot would signal bullish continuation towards 114.00 and 114.36 targets.
Res: 113.50, 113.68, 114.00, 114.36
Sup: 113.05, 112.80, 112.55, 111.80
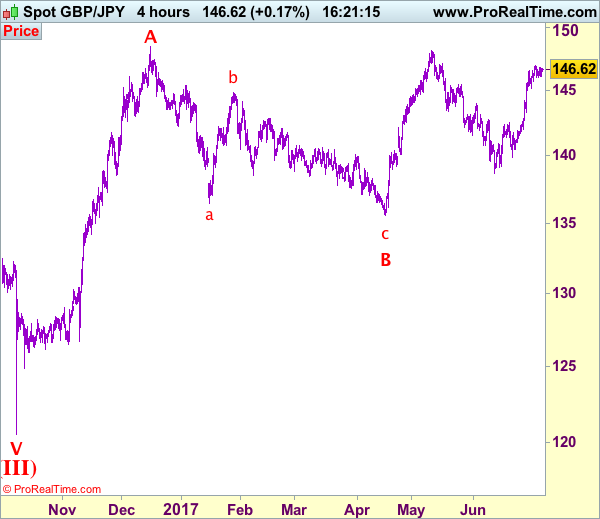
Trade Idea: GBP/JPY – Buy at 145.15
GBP/JPY - 146.40
Recent wave: Medium term low formed at 120.50 and (A)-(B)-(C) major correction has commenced with (A) leg ended at 148.45, hence wave (B) is unfolding for retreat to 131.00-10.
Trend: Near term up
Original strategy:
Buy at 145.15, Target: 147.15, Stop: 144.55
Position: -
Target: -
Stop: -
New strategy :
Buy at 145.15, Target: 147.15, Stop: 144.55
Position: -
Target: -
Stop:-
As sterling has continued trading with a firm undertone after recent rally, adding credence to our bullish count for the upmove to extend further gain to 147.10 (previous resistance), having said that, loss of near term upward momentum should prevent sharp move beyond 147.50-60 and price should falter below recent high at 148.10, risk from there is seen for a retreat later.
In view of this, would not chase this rise here and we are looking to buy sterling on subsequent pullback as support at 145.15 should limit downside. Below 144.60-70 would defer and risk test of previous resistance at 144.20, break there would abort and signal a temporary top is formed, bring correction of recent rise to 143.90-00 but support at 143.30 should remain intact.
Our preferred count is that larger degree wave V with circle is unfolding from 251.12 with wave (I) 219.34, (II): 241.38 and wave (III) is subdivided into 1: 192.60, 2: 215.89 (23 Jul 2008) and wave 3 ended at 118.87 earlier in 2009. The correction from there to 162.60 is wave 4 which itself is a double three and is labeled as first a-b-c ended at 151.53, followed by wave x at 139.03, 2nd a ended at 162.60, 2nd b at 146.75 and 2nd c leg of wave 4 ended at 163.00. Therefore, the decline from 163.00 to 116.85 is now treated as wave 5 which also marked the end of larger degree wave (III), hence wave (IV) major correction has commenced for retracement of the wave (III) from 241.38 and upside target at 183.95-00 (50% Fibonacci retracement of the wave (II) from 241.38) had been met, a drop below 160.00 would suggest wave (IV) has ended at 195.85, bring decline in wave (V) for initial weakness to 130 (already met) and 120.