Sample Category Title
Technical Outlook: WTI Oil Bounced From Wed’s Low, Eyes Crude Inventories For Fresh Signal
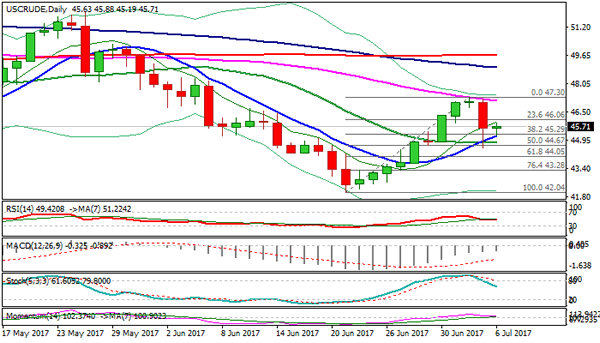
WTI oil is holding near $46 barrier on Thursday after sharp fall on Wednesday hit low at $44.51, but bounced quickly after report from American Petroleum Institute showed larger than expected drawdown in crude inventories (5.7 mln bls draw vs forecasted 1.6 mln barrels draw).
Wednesday's close above $45.29 (cracked Fibo 38.2% level of $42.04/$47.30 upleg) eased growing downside pressure on formation of reversal pattern on daily chart.
However, risk of fresh weakness remains in play as near-term studies weakened on Wednesday's fall. Recovery from $44.51 low needs break and close above $46.23 (Fibo 61.8% of $47.30/$44.51 pullback) to confirm reversal.
Today's release of US EIA weekly crude stocks is in focus for fresh signal. Forecast is for 2.3 mln bls draw (compared to 0.11 mln bls build last week) which would further support oil prices on release at / above forecasted level.
Rising 10SMA underpins today's action (currently at $45.18) followed by 20SMA ($44.80), close below which will be bearish.
Res: 45.91, 46.23, 46.64, 47.00
Sup: 45.18, 44.80, 44.51, 44.05
Fed Minutes Reveal A Divided Committee
Yesterday, the minutes from the latest FOMC meeting showed that policymakers, despite agreeing on raising the Federal funds rate, were split on the outlook for inflation, how it might affect the future pace of interest rates, and when they should start normalizing the Bank's enormous balance sheet. Specifically, most participants viewed the recent softness in prices as reflecting idiosyncratic factors, while others expressed concerns that this weakness may persist. Officials generally reiterated their support for continuing a gradual approach to raising the federal funds rate. However, a few members expressed concerns that the current rate path projections might prove inconsistent with a sustained return of inflation to 2%. On the B/S front, several officials supported beginning its normalization in a couple of months, while others suggested deferring until later this year.
As for the greenback, the initial reaction was a slight decline on the divided Committee and the lack of any clear signals with regards to B/S norm and the next hike. Nevertheless, the currency bounced quickly to recover the losses and even traded higher in the following minutes.
EUR/USD continues to trade between the support of 1.1300 (S1) and the resistance of 1.1380 (R1). Given that the rate is still trading above 1.1300 (S1), which acted as the upper bound of the sideways range that contained the price action from the 19th of May until the 27th of June, we maintain the view that the near-term outlook remains positive and that the latest slide from near 1.1450 (R2) is just a corrective phase. If the bulls take advantage of the 1.1300 (S1) territory, we would expect them to drive the battle above 1.1380 (R1), something that may open the way for another test near the 1.1450 (R2) zone. A clear break above that obstacle would confirm a forthcoming higher high on the daily chart and perhaps signal the resumption of the prevailing medium-term uptrend.
Now the focus for USD traders shifts to incoming US data and specifically, to the US employment report tomorrow, and the CPI data due out next week. A robust jobs report and a decent rebound in the nation's core inflation rate is needed to bring forth market expectations with regards to the next hike, which remained unaffected by the minutes and still price in the next increase to come in March 2018.
WTI tumbles as Russia opposes deeper output cuts; OPEC exports rose in June
WTI tumbled yesterday on sources that Russia will oppose attempts for deeper production cuts and that it is also against any extension of the cut deal. The climb in OPEC exports for June added fuel to that decline. WTI fell below the support (now turned into resistance) of 46.50 (R1) and the short-term uptrend line taken from the 26th of June, to hit support at 44.65 (S2). Then, the price rebounded back above 45.35 (S1) after the American Petroleum Institute showed that US crude inventories fell by 5.8 million barrels in the week ended on the 30th of June.
In our view, yesterday's tumble changes the short-term outlook to flat for now and turns investors' attention to the Energy Information Administration (EIA) report later today. The EIA is forecast to report a fall in crude inventories of about 2.8million barrels, which may encourage the bulls to treat yesterday's slide as a corrective phase and perhaps drive the price back above 46.50 (R1). Such a break may open the way for another test near the 47.50 (R2) zone.
Overall though, we remain sceptical with regards to the establishment of a healthy longer-term uptrend in oil prices. As we noted several times, we expect any potential recovery to remain capped by the 51.00-55.00 range, where we believe US shale producers may be attracted to increase production.
As for today's events:
During the European morning, the calendar is relatively light. The only release that could attract some attention are the minutes from the ECB's June policy meeting. Even though these are usually not a major market mover, considering the signals that we got at that meeting and afterwards, we could see some reaction in the euro.
In the US, the ADP employment report for June will be in focus. The forecast is for the private sector to have added 185k jobs, less than the 253k print in May. Nevertheless, this would still be a decent print and if met, it may increase speculation that Friday's NFP will also meet its forecast of 179k. Having said that, we have to sound a note of caution. Even though this is the only major gauge of the NFP, the correlation of the two numbers has fallen notably during the last few months.
The ISM non-manufacturing PMI for June is also coming out. Expectations are for the index to have slid somewhat, but given the upside surprise in the ISM manufacturing print, we would stay mindful that the service sector may also have performed better than anticipated. Initial jobless claims for the week ended on the 30th of June and the nation's trade balance for May are due out as well.
As for the speakers, we have three on the agenda: ECB Executive Board member Peter Praet, San Francisco Fed President John Williams, and Fed Board Governor Jerome Powell.
EUR/USD
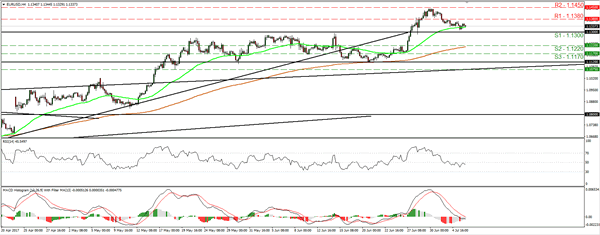
Support: 1.1300 (S1), 1.1220 (S2), 1.1170 (S3)
Resistance: 1.1380 (R1), 1.1450 (R2), 1.1500 (R3)
WTI
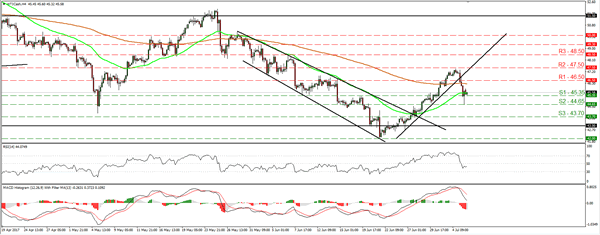
Support: 45.35 (S1), 44.65 (S2), 43.70 (S3)
Resistance: 46.50 (R1), 47.50 (R2), 48.50 (R3)
Euro Remains Subdued, ECB Minutes Next
The euro has ticked higher in the Thursday session. Currently, the pair is trading at 1.1350. On the release front, German Factory Orders gained 1.0%, well short of the forecast of 1.9%. Today's highlight is the minutes from the ECB's policy meeting in June. In the US, the focus is on employment data, with the release of ADP Nonfarm Payrolls, which are expected to plunge to 184 thousand. We'll also get a look at unemployment claims and ISM Non-Manufacturing PMI. On Friday, there are three key employment events – Average Hourly Earnings, Non-Farm Employment Change and the unemployment rate. As well, the Federal Reserve will release its semi-annual Monetary Policy Report.
The euro surged last week, after the markets interpreted Mario Draghi's comments at the ECB forum as a signal that the ECB was planning to wind down its asset-purchase program (QE). The ECB then beat a hasty retreat, saying that the markets had “misjudged” Draghi's comments. The ECB is back on center stage later on Thursday, with the release of the ECB minutes from the July policy meeting. Will the minutes have the same galvanizing effect on the currency? Investors will be monitoring closely. If there are any hints that the ECB is moving closer to exiting the QE scheme, the euro rally could resume.
The ECB will hold a policy meeting on July 20, but last week's “Draghi rally”, where the euro soared 2.0%, has meant that policymakers will need to reassess what message it chooses to send to the markets. In June, the bank removed an easing bias regarding interest rates, effectively closing the door to further rate cuts. However, policymakers may now be wary about removing a second easing bias regarding the asset-purchase program, to avoid another run on the euro. The rate announcement will be followed by a Draghi press conference, but it could well be a case of “once bitten twice shy” for the ECB head after last week's rally. This could result in the ECB reiterating that the economy is headed in the right direction, but QE will remain in place until inflation levels move higher.
The dollar shrugged off the release of the Fed's June policy meeting, which didn't provide any clarity about the Fed's plans. The minutes pointed to a divided Fed over the key issues of inflation and the Fed's bloated balance sheet. Some members expressed unease at the Fed's current forecast of rate hikes, given the persistently low levels of inflation. According to the current “dot plot”, the Fed expects to raise rates in December, and three times in 2018. There was also division over the timing of reducing the $4.2 trillion balance sheet – some policymakers were in favor of starting in September, while others preferred later in the year. At the June meeting, the Fed stated that it would begin reducing the balance sheet this year, but provided no details. Analysts expect the Fed to start winding down the balance sheet in September, prior to a rate hike in December. The markets are lukewarm about a rate hike in December, with the odds at just 50%, according to the CME Group.
Gold Bearish Bias Below The Cloud, Neutral Medium-Term Outlook
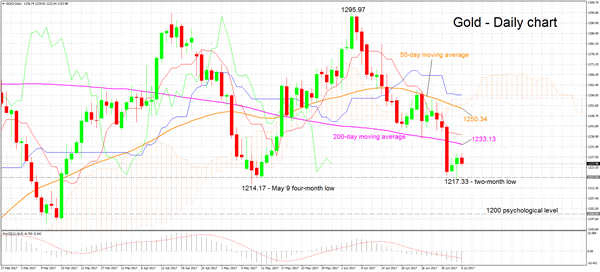
Gold has been in a downtrend since early June. The precious metal currently trades below the Ichimoku cloud while it hit a near two-month low of 1217.33 in yesterday's trading.
Turning to the Ichimoku analysis, the negative alignment when the Tenkan-sen line (red) crossed below the Kijun-sen line (blue) in late June is still in place. This negative short-term signal is also supported by the MACD. Specifically, the indicator is below zero, as well as below its red signal line.
If the price advances, a barrier to the upside might be formed by the 200-day moving average (MA) and Tenkan-sen line, currently spanning from 1233.13 to 1237.66. Further up, additional resistance could be provided by the 50-day MA and cloud top, ranging from 1250.34 to 1252.05.
On the downside, yesterday's low of 1217.33, combined with the near four-month low of 1214.17 from May 9, might offer support. If this area is violated, the focus would shift to the area around the 1200 psychological level for additional support.
Regarding the medium-term picture, it currently looks neutral with the price ranging sideways since the start of the year.
Overall, the short-term outlook is bearish and the medium-term is neutral.
Daily Technical Analysis: USD/CAD Follows The EMA89 Slope
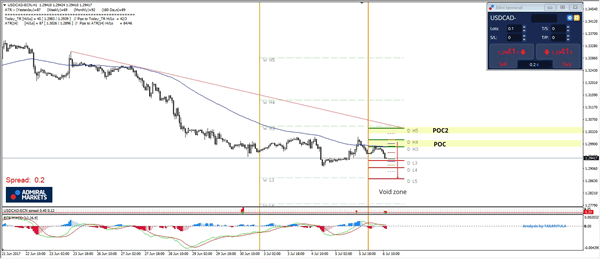
If you had signed up for my Live Trading Webinar that is exclusive with Admiral Markets, you could've seen how the USD/CAD rejected perfectly from 2 POC zones where both market orders were triggered. The pair is still going down and in the case of any spike to the upside pay attention again to POC 1.2990-1.3005 (D H4, ATR pivot, EMA89) and eventually POC2 1.3035-50 (D H5, W H3, descending trend line, ATR high) where price could reject again. At this point the price is below W H3 and D H3, which signifies a strong downtrend. Continuation below yesterday's low (1.2912) aims for 1.2895 and 1.2869. Below it is a void zone, where we could see hardly any support all the way down to 1.2780.
GOLD Ready To Bounce Back Above 1214, SILVER Continued Decline, CRUDE OIL Profit-Taking After The Strong Increase.
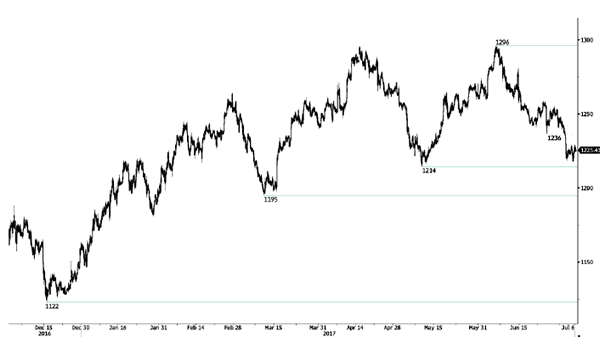
GOLD Ready to bounce back above 1214.
Gold's is trading sideways. The commodity has broken hourly support located at 1236 (26/06/2017 low). Stronger support is given at 1214 (09/05/2017 low). Hourly resistance can be found at 1258 (23/06/2017 high). Expected to show further monitoring of support at 1214.
In the long-term, the technical structure suggests that there is a growing upside momentum. A break of 1392 (17/03/2014) is necessary ton confirm it, A major support can be found at 1045 (05/02/2010 low).
SILVER Continued decline.
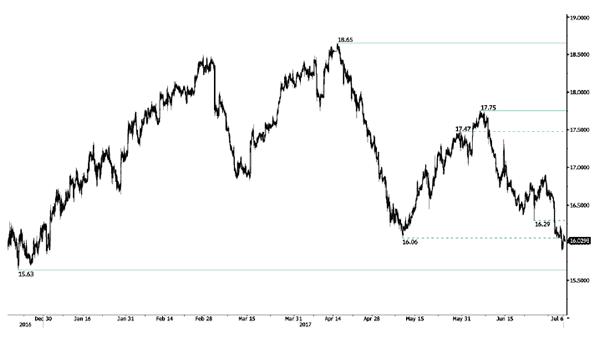
Silver's short-term decline should continue until support at 15.63 (27/12/2016 low). Key resistance is given at a distance at 17.75 (06/06/2017 high). The road seems wide open for further decline.
In the long-term, the death cross indicates that further downsides are very likely. Resistance is located at 25.11 (28/08/2013 high). Strong support can be found at 11.75 (20/04/2009).
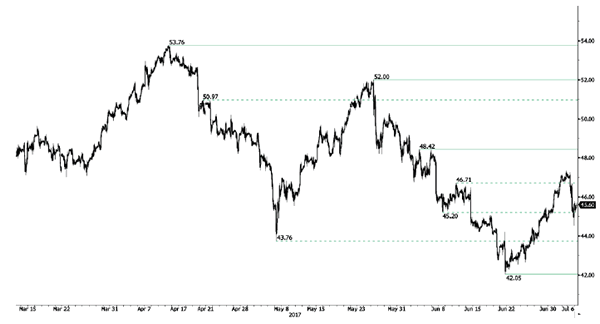
CRUDE OIL Profit-taking after the strong increase.
Crude oil is back to bearish again. Support is given at 42.05 (21/06/2017 low). Expected to show renewed weakness.
In the long-term, crude oil has recovered after its sharp decline last year. However, we consider that further weakness are very likely. Strong support lies at 35.24 (05/04/2016) while resistance can now be found at 55.24 (03/01/2017 high).
EUR/JPY Stalling Below 129.00, EUR/GBP Low Volatility And Sideways Price Action, EUR/CHF Important Selling Pressures Around At 1.0960.
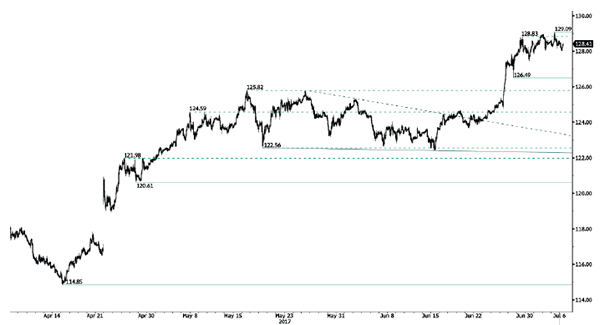
EUR/JPY Stalling below 129.00.
EUR/JPY is trading below 129. Yet, the pair is testing this resistance area. Hourly support can be found at 127.10 (30/06/2017). Next support is given at 122.56 (18/05/2017 low). Further upside is favored.
In the longer term, the technical structure validates a medium-term succession of lower highs and lower lows. As a result, the resistance at 149.78 (08/12/2014 high) has likely marked the end of the rise that started in July 2012. Strong support at 94.12 (24/07/2012 low) looks nonetheless far away.
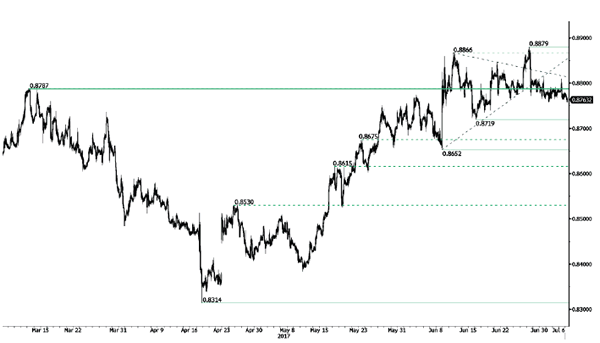
EUR/GBP Low volatility and sideways price action.
EUR/GBP has broken downtrend resistance triggering a move lower. Hourly support is given at 0.8719 (16/06/2017 low). Expected to show continued weakness.
In the long-term, the pair has largely recovered from recent lows in 2015. The technical structure suggests a growing upside momentum. The pair is trading above from its 200 DMA. Strong resistance can be found at 0.9500 psychological level.
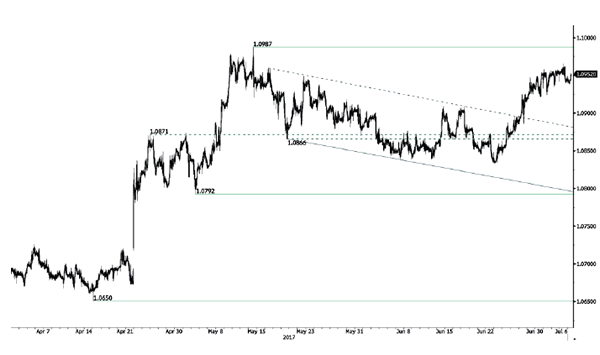
EUR/CHF Important selling pressures around at 1.0960.
EUR/CHF's short-term bullish pressures are now fading on after clear break of downtrend channel. Hourly support is located at a distance at 1.0792 (03/05/2017 low). Hourly resistance is given at 1.0987 (12/05/2017 high). Expected to inch higher.
In the longer term, the technical structure is mixed. Resistance can be found at 1.1200 (04/02/2015 high). Yet,the ECB's QE programme is likely to cause persistent selling pressures on the euro, which should weigh on EUR/CHF. Supports can be found at 1.0184 (28/01/2015 low) and 1.0082 (27/01/2015 low).
USD/CHF Ready For Another Leg Lower, USD/CAD Starting A Short-Term Consolidation, AUD/USD Ready For Another Leg Higher.
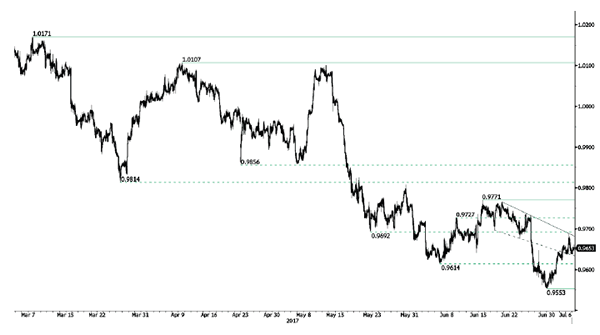
USD/CHF Ready for another leg lower.
USD/CHF is pushing lower. Hourly resistance can be found at 0.9771 (09/06/2017 high). Strong resistance is given at 1.0107 (10/04/2017 high). Hourly support is given at 0.9553 (30/06/2017 low). Expected to show bearish pressures.
In the long-term, the pair is still trading in range since 2011 despite some turmoil when the SNB unpegged the CHF. Key support can be found 0.8986 (30/01/2015 low). The technical structure favours nonetheless a long term bullish bias since the unpeg in January 2015.
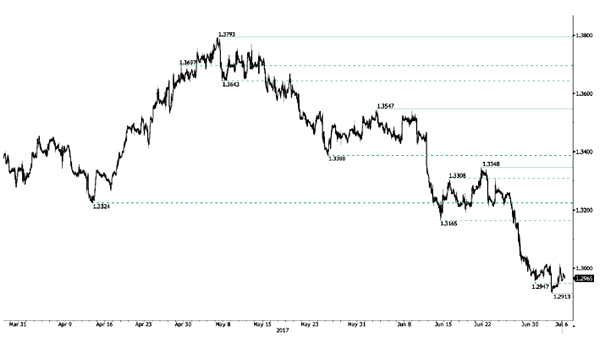
USD/CAD Starting a short-term consolidation.
USD/CAD is way into bearish mode. Support given at 1.2913 (04/07/2017 low). Resistance is located at 1.3014 (02/15/2017). Expected to show continued downside pressures.
In the longer term, the pair lies in a bullish channel since a year. Strong resistance is given at 1.4690 (22/01/2016 high). Long-term support can be found at 1.2461 (16/03/2015 low).
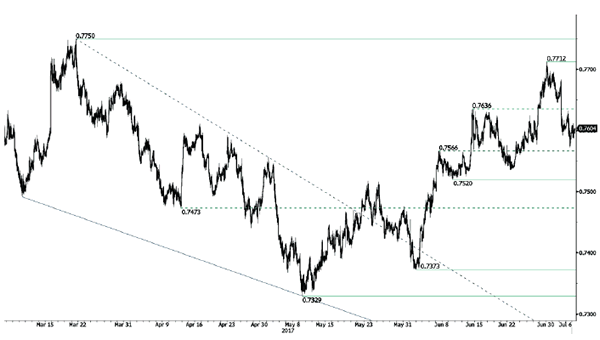
AUD/USD Ready for another leg higher.
AUD/USD's technical structure is bullish since early May. The pair should further head towards resistance at 0.7712 (30/06/2017 high). However, a break of support at 0.7520 (09/06/2017 low) would nonetheless indicate a trend reversal.
In the long-term, we are waiting for further signs that the current downtrend is ending. Key supports stand at 0.6009 (31/10/2008 low) . A break of the key resistance at 0.8295 (15/01/2015 high) is needed to invalidate our long-term bearish view.
EUR/USD Continued Bearish Consolidation, GBP/USD Short-Term Selling Pressures Fade, USD/JPY Riding Within Symmetrical Triangle.
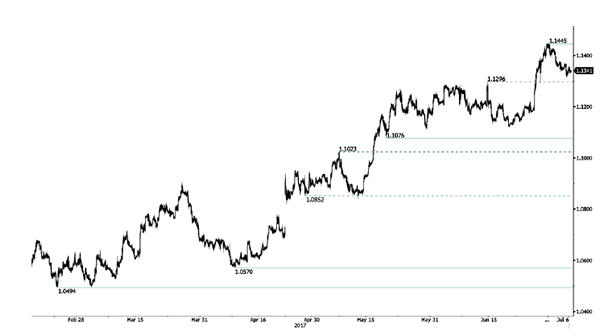
EUR/USD Continued bearish consolidation.
EUR/USD is still in a consolidation phase after its recent rally above 1.1400. Hourly support can be found at 1.1292 (28/06/2017 low). Stronger support lies at 1.1076 (18/05/2017 low).
In the longer term, the momentum is clearly negative. We favour a continued bearish bias towards parity. Key resistance holds at 1.1714 (24/08/2015 high) while strong support lies at 1.0341 (03/01/2017 low).
GBP/USD Short-term selling pressures fade.
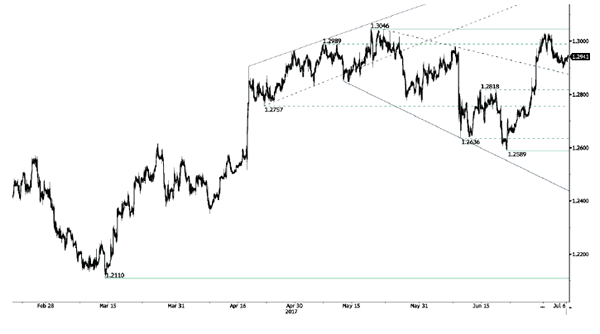
GBP/USD is still consolidating. The pair failed to monitor resistance given at 1.3046 (18/05/2017 high). The road is wide-open for further weakness.
The long-term technical pattern is even more negative since the Brexit vote has paved the way for further decline. Long-term support given at 1.0520 (01/03/85) represents a decent target. Long-term resistance is given at 1.5018 (24/06/2015) and would indicate a long-term reversal in the negative trend. Yet, it is very unlikely at the moment.
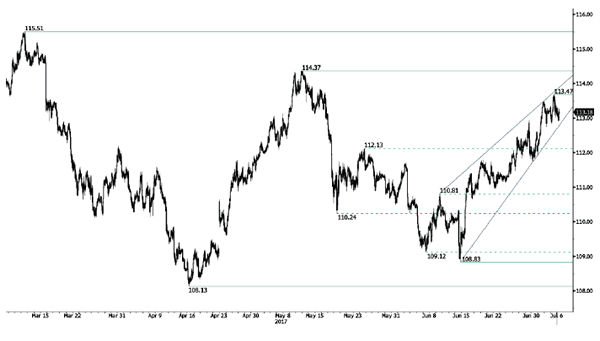
USD/JPY Riding within symmetrical triangle.
USD/JPY is riding within symmetrical triangle. Hourly resistance can be found at 113.47 (03/07/2017 high). Hourly support can be found at 111.73 (30/06/2017 low). Strong support is located at 108.13 (17/04/2017 low). Expected to show continued bullish pressures within symmetrical pressures.
We favor a long-term bearish bias. Support is now given at 96.57 (10/08/2013 low). A gradual rise towards the major resistance at 135.15 (01/02/2002 high) seems absolutely unlikely. Expected to decline further support at 93.79 (13/06/2013 low).
Technical Outlook: AUDUSD – Thursday’s Long-Legged Doji Shows Indecision But No Firmer Signals Of Correction End So Far
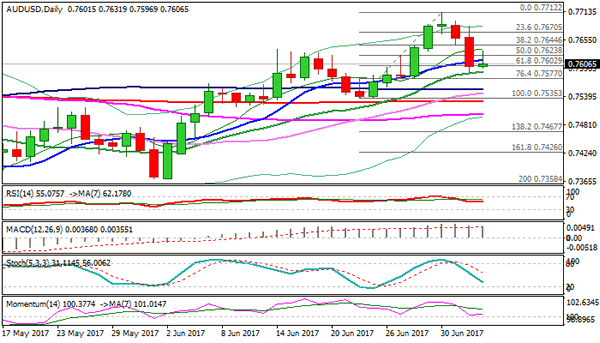
The Aussie is probing back above 0.7600 handle on Friday after dipping to 0.7585, supported by upbeat Australian trade data.
The pair is attempting to stabilize after steep pullback in past three days bottomed at 0.7577 and Thursday's trading was shaped in long-legged Doji candle, signaling strong indecision.
Despite dips below strong 0.7600 support, the pair did not close below it in past two sessions, keeping in play hopes of ending corrective action from 0.7712 peak and reversal.
Scenario sees close above 0.7624 (Fibo 38.2% of 0.7712/0.7571 pullback / 10 SMA) as minimum requirement for reversal signal.
Bullish extension above 0.7658 (Fibo 61.8%) is needed to confirm.
Otherwise, downside is expected to remain at risk while the price continues to hover around 0.7600 pivot, with sustained break lower to signal fresh extension of bear-leg from 0.7712 and open a cluster of MA supports between 0.7551 and 0.7505 (100SMA / 200SMA / 55SMA, including 0.7535 higher base) with daily cloud top reinforcing support at 0.7505.
Res: 0.7624, 0.7641, 0.7658, 0.7682
Sup: 0.7585, 0.7571, 0.7551, 0.7535