Sample Category Title
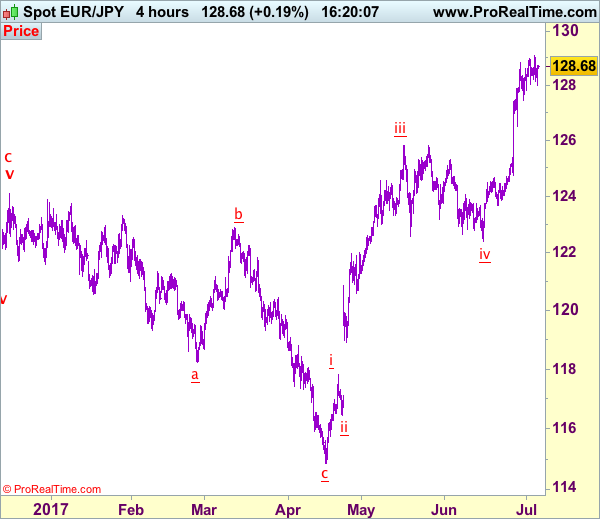
Trade Idea: EUR/JPY – Buy at 127.00
EUR/JPY - 128.51
Recent wave: wave v of (C) ended at 94.12 and major correction in wave A has ended at 149.79
Trend: Near term up
Original strategy:
Buy at 127.00, Target: 129.00, Stop: 126.40
Position: -
Target: -
Stop: -
New strategy :
Buy at 127.00, Target: 129.00, Stop: 126.40
Position: -
Target: -
Stop:-
Euro’s retreat after brief rise to 129.09 (yesterday’s high) suggests consolidation below this level would be seen and pullback to 128.00, then 127.50 is likely, however, reckon 127.00 would limit downside and bring another rise later, above said resistance at 129.09 would extend recent upmove to 129.50-60 but loss of near term upward momentum should prevent sharp move beyond psychological resistance at 130.00, risk from there has increased for a retreat to take place later.
In view of this, we are looking to reinstate long on pullback as 127.00 should limit downside. Below support at 126.49 would defer and suggest top is possibly formed, risk correction to 126.00 and later towards 125.40-50.
Our latest preferred count is that wave (ii) is ABC-X-ABC which ended at 123.33 and wave (iii) is unfolding with wave iii ended at 100.77, followed by wave iv at 111.57 and wave v as well as the wave (iii) has ended at 97.04, followed by wave (iv) at 111.43 and wave (v) has ended at 94.12 which is also the end of the larger degree v, this also implied the major wave (C) has also ended there, hence major correction has commenced from there with (A) leg unfolding in its lower degree wave c which has possibly ended at 145.69. Under this count, A-B-C wave (B) has commenced with A leg ended at 136.23, wave B at 143.79 and wave C has possibly ended at 149.79.
Our larger degree count is that the decline from 139.26 is wave (C) and is sub-divided into a diagonal triangle i-ii-iii-iv-v with wave i - 105.44, wave ii- 123.33, wave iii - 97.03, wave iv - 111.43, followed by the final wave v as well as the end of wave (C) at 94.12, this also mark the bottom of larger degree wave B. Under this count, major rise in wave C has commenced as an impulsive wave with minor wave III ended at 145.69, wave V is still in progress for further gain to 150.00. Having said that, this so-called wave V could well be the first leg of larger degree 5-waver wave C and this wave C should bring at least a retest of wave A top at 169.97 (July 2008).
FOMC Minutes Show Split Committee Amid Weak Inflation
Fed minutes leave markets hopeless
Investors were impatiently waiting for clues about the Fed's thinking. Quite the contrary, the minutes of the last FOMC meeting showed a highly-divided committee, increasing the overall uncertainty about the timing of the next interest rate hike and the beginning of balance sheet unwinding programme.
The committee noticed that the labour market continued to strengthen together with the economic activity, the latter improving at a moderate pace though. FOMC members acknowledged both headline and core inflation measures came in below their anticipation but “viewed the recent softness in these price data as largely reflecting idiosyncratic factors” and added that it will have little bearing effect on the medium-term. However, some participants appeared quite concerned about the downside risk in inflation and raised doubts about reaching the 2% target, suggesting that dissent started to appear within Fed presidents.
We reiterate our view that the weakness in inflationary pressures that has emerged at the beginning of the year will force the Fed to slow down the pace of monetary tightening. Therefore, we expect only one other rate hike this year, most likely in December. We also anticipate that the Fed will wait until December to announce the timing of the balance sheet reduction, which will most likely start at the earliest in the second half of 2018.
Given the lack of new information provided by the minutes, the USD was little changed on Thursday. EUR/USD consolidated around 1.1350, still trading with a negative bias as investors catch their breath after last week's euro rally. The pound sterling moved in a similar fashion as markets awaited fresh news regarding the Brexit negotiations, with GBP/USD treading water below the 1.30 threshold.
Fade rising tensions
The wires continue to push rising geopolitical tensions and for good reason. Between the US Ambassador to the UN Nikki Haley's harsh warning to countries enabling trade with North Korea and US President Trump's aggressive tweets against China, it feels as if rhetoric has reached a new high.
It's likely the US will enact further sanctions on North Korea in the coming days and the possibility of a trade war with China has increased significantly. Like clockwork, FX markets shifted into safe haven JPY buying and KRW selling, with regional trade dependent currencies also weaker.
However, there is also the feeling that we have been here before under the Trump administration. The strategy of pushing advisories/issues to the edge only to back off at the last minute are hallmark Trump. So despite the threat of war, implied volatility in FX markets have been in decline for the last few days.
In our view, this shift has created an opportunity in FX EM. The macro story of solid external demand, higher interest rates, and low expectations for protectionism to stymie trade will continue to drive carry trades. We have consistently expressed that the key to 2017 will be to filter out the hype, and the current environment is a prime example.
Trade Idea: AUD/USD – Sell at 0.7650
AUD/USD – 0.7610
Recent wave: Wave 5 ended at 1.1081 and major correction has commenced for fall to 0.7000 and then towards 0.6500-10
Trend: Near term up
Original strategy :
Sell at 0.7650, Target: 0.7500, Stop: 0.7690
Position: -
Target: -
Stop: -
New strategy :
Sell at 0.7650, Target: 0.7500, Stop: 0.7690
Position: -
Target: -
Stop:-
Although aussie has recovered after falling to 0.7571 and consolidation above this level would be seen, if our view that top has been formed at 0.7712 is correct, upside should be limited to 0.7650-60 and bring another retreat later, below said support at 0.7571 would add credence to this view, bring retracement of recent rise to 0.7535 support, break there would extend further fall towards 0.7500 which is likely to hold from here..
In view of this, we are looking to sell aussie on recovery as 0.7650 should limit upside. Above 0.7683 resistance would abort and suggest the retreat from 0.7712 has ended instead, bring retest of this level first, then towards 0.7750.
On the 4-hour chart, the move from 0.8066 is the wave 5 with i: 0.8860, ii: 0.8315, wave iii is an extended move ended at 1.0183, iv: 0.9706 and wave v has ended at 1.1081 (also the top of entire wave 5). The subsequent selloff is the major correction which is unfolding as ABC-X-ABC and 2nd A leg has ended at 0.8848, followed by a-b-c wave B which ended at 0.9758, hence, 2nd C wave is now in progress and indicated downside target at 0.7000 and 0.6950 had been met, so further fall to 0.6710-20 cannot be ruled out.

Growth In British Services Sector Slows For June
'Given the deterioration in the forward-looking indicators, such as business optimism and order book growth, the risks are tilted towards the economy slowing in the third quarter.' - Chris Williamson, IHS Markit
Services sector activity in the UK fell more than expected in June amid rising uncertainty surrounding the Brexit negotiations. Markit reported on Wednesday that its Purchasing Managers' Index for Britain's services sector declined to 53.4 in June, compared to the preceding month's 53.8 points. The weaker-than-expected figures added to evidence that the country's economic expansion started to fade, following the disappointing PMI reports on the UK construction and manufacturing sector. Moreover, survey showed that the amount of new orders grew at the slowest pace in nine months, while business confidence registered the second-weakest reading since December 2011. However, experts suggested that there were some gains, notably in business services and financial services, but in general, investment, exports and business spending failed to provide a sufficient boost to fully offset a slowdown in consumption. In contrast, the labour market registered its fastest pace of job creation in 14 months, while companies faced difficulties of recruiting new staff.
US Factory Orders Fall 0.8% In May
'The market is watching every morsel of economic data to see if inflation is moving in the direction that the Fed wants' - Quincy Krosby, Prudential Financial
New orders for US-made goods declined more than estimated for the second consecutive month in May, a worrisome sign for the manufacturing industry. The US Commerce Department reported on Wednesday that the country's factory orders dropped 0.8% month-over-month in May, following a downwardly revised 0.3% fall registered in April. Meanwhile, analysts anticipated new orders to show a smaller decline of 0.5%. On a yearly basis, factory orders were up 4.8%, suggesting that US manufacturing activity continued to expand at a moderate pace. Excluding transport, orders plunged 0.3% in the reported month after being flat in April. Moreover, the report showed that orders for non-defence aircrafts dipped 11.6%, following a 12.2% decline in the previous month. Overall, factory data marked slow growth amongst most industry sectors without any signs of a sustained expansion. Mixed US macroeconomic reports called to question the US economy's ability to achieve Trump's ambitious targets. However, despite sluggish inflation and economic growth the Fed left the third interest rate hike on the table.
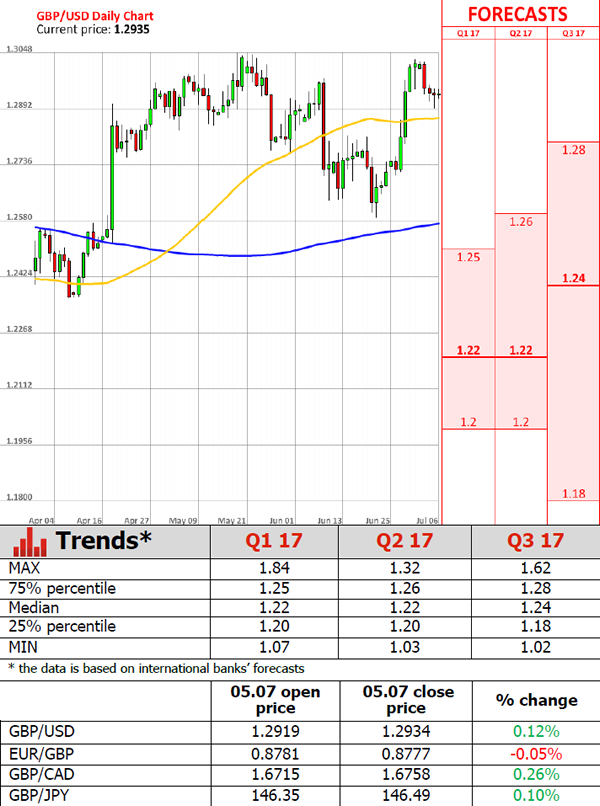
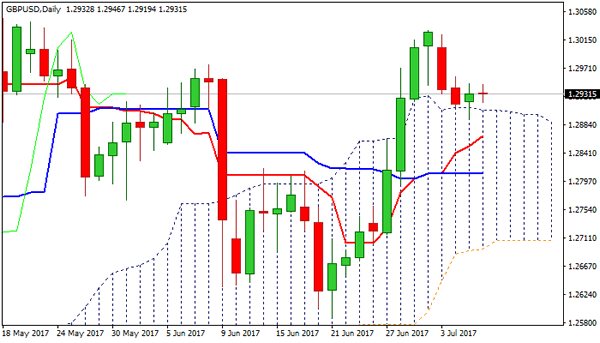
Technical Outlook: GBPUSD – Daily Cloud Top Is Still Holding But Stronger Direction Signal Is Required
Near-term bears from 1.3029 peak are taking a breather above daily cloud, holding in directionless mode on Thursday and awaiting data for firmer signals.
Probe below daily cloud top on Wednesday was short-lived and hopes for fresh upside attempts would remain in play while cloud supports.
Multiple bull-crosses of daily MA's are also supporting bulls, along with north-heading daily Tenkan-sen, which diverges from Kijun-sen line.
Corrective pullback from 1.3029 should ideally bottom above daily cloud top, as technical studies support this scenario.
However, fundamentals are likely to be the key driver these days. US jobs data are in focus with BoE MPC hawk McCafferty due to speak today and may also affect cables near-term action.
Bullish scenario requires stronger bounce from daily cloud top (1.2945 and 1.2977 Fibo barriers are seen as triggers) with extension above 1.2977 to confirm reversal.
Alternatively, break below daily cloud top (1.2906) would open plethora of MA supports below (lying between 1.2870 and 1.2809).
Res: 1.2945, 1.2961, 1.2977, 1.3000
Sup: 1.2906, 1.2893, 1.2870, 1.2831
Technical Outlook: EURUSD Is In Quiet Mode Awaiting US Data For Fresh Signal
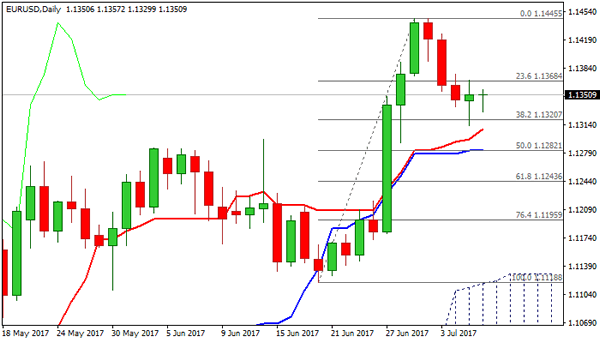
The Euro is holding neutral near-term tone ahead of US jobs data which are expected to give fresh direction signal.
ADP private employment data is due today with forecast for June at 185K compared to 253K in May. In addition, US weekly jobless claims (forecast at 243K vs 244K previous week) and US Non-Manufacturing PMI (forecast for June at 60.8 vs 60.7 in May) are due today, ahead of key release, US Non-Farm payrolls on Friday (forecast for June stands at 179K vs 138K in May) which could generate stronger direction signal.
The EUR/USDcracked strong Fibo 38.2% support at 1.1320 on Wednesday (dip to 1.1312 low was contained by rising 10SMA) but failed to close below.
Wednesday’s trading ended in Doji candle, signaling indecision ahead of key US data.
Technical studies on daily chart are bullishly aligned and supportive for fresh advance, as 1.1320 support marks ideal reversal point for pullback from 1.1445 tops.
However, falling hourly cloud continues to limit upside attempts and lift above it (cloud top lies at 1.1380) is needed to signal reversal and open targets at 1.1400/45.
Conversely, sustained break below 1.1320/00 zone would signal fresh extension of bear-leg from 1.1445 and expose supports at 1.1282 (daily Kijun-sen) and 1.1256 (20SMA).
Res: 1.1368, 1.1380, 1.1400, 1.1426
Sup: 1.1336, 1.1320, 1.1308, 1.1282
GBP/JPY Daily Outlook
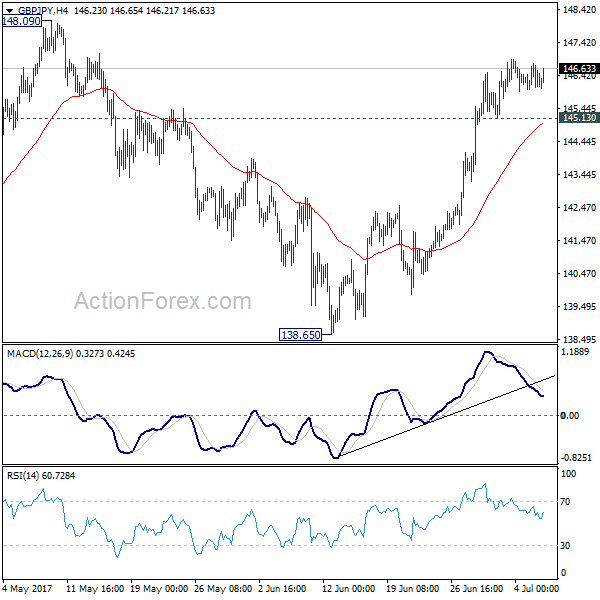
Daily Pivots: (S1) 146.04; (P) 146.42; (R1) 146.84; More....
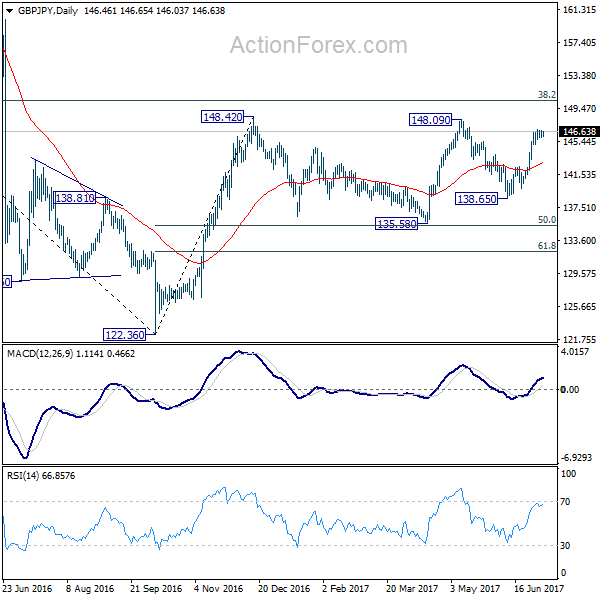
No change in GBP/JPY's outlook. With 145.13 minor support intact, further rise is expected to 148.09/42 resistance. Decisive break there will extend whole rally from 122.36 to long term fibonacci level at 150.43 next. On the downside, below 145.13 minor support will turn intraday bias neutral and bring consolidation again before staging another rally.
In the bigger picture, rise from medium term bottom at 122.36 is expected to continue to 38.2% retracement of 196.85 to 122.36 at 150.43. Decisive break there will carry long term bullish implications and pave the way to 61.8% retracement at 167.78. In case the sideway pattern from 148.42 extends, we'd be looking for strong support from 135.58 and 50% retracement of 122.36 to 148.42 at 135.39 to contain downside.
EUR/JPY Daily Outlook
Daily Pivots: (S1) 128.12; (P) 128.59; (R1) 129.04; More...
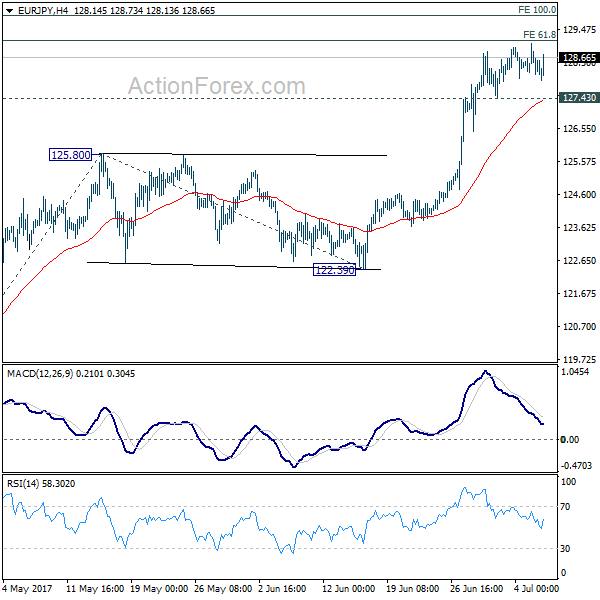
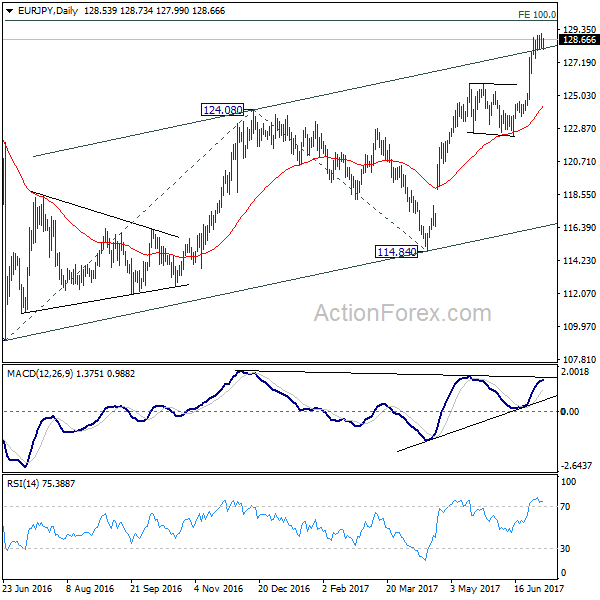
No change in EUR/JPY's outlook even though it's losing upside momentum. Further rise is expected with 127.43 minor support intact. We'd be cautious of strong resistance between 61.8% projection of 114.84 to 125.80 from 122.39 at 129.16 and medium term projection level at 129.89 to bring short term topping. On the downside, below 1.2743 will bring deeper pull back to 125.80 resistance turned support.
In the bigger picture, the break of 126.09 support turned resistance should have confirmed completion of down trend form 149.76 (2014 high), at 109.03 (2016 low). Current rise from 109.03 should target 100% projection of 109.03 to 124.08 from 114.84 at 129.89 first. Break there will pave the way to 61.8% retracement of 149.76 to 109.03 at 134.20 and above. Medium term outlook will now remain bullish as long as 122.39 support holds.
Foreign Exchange Market Commentary: EUR/USD, USD/JPY, GBP/USD, GOLD, WTI CRUDE, DJIA, FTSE100, DAX
EUR/USD
The dollar advanced against all of its major rivals, again receiving a vote of confidence from European investors, which sent the EUR/USD pair down to 1.1311. Most of the common currency's daily decline can be attributed to ECB's Executive Board member Benoit Coeure, who said that the governing council hasn't discussed policy changes, pouring cold water over expectations of soon-to-come tapering. The greenback retreated modestly early US session, as investors turned cautious ahead of the minutes of the Federal Reserve June meeting. The greenback ticked lower as an initial reaction to the release, but turned back higher afterwards, with the EUR/USD pair ending the day around 1.1330. The Minutes showed that policy makers are divided over when to start reducing their balance sheet, whilst most Fed members think that recent softness in inflation have little bearing on inflation trend.
Macroeconomic news coming from the EU were encouraging, but attention remained focused in Central Banks. Nevertheless, the final EU services and composite PMIs for June confirmed that growth remained strong in the region at the end of the second quarter, as the final Markit composite output index came in at 56.3, above the early estimate of 55.7, and only slightly below the six-year record high of 56.8. Growth in the services sector was also revised higher from flash PMIs, while May retail sales for the EUR doubled expectations, up by 0.4% in the month, and by 2.6% when compared to May 2016.
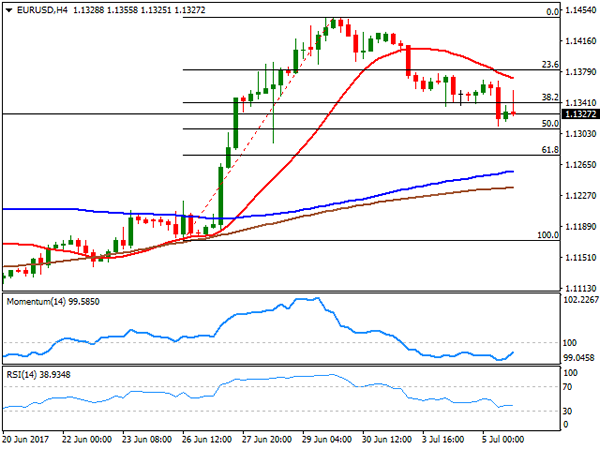
The EUR/USD pair kept retreating after nearing a major long-term resistance last week, the 1.1460 region, but a sustainable slide is not yet clear. Intraday technical readings show that the risk remains towards the upside, as the pair failed to regain the 1.1340 level, the 38.2% retracement of its latest bullish run and now the immediate resistance, whilst the 20 SMA in the 4 hours chart accelerated south above the current level. Technical indicators in the mentioned chart have managed to bounce some, but remain well below their mid-lines. The critical support remains to be 1.1290, June 28th low, with a break below it required to confirm a steeper decline.
Support levels: 1.1290 1.1250 1.1210
Resistance levels: 1.1340 1.1380 1.1420
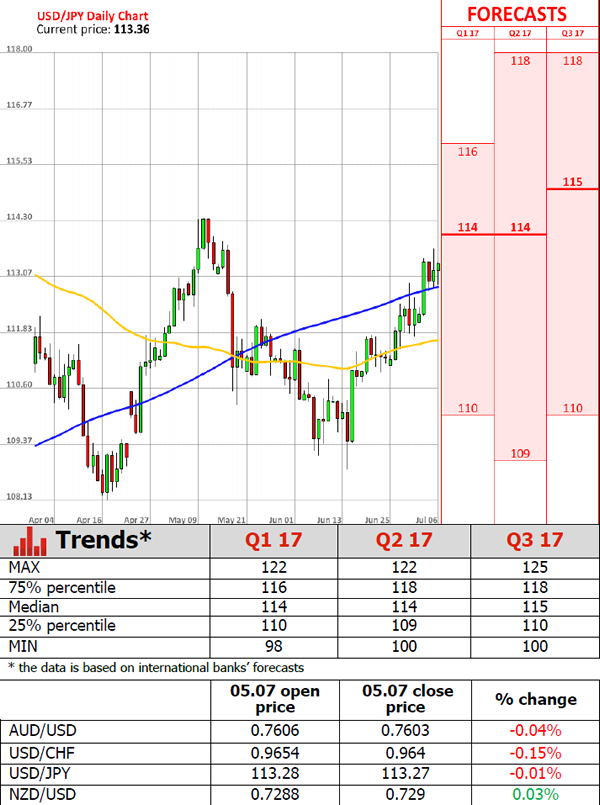
USD/JPY
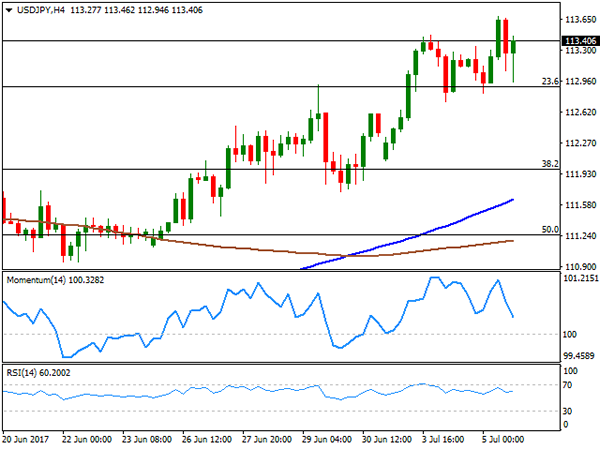
The USD/JPY pair advanced up to 113.68, a new 2-month high early Europe, but retreated from the level as Wall Street turned into the red after the opening, whilst Treasury yields also eased. The release of the latest meeting FOMC Minutes, revived demand for the greenback, with also advancing afterwards and the pair settling in the 113.40 region, as US policy makers showed little concerns over the latest slowdown in inflation, still thinking of it as temporally, with several seeing the balance sheet reduction staring in a couple of months. Earlier on the day, the Japanese services PMI came in stronger-than-expected, up to 53.3 in June from 53.0 in May, although the composite reading slipped from 53.4 to 52.9 in the same month. There are no big news scheduled in the country for the upcoming Asian session. From a technical point of view, the 4 hours chart shows that the pair keeps meeting buying interest on approaches to the 113.00 region, despite the limited upward strength coming from technical indicators, as the Momentum heads lower within positive territory, while the RSI turned marginally higher, but still below previous daily highs. Overall, the pair is poised to extend its advance, although the pair can see little action this Thursday, ahead of the release of the US Nonfarm Payroll report next Friday.
Support levels: 112.95 112.50 112.10
Resistance levels: 113.70 114.05 114.40
GBP/USD
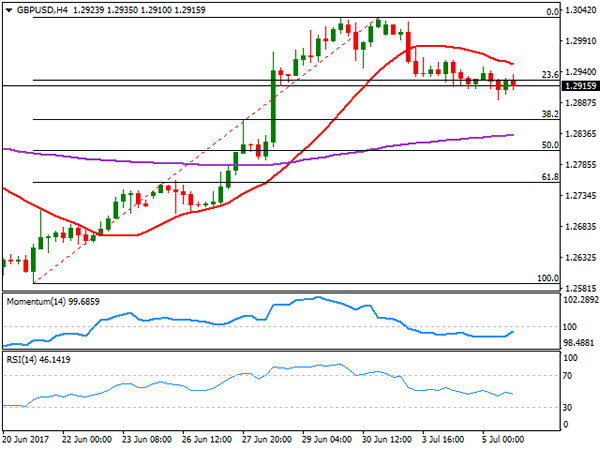
The GBP/USD pair fell down to 1.2892, with the following bounce limited to the 1.2930 region and posting a third consecutive lower low daily basis, hit by a poor Services PMI. In June, and according to Markit's index, the sector's growth decelerated for a second consecutive month, coming in at 53.4 from previous 53.8. This marks the third disappointing number release this week, as the indexes for the manufacturing and the construction sectors were also below previous and expected. The pair trades marginally lower daily basis, as the release of FOMC Minutes had little to add to what the market already knew, resulting in limited movements across the board. Technically, the risk remains towards the downside, given that in the 4 hours chart the price is below a bearish 20 SMA, currently at 1.2960, whilst the RSI indicator resumed its decline, now at 46 as the Momentum hovers directionless within negative territory. The pair is barely below 1.2925, the 23.6% retracement of its latest rally and the immediate resistance, but it would take an extension beyond 1.2960 to revert the ongoing bearish trend.
Support levels: 1.2890 1.2860 1.2820
Resistance levels: 1.2925 1.2960 1.2995
GOLD
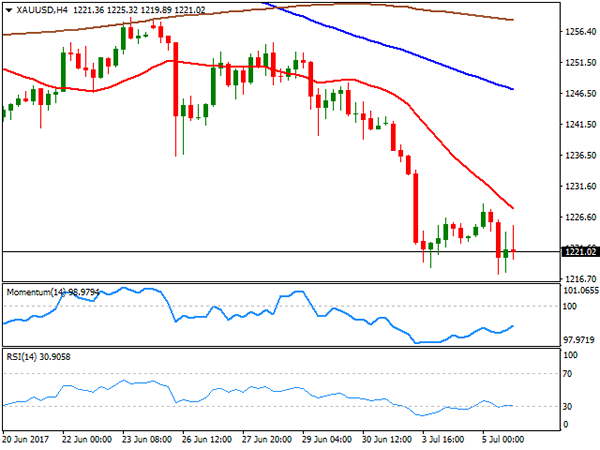
Gold prices extended their declines this Thursday, with spot ending the day at $1,220.97 a troy ounce, reverting and early advance triggered by geopolitical woes in Asia, after North Korea latest ballistic missile test. Spot came under pressure after during the US afternoon, as the Minutes of the latest Fed's meeting showed that policy makers are firmly walking the tightening path, with no majors concerns over the latest slowdown in inflation. A recovery in US stocks, also weighed on the commodity. The daily chart shows that the bright metal was once again contained by selling interest around the 200 DMA, while reaching a fresh almost 2-month low of 1.217.40. Technical indicators in the mentioned time frame hold within bearish territory, with the RSI heading resuming its decline around 31, and the Momentum lacking directional strength within negative territory. Shorter term, and according to the 4 hours chart, the upside remains well-limited, with the price still developing below a bearish 20 SMA, today at 1,228.00, while technical indicators bounce modestly from oversold readings, not enough to support additional gains ahead.
Support levels: 1,217.40 1,208.30 1,198.20
Resistance levels: 1,228.00 1,236.50 1,241.80
WTI CRUDE OIL
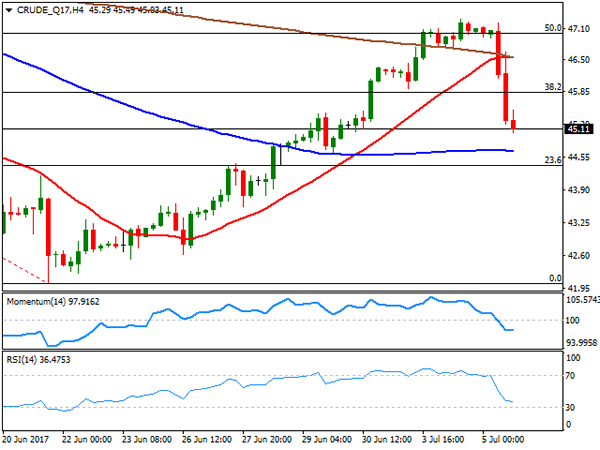
Crude oil prices plunged over 4% this Wednesday, with West Texas Intermediate futures ending the day at $45.10 a barrel, hit by news that Russia is not willing to support further OPEC cuts, and new evidence that the organization rose its exports in June. Russian officials announced that the government will oppose further cuts, indicating that it would send the wrong message to the market, while Reuters data showed that the organization exported 25.92 million barrels per day in June, up 450,000 bpd from May and 1.9 million bpd more than a year earlier. WTI daily chart supports further slides ahead, as the price retreated strongly after meeting selling interest around the 50% retracement of its latest decline, now trading below the 38.2% retracement of the same slide at 45.90. In the same chart, technical indicators have turned sharply lower, currently challenging their mid-lines, whilst the price is barely above a directionless 20 DMA. Shorter term, and according to the 4 hours chart, the commodity is bearish, with the Momentum indicator heading south well below its 100 level and the RSI indicator consolidating around 36, as the price broke below its 20 and 200 SMAs, now hovering a few cents above a flat 100 SMA.
Support levels: 44.40 43.70 43.10
Resistance levels: 45.90 46.60 47.20
DJIA
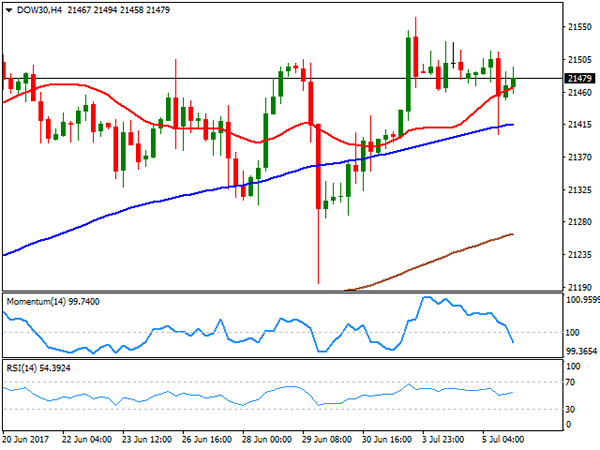
US equities ended a choppy session with modest gains, with the Nasdaq Composite outstanding amid a bounce in the tech sector, with the index up 40 points, to end at 6,150.86. The Dow Jones Industrial Average closed the day unchanged, down 1 point at 21,478.17, while the S&P added 3 points, to 2,432.54. Health-care, and financial equities also edged higher, while the energy sector weighed, amid the sharp decline in oil prices. Within the Dow, the best performer was Intel that added 275%, followed by Boeing that added 1.73%. Walt Disney led decliners, with a 1.75% decline, followed by Chevron that shed 1.68%. From a technical point of view, the index maintains a neutral-to-bearish stance, with indicators heading south around their mid-lines, but a bullish 20 DMA still providing support around 21,400. In the 4 hours chart, the Momentum indicator head sharply lower below its 100 level, the RSI indicator aims north around 54, while the index settled a few points above a bullish 20 SMA, overall limiting chances of a steeper decline ahead.
Support levels: 21,449 21,401 21,361
Resistance levels: 21,506 21,563 21,600
FTSE100
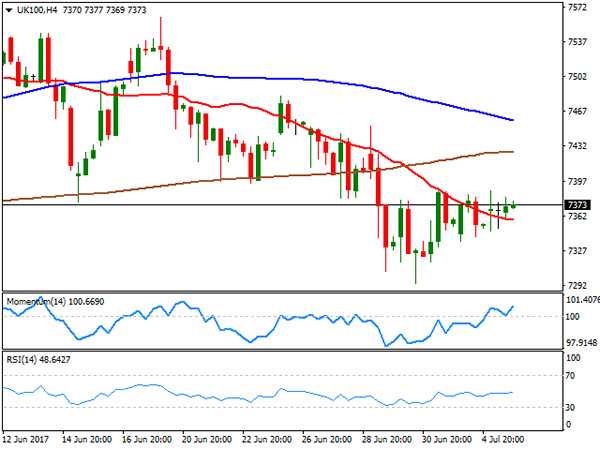
The UK benchmark, the FTSE 100, gained 10 points to close the day at 7,367.60, helped by a weaker Pound, but unable to find direction, with investors trapped within geopolitical tensions in Asia, and expectations over the FOMC Minutes´ release later on the day. Following an over 27% advance, Worldpay Group was the worst performer, down 8.82%, followed by Old mutual that shed 1.74%. Tesco led advancers with a 3.80% gain, followed by Provident Financial that added 3.49%. The index trades now around its 100 DMA in the daily chart, still well below a sharply bearish 20 SMA, and with technical indicators advancing within negative territory, limiting chances of a steeper advance. In the shorter term, and according to the 4 hours chart, the scale leans slightly towards the upside, as the index settled above a still bearish 20 SMA, but the RSI indicator consolidates within neutral territory, whilst the Momentum indicator advances beyond the 100 level at fresh weekly highs, not enough, however, to confirm a strong rally ahead.
Support levels: 7,331 7,294 7,256
Resistance levels: 7,380 7,424 7,452
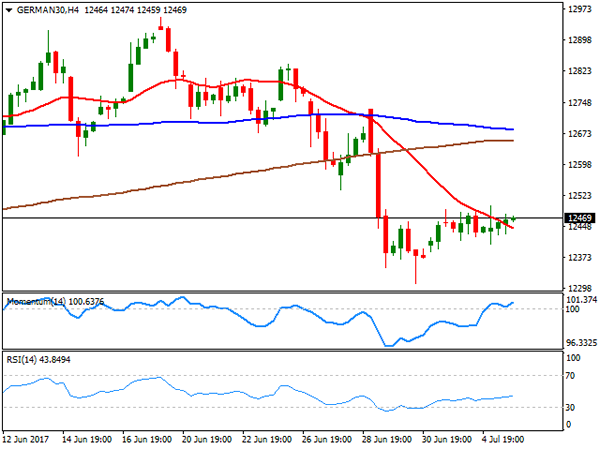
DAX
European equities hovered with gains and losses for most of the session, ending with modest gains, in spite of the slump in energy-related equities amid oil prices decline. The German DAX closed the day at 12,453.68, up 0.13% or 16 points, with Adidas leading advancers up 4.95%, followed by Deutsche Boerse which added 3.24%. Bayer was the worst performer, closing the day 0.94% lower, followed by Daimler that shed 0.84%, with auto makers under pressure across the region, on news that UK car registrations fell 4.8% in June. The index advanced modestly in after-hours trading, but the upward potential still seems limited according to the daily chart, as the index has held within its early week range, barely above a bullish 100 DMA but well below a bearish 20 DMA, whilst technical indicators have posted modest recoveries within bearish territory, with not enough momentum to confirm additional gains ahead. In the 4 hours chart, the index is right above a bearish 20 SMA, the RSI indicator is flat around 43, whilst the Momentum indicator heads higher around its 100 level, in line with the longer term perspective.
Support levels: 12,420 12,364 12,310
Resistance levels: 12,490 12,536 12,587