
Sample Category Title
Daily Technical Analysis: USD/JPY Breakout Above Resistance And Pullback To Wave-4 Fibs
Currency pair USD/JPY
The USD/JPY is moving higher within a wave 5 (orange) of wave C (brown). A break above the top of the channel (red) could see price move towards the Fibonacci targets of wave C (brown).
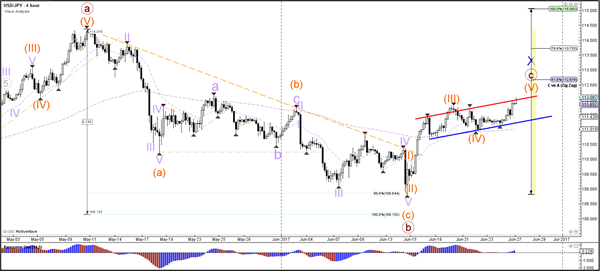
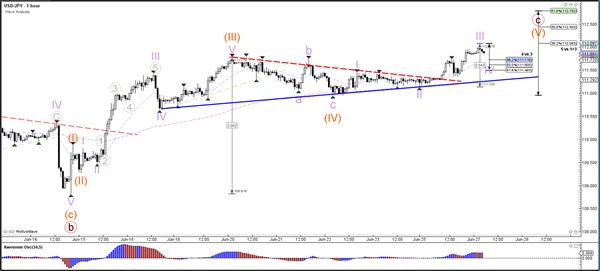
The USD/JPY broke above the resistance trend line (dotted red) mentioned yesterday and it seems to be expanding the wave 5 (orange) with 5 internal waves (purple). A break below the 61.8% Fib of wave 4 vs 3 invalidates the wave 4 (purple).
Currency pair EUR/USD
The EUR/USD is moving sideways between support (blue) and resistance (red/orange). A break above the 100% level at 1.13 invalidates both waves 2 (brown/green) and makes an uptrend continuation more likely. A bearish breakout below the bottom at 1.11 could confirm a potential wave 3.
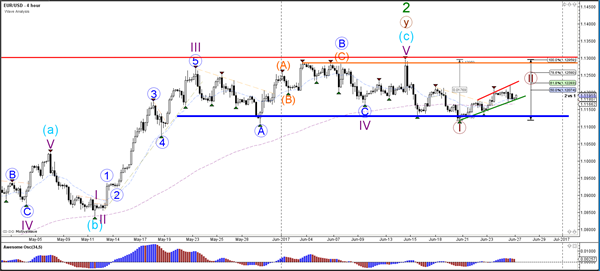
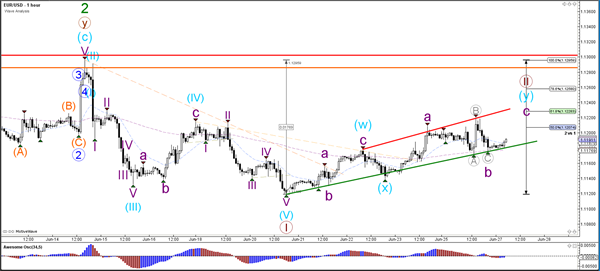
The EUR/USD could retrace deeper and higher if indeed an ABC (purple) zigzag occurs within a wave 2 (brown).
Currency pair GBP/USD
The GBP/USD is building an ABC (grey) zigzag within wave 2 (blue). Price could have completed the wave 2 correction if price manages to break below support (blue).
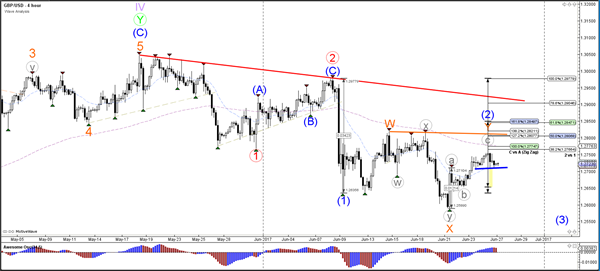
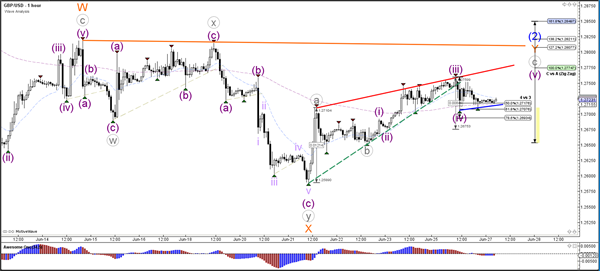
The GBP/USD could be a in wave 4 (purple) if price manages to stay above the Fibonacci levels of wave 4 vs 3.
Daily Technical Outlook And Review: EUR/USD, GBP/USD, AUD/USD, USD/JPY, USD/CAD, USD/CHF, DOW 30, GOLD
A note on lower timeframe confirming price action...
Waiting for lower timeframe confirmation is our main tool to confirm strength within higher timeframe zones, and has really been the key to our trading success. It takes a little time to understand the subtle nuances, however, as each trade is never the same, but once you master the rhythm so to speak, you will be saved from countless unnecessary losing trades. The following is a list of what we look for:
- A break/retest of supply or demand dependent on which way you're trading.
- A trendline break/retest.
- Buying/selling tails ... essentially we look for a cluster of very obvious spikes off of lower timeframe support and resistance levels within the higher timeframe zone.
- Candlestick patterns. We tend to only stick with pin bars and engulfing bars as these have proven to be the most effective.
We typically search for lower-timeframe confirmation between the M15 and H1 timeframes, since most of our higher-timeframe areas begin with the H4. Stops are usually placed 1-3 pips beyond confirming structures.
EUR/USD
For those who read Monday's report you may remember that our team was looking to short the open and initially target the H4 mid-level support at 1.1150. Despite the pair moving in our favor price failed to achieve 1.1150 and whipsawed north to H4 supply at 1.1228-1.1218. The move was influenced by lower-than-expected US durable goods figures, consequently registering a small loss for our desk.
Moving forward, we still believe that there's a good chance the single currency is headed towards 1.1150 today/this week. This is partly due to seeing the weekly candles trading around the underside of a major weekly supply at 1.1533-1.1278. However, one still has to remain cognizant of the current daily demand in play at 1.1075-1.1158!
Our suggestions: Based on the above, our team's attention is drawn towards the 1.12 handle today. A retest of this line, coupled with a reasonably sized bearish candle (preferably a full-bodied candle) would be enough to validate a short, in our humble opinion. Just to be clear here, 1.1150 is the INITIAL take-profit target, not final! Weekly price shows that the major could travel all the way down to the 2016 yearly opening level at 1.0873, which would be an ideal FINAL take-profit zone.
Data points to consider: ECB President Mario Draghi speaks at 9am. US consumer confidence report at 3pm, FOMC member Harker speaks at 4.15pm, Fed Chair Janet Yellen speaks at 6pm, FOMC member Kashkari speaks at 10.30pm GMT+1.

Levels to watch/live orders:
- Buys: Flat (stop loss: N/A).
- Sells: 1.12 region ([waiting for a reasonably sized H4 bear candle to form – preferably a full-bodied candle – is advised] stop loss: ideally beyond the candle's wick).
GBP/USD
Coming in from the top this morning, the weekly timeframe reveals that the unit remains capped beneath weekly resistance at 1.2789, despite last week's strong buying tail. Moving down to the daily timeframe, yesterday's movement connected with the underside of a supply zone drawn from 1.2818-1.2752, which, as you can see, held beautifully. Although this daily supply encapsulates the said weekly resistance, an area of concern is the nearby daily support level pegged at 1.2673.
As can be seen on the H4 timeframe, the candles continue to reflect a bearish stance from the H4 supply zone coming in at 1.2758-1.2728. In view of the confluence surrounding this area (a H4 mid-level resistance level at 1.2750, a 61.8% H4 Fib resistance at 1.2728 taken from the high 1.2814, a H4 AB=CD [see black arrows] 127.2% ext. at 1.2745 taken from the low 1.2589 and also the fact that the area is glued to the underside of the aforementioned daily supply zone), shorting seems attractive. Still, selling at current prices would entail one shorting into the nearby 1.27 handle, which is positioned not too far from the daily support mentioned above at 1.2673.
Our suggestions: Even if we wait for a H4 close to form below 1.27 as advised in Monday's report, we still have to contend with the said daily support! Not exactly ideal selling conditions! Apologies, this is something we missed in Monday's report. Therefore, we will not be selling beneath 1.27 and will remain flat for the time being.
Data points to consider: BoE Financial stability report at 10.30am, BoE Gov. Carney speaks at 11am. US consumer confidence report at 3pm, FOMC member Harker speaks at 4.15pm, Fed Chair Janet Yellen speaks at 6pm, FOMC member Kashkari speaks at 10.30pm GMT+1.

Levels to watch/live orders:
- Buys: Flat (stop loss: N/A).
- Sells: Flat (stop loss: N/A).
AUD/USD
In recent trading, the AUD/USD extended higher from the H4 support area at 0.7571-0.7557 and came within a cat's whisker of tapping the 0.76 handle, before turning lower into the closing bell. Between these two structures, we have thirty pips of room to play with. While this is enough to profit if one is able to pin down a tight stop loss, it is not something we will be looking into. Beyond 0.76 we see April's opening level at 0.7632, a line that happens to be positioned eight pips below the underside of a daily supply area at 0.7679-0.7640. Below the current H4 support area, there's not much room for price to stretch its legs. Close by is a H4 Quasimodo support at 0.7543, followed by H4 support at 0.7524. As is evident from the H4 timeframe, the unit is somewhat restricted as far as structure is concerned.
Branching over to the bigger picture, we can see that the daily support area at 0.7556-0.7523 remains in a firm position and could eventually pull the pair up to the daily supply mentioned above at 0.7679-0.7640. Overhead on the weekly timeframe, direction is uncertain. Weekly price recently slammed on the brakes and reversed following a marginal close above supply pegged at 0.7610-0.7543, and has yet to paint a clear picture of where it wants to trade next.
Our suggestions: On account of the above notes, neither a long nor short seems attractive at this time. With that being the case, our team intends to watch today's action from the safety of the bench and will look to reassess price action going into tomorrow's open.
Data points to consider: US consumer confidence report at 3pm, FOMC member Harker speaks at 4.15pm, Fed Chair Janet Yellen speaks at 6pm, FOMC member Kashkari speaks at 10.30pm GMT+1.

Levels to watch/live orders:
- Buys: Flat (stop loss: N/A).
- Sells: Flat (stop loss: N/A).
USD/JPY
With weekly price recently finding a floor of support around the 110.30 mark, we see two possible scenarios on the weekly timeframe at the moment:
To the downside, a weekly AB=CD correction (see black arrows) that terminates within a weekly support area marked at 105.19-107.54 (stretches all the way back to early 2014) may form in the coming weeks.
To the upside, nonetheless, we also have a potential weekly AB=CD correction (see pink arrows) that completes within supply pegged at 115.50-113.85 which capped upside beautifully in early May.
Since Tuesday last week, the daily candles have been clinging to the underside of a daily resistance area penciled in at 111.35-112.37. This zone has been active since late January, so it is certainly not a base one should ignore. Despite this, the bulls went on the offensive during Monday's segment, and have pushed price higher into the said daily zone.
A quick recap of Monday's action on the H4 timeframe shows price recently advanced and broke above the bullish pennant formation (110.64/111.78). As you can see, the move brought the candles up to within striking distance of the 112 handle, which also merges with a left shoulder i.e. a H4 Quasimodo pattern at 112.05 (see the pink arrow). Also of particular interest is that 112 is sited within the upper edge of the aforementioned daily resistance area, and also merges closely with a potential H4 AB=CD (black arrows) 127.2% ext. at 112.09 taken from the low 110.64.
Our suggestions: 112 is an ideal zone to short from, in our opinion. Given that our desk is conservative, however, stops will be positioned beyond the current daily resistance area at 112.39. This will give the trade room to breathe should it come to fruition, and give price the best chance of correcting back down to at least 111.41: April's opening level (initial take-profit target).
Data points to consider: US consumer confidence report at 3pm, FOMC member Harker speaks at 4.15pm, Fed Chair Janet Yellen speaks at 6pm, FOMC member Kashkari speaks at 10.30pm GMT+1.

Levels to watch/live orders:
- Buys: Flat (stop loss: N/A).
- Sells: 112 (stop loss: 112.39).
USD/CAD
Since the 14th June, the H4 timeframe has been chalking up a nice-looking ascending channel formation (1.3165/1.3308). Just yesterday, the pair bounced from the lower edge of this pattern, helped of course by the daily support level at 1.3212. Despite this, weekly demand at 1.3223-1.3395 remains under pressure.
In Monday's report, we stated that we thought the H4 channel pattern would unlikely continue its upwardly path. Despite yesterday's bounce from the channel support, we still believe this to be the case. Not only do we have daily resistance at 1.3272 now in play, let's also not forget that the current weekly demand is hanging on by a thin thread at the moment.
Our suggestions: Ultimately though, to confirm bearish intent we would want to see H4 price close below both the channel support and the 1.32 handle. This – coupled with a retest and a reasonably sized H4 bearish candle (preferably a full-bodied candle) would, in our opinion, be enough to consider selling this pair, targeting the top edge of the weekly demand at 1.3115. Regarding longs, we would advise treading carefully given the higher-timeframe picture right now.
Data points to consider: US consumer confidence report at 3pm, FOMC member Harker speaks at 4.15pm, Fed Chair Janet Yellen speaks at 6pm, FOMC member Kashkari speaks at 10.30pm GMT+1.

Levels to watch/live orders:
- Buys: Flat (Stop loss: N/A).
- Sells: Watch for H4 price to engulf 1.32 and then look to trade any retest seen thereafter ([waiting for a reasonably sized H4 bear candle – preferably a full-bodied candle – to form following the retest is advised] stop loss: ideally beyond the candle's wick).
USD/CHF
In Monday's report, our desk highlighted the possibility of an advance being seen following a break of the 0.97 handle. What we also underscored was that in order for our team to enter long, we would require a retest of 0.97 to be seen, followed by a H4 bullish candle rotation. As you can see, this did come to fruition, but we unfortunately missed the setup. Well done to any of our readers who managed to jump in long here!
Ultimately, for those who are currently long, the initial area of concern is a H4 sell zone we talked about last week at 0.9774/0.9750. Ideally though, we'd personally be eyeing the H4 supply above here at 0.9825-0.9801 as a final take-profit area, as it sits within the upper edge of the daily supply coming in at 0.9825-0.9786.
Our suggestions: Unless we witness a second retest of 0.97, coupled with a H4 bull candle rotation, our team will not be trading this market today. Should this come to fruition, the take-profit targets would be the same as mentioned above.
Data points to consider: US consumer confidence report at 3pm, FOMC member Harker speaks at 4.15pm, Fed Chair Janet Yellen speaks at 6pm, FOMC member Kashkari speaks at 10.30pm GMT+1

Levels to watch/live orders:
- Buys: 0.97 region ([waiting for a reasonably sized H4 bull candle to form – preferably a full-bodied candle – following the retest is advised] stop loss: ideally beyond the candle's tail).
- Sells: Flat (stop loss: N/A).
DOW 30
The H4 demand has continued to remain afloat, printing multiple H4 buying tails. For those who follow our analysis on a regular basis, you may recall that our desk is currently long from 21164. 50% of that position was quickly liquidated at 21234, with the remaining 50% left in the market to run since we intend on trailing this trend long term. The stop-loss order is currently positioned below the said H4 demand at 21298, as we believe this to be the safest area for the time being. Ultimately, we want this zone to continue holding firm and eventually punch to fresh record highs.
While we do want the H4 demand base to continue holding firm, weekly action recently printed a rather aggressive weekly selling wick. Couple this with room being seen on the daily chart for price to challenge demand drawn from 21192-21254, this could force the H4 candles into our stop. Nevertheless, the underlying trend in this market is strong, so there's also a chance that this could bolster price!
Our suggestions: For now, all the desk is watching for is price to continue holding above the current H4 demand, and eventually drive to fresh record highs.
Data points to consider: US consumer confidence report at 3pm, FOMC member Harker speaks at 4.15pm, Fed Chair Janet Yellen speaks at 6pm, FOMC member Kashkari speaks at 10.30pm GMT+1.

Levels to watch/live orders:
- Buys: 21164 ([live] stop loss: 21298).
- Sells: Flat (stop loss: N/A).
GOLD
As you can see, the price of gold weakened in aggressive fashion yesterday. This came after price testing a H4 sell zone marked in green at 1261.0/1258.3. Comprised of a H4 AB=CD 127.2% ext. point at 1258.3, a merging H4 resistance at 1259.1, two H4 trendline resistances taken from lows of 1245.9/1252.9 and a H4 50.0% retracement value at 1261.0 and also being located within the upper limits of a daily resistance area at 1247.7-1258.8, this area was a high-probability reversal zone.
Unfortunately, we missed this setup altogether as we were waiting for a second retest to take shape and print a H4 bearish rotation candle (preferably a full-bodied candle). Well done to any of our readers who managed to secure a short here!
Moving forward, we can see that weekly price is now trading within a few inches of a weekly demand at 1194.8-1229.1, which happens to intersect with a daily channel support extended from the low 1180.4 (the next downside target on the daily timeframe).
Our suggestions: Watch for H4 price to retest April's opening level as resistance. In the event that this line holds steady and chalks up a H4 bearish candle (again preferably a full-bodied candle), this would be a relatively nice level to sell, in our opinion. The first take-profit target, for us, will be set around the H4 support at 1235.0 (which was nearly brought into the frame during yesterday's selloff), followed closely by the top edge of the weekly demand base highlighted above at 1229.1.

Levels to watch/live orders:
- Buys: Flat (stop loss: N/A).
- Sells: 1248.0 region ([waiting for a reasonably sized H4 bear candle – preferably a full-bodied candle – to form before pulling the trigger is advised] stop loss: ideally beyond the candle's wick).
European Open Briefing: The Focus Overnight Was On The USD/JPY
Global Markets:
- Asian stock markets: Nikkei up 0.40 %, Shanghai Composite lost 0.10 %, Hang Seng rose 0.05 %, ASX 200 lost 0.20 %
- Commodities: Gold at $1245 (-0.10 %), Silver at $16.55 (-0.15 %), WTI Oil at $43.50 (+0.20 %), Brent Oil at $46.15 (+0.25 %)
- Rates: US 10-year yield at 2.14, UK 10-year yield at 1.01, German 10-year yield at 0.25
News & Data
- New Zealand Trade Balance m/m NZ$103mln vs NZ$420mln expected
- New Zealand Trade Balance y/y -NZ$3.75bln vs -NZ$3.40bln expected
- New Zealand Exports 4.95bln vs 4.93bln expected
- New Zealand Imports 4.85bln vs 4.48bln expected
- Australia ANZ Roy Morgan Weekly Consumer Confidence Index June 25: 111.8 (Prev 112.4)
- Japanese stocks edge towards two-year high, dollar supported before Yellen – RTRS
- Oil little changed after three-day gain, supply glut weighs – RTRS
Markets Update:
The focus overnight was on the USD/JPY. The pair briefly broke above 112, although momentum waned quickly. Nevertheless, it is likely to retest the level again, and a clear break above would signal that the rally could extend to 113 in the near-term. This will also depend on the general risk sentiment in the markets. While US stocks came slightly under pressure, Asian stocks are mostly up on the day.
EUR/USD continues to consolidate around 1.12. There are no major European data releases until Thursday, so it could remain quiet until then. GBP/USD reached a high of 1.2750, but political uncertainties are likely to keep the pair under pressure and prevent larger gains.
AUD/USD is struggling with the resistance between 0.76 and 0.7630, but has remained well bid overall. A clear break above 0.7630 would confirm that the short-term uptrend remains intact, and signal a move towards 0.7750.
Upcoming Events:
- 07:45 BST – French CPI
- 15:00 BST – US CB Consumer Confidence
- 15:00 BST – US Richmond Manufacturing Index
Elliott Wave View: EURJPY Bullish Against 123.6
Short term EURJPY Elliott Wave view suggests the decline to 122.35 on 6/15 low ended Intermediate wave (X). Rally from there is unfolding as a double three Elliott Wave structure where Minute wave ((w)) ended at 124.46 and Minute wave ((x)) ended at 123.62. Minute wave ((y)) is in progress and also unfolding as a double three. Near term focus is on 125.42 – 125.68 to complete Minutte wave (w) of ((y)). Afterwards, pair should pullback in Minutte wave (x) of ((y)) in 3, 7, or 11 swing before turning higher again, provided pivot at 123.6 low stays intact. We don’t like selling the pair.
EURJPY 1 Hour Elliott Wave Chart
Market Morning Briefing: No Conclusive Dollar Direction Yet
STOCKS
Dow (21409.55, 0.07%) has been stuck in the very narrow range of 21330-530 for the last 8-9 sessions and a downward break from that range for lower levels of 21200 may be expected this week. In case the support of 21200-150 holds, then the larger uptrend may resume for new highs.
Dax (12770.83, +0.29%) remains trapped in a corrective mode but as long as the support 12650-30 holds, the chances of a fresh high at 12900-13000 remain open.
Shanghai (3183.47, -0.06%) has achieved the immediate target of 3180 already and now faces the resistance of 3200-10 which, if not overcome immediately, may initiate a correction to 3160-50 in the next few sessions.
Nikkei (20213.62, +0.30%) has hit a fresh 23-month high at 20250 and may register higher highs near 20500 if the support of 20000 holds.
Nifty (9574.95, -0.57%), contrary to expectations, broke below the support of 9600. The 4-week long support of 9560-50 may determine the near term path as it must hold for the bulls but a breakdown may sub-9500 levels. It is not clear if the support will hold or not in this expiry week.
COMMODITIES
Gold (1244) and Silver (16.53) are going nowhere as they keep trading in the narrow range of 1233-1248 and 15.93-16.77 respectively. Global cues are not in favor of gold and silver too as the break above 99.70 for Dollar Index (97.13) could be resulted further losses for bullion. If 1233 for gold and 16.45 for silver fail to hold for the current week then gradual selling for the target of 1195 and 15.93 can’t be ruled as seller will take every bounce as a further opportunity for selling.
Copper (2.65) moved higher in line with our expectation and trading within a range of 2.60-65. Only above 2.65 higher resistances of 2.69 can come into consideration. In the medium term 2.55-57 are going to be a strong support and we will remain bullish while it is trading above those levels.
Brent (46.12) and WTI (43.45) closed higher and trading as per our recommended levels. We will remain bullish in extreme short term time frame while Brent and WTI are trading above 46 and 43 levels. We have weekly U.S. crude inventory data tomorrow and a deficit could help Brent and WTI to move towards 46 and 48 regions respectively.
FOREX
No conclusive Dollar direction yet but a sharp move can be expected later in the week.
Dollar Index (97.40) is yet to rally for our higher targets of 98.10-40 but the slow correction and the recovery from the support zone of 97.10-96.90 in the last session keeps the possibility of the larger uptrend resuming still open.
Euro (1.1187) has been facing rejection from the immediate resistance of 1.1210-30 repeatedly but the bears still need a break below 1.1160 to bring up bearish momentum. A break below 1.1160 may invite 1.1100 and lower levels.
Dollar-Yen (111.90) has achieved our initial target of 112.00 and may meet our next target 113.00 in a few more sessions. Any interim correction may be limited to 110.90-70.
Pound (1.2720) keeps trading in the range of 1.2540-1.2820 as expected and the rangebound movement may continue for a few more days. With the bounces coming slower than the declines, the downtrend remain in force.
Aussie (0.7588) has bounced back from 0.7530 levels, well short of our downside support of 0.7490 but face resistance near 0.7620-35.
Dollar-Rupee (64.52) spent another quiet session to end the week inside the range 64.10-75. This collapse in volatility may see expansion in the coming 5-7 days and trigger a breakout from the range. Till then, play the range.
INTEREST RATES
The US yields are falling but might get support at current levels due to oversold condition in the near term. The near term yields had stopped falling while the longer end yields have been falling over the last 1-2 weeks, flattening the yield-curve.
The US 10-5Yr (0.39%) had broken the downward channel support and could test 0.375% on the downside. We think 0.375 is going to hold as US 10Y yield at 2.12,is highly oversold and could bound back towards 2.19 levels within a few days of time.
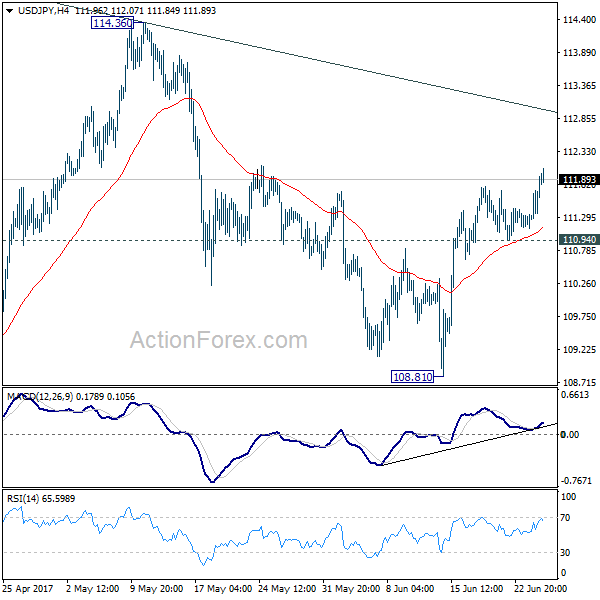
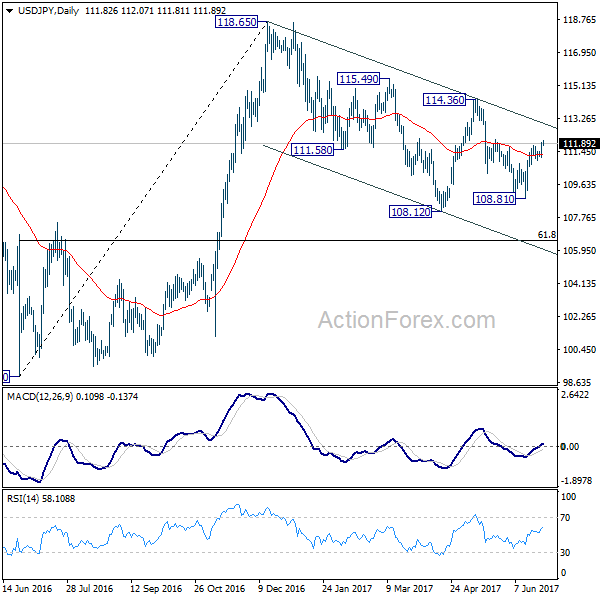
USD/JPY Daily Outlook
Daily Pivots: (S1) 111.34; (P) 111.64; (R1) 112.16; More...
USD/JPY's rally from 108.81 resumed by taking out 111.78 temporary top and reaches as high as 112.07 so far. Intraday bias is back on the upside for channel resistance (now at 112.99). Sustained break there will suggest that whole pull back from 118.65 has completed at 108.12 already. In such case, further rise should be seen to 114.36 resistance for confirmation. On the downside, however, break of 110.94 support will argue that rebound from 108.81 has completed and turn bias back to the downside.
In the bigger picture, price actions from 125.85 high are seen as a corrective pattern. It's uncertain whether it's completed yet. But in case of another fall, downside should be contained by 61.8% retracement of 75.56 to 125.85 at 94.77 to bring rebound. Overall, rise from 75.56 is still expected to resume later after the correction from 125.85 completes.
Currency Markets in Risk Appetite Mode, New Zealand Dollar Jumps on Robust Trade Data
The developments in the forex markets look as if traders are in risk seeking mode. Commodity currencies including Canadian Dollar, Australian Dollar and New Zealand Dollar trade broadly higher since the start of the week. Meanwhile, Japanese Yen and Swiss Franc are the weakest ones. However, this picture is not reflected in other markets. DOW jumped to to 21506.21 overnight but failed to break recent historical high at 21503.03. The index closed up just 0.07% at 21409.55 after paring initial gains. S&P 500 also rose a mere 0.03% to close at 2439.07. But NASDAQ lost -0.29% to close at 6247.15.
Weakness is seen in long term US treasury yield as 30 year yield dropped -0.018 to close at 2.696, extending recent down trend. 10 year yield stayed in recent range and lost -0.007 to close at 2.137. On the other hand, Asian equities are mixed with Nikkei trading up 0.3% at the time of writing. Hong Kong HSI is up 0.1% but China SSE composite is down -0.15%. Australia all ordinaries is down -0.3%. Gold tumbled to as low as 1236.5 yesterday and is still struggling to regain 1250 handle. WTI crude oil continues with its consolidation and is trading in range at around 43.50.
Central bankers to highlight a light day
Half-year end subdued trading will probably keep volatility low. With a relatively light economic calendar today, traders will look into speeches of central bankers for inspirations. The list include RBA Deputy Governor Guy Debelle, ECB President Mario Draghi, BoE Governor Mark Carney, Fed Chair Janet Yellen, Philadelphia Fed President Patrick Harker, and Minneapolis Fed President Neel Kashkari. Meanwhile, on the data front, BoE will release financial stability report, US will release S&P Case Shiller house price and Conference Board consumer confidence.
New Zealand trade data positive despite narrowing surplus
New Zealand trade surplus narrowed to NZD 103m in May, down from NZD 536m and missed expectation of NZD 420m. Exports rose 8.7% yoy to NZD 4.95b and hit the highest level since March 2014. Dairy exports continued its strong run and rose for an eighth straight month and led exports overall. Imports jumped 15% yoy to NZD 4.85b, left by 65% increase in crud oil shipments. Economists believed that the robust imports and continued export growth showed underlying strength in the New Zealand economy.
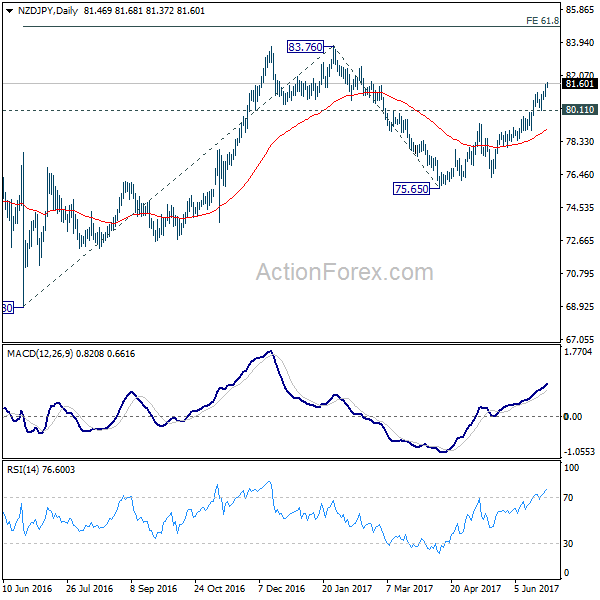
NZD/JPY is one of the strongest pairs for the month. The rise from April low at 75.65 extends to as high as 81.68 so far. Near term outlook will remain bullish as long as 80.11 support holds. And such rally is expected to head for a test on 83.76 high next. At this point, it's uncertain whether the whole rise from 2016 low at 68.88 is developing into an medium term impulsive or correct move. Key focus will be on the reaction to 61.8% projection of 68.88 to 83.76 from 75.65 at 84.84.
USD/JPY Daily Outlook
Daily Pivots: (S1) 111.34; (P) 111.64; (R1) 112.16; More...
USD/JPY's rally from 108.81 resumed by taking out 111.78 temporary top and reaches as high as 112.07 so far. Intraday bias is back on the upside for channel resistance (now at 112.99). Sustained break there will suggest that whole pull back from 118.65 has completed at 108.12 already. In such case, further rise should be seen to 114.36 resistance for confirmation. On the downside, however, break of 110.94 support will argue that rebound from 108.81 has completed and turn bias back to the downside.
In the bigger picture, price actions from 125.85 high are seen as a corrective pattern. It's uncertain whether it's completed yet. But in case of another fall, downside should be contained by 61.8% retracement of 75.56 to 125.85 at 94.77 to bring rebound. Overall, rise from 75.56 is still expected to resume later after the correction from 125.85 completes.
Economic Indicators Update
| GMT | Ccy | Events | Actual | Forecast | Previous | Revised |
|---|---|---|---|---|---|---|
| 22:45 | NZD | Trade Balance (NZD) May | 103M | 420M | 578M | 536M |
| 9:30 | GBP | BoE Financial Stability Report | ||||
| 10:00 | GBP | CBI Realized Sales Jun | 2 | 2 | ||
| 13:00 | USD | S&P/Case-Shiller Composite-20 Y/Y Apr | 5.90% | 5.90% | ||
| 14:00 | USD | Consumer Confidence Jun | 116 | 117.9 |
Draghi sends USD higher in face of soft US data | DXY, USDJPY
Despite weak data from thr US, it was dovish comments from Draghi and hawkish comments from the Fed which helped lift the Dollar.
Speaking to students in Lisbon, Draghi once again lowered expectations of ECB tightening to send the Euro lower and support the Greenback. This helped to erase losses seen from weak durable goods and manufacturing data, which was extended further once Fed members continued their hawkish commentary.
Durable goods and manufacturing sentiment added to the long list of weak data from the US, to weight on the Greenback despite further hawkish comments from Fed members. Durable goods declined -1.1% compared with -0.8% prior and -0.6% expected. This makes it the 2nd month of contraction which has helped drag the YoY rate to just 2.7%. Excluding transportation durable goods managed to squeeze a 0.1% expansion in June, yet does not quite claw back the -0.5% contraction in May. The YoY% rate however is at a slightly heathier level of 5.5% and the underlying index is just below 3 year highs.
GDP data for Q1 will be revised this week, although the real concern going forward is that data so far for Q3 is also below par and leading sentiment indicators aren't reviving hopes of a rebound. If we continue to see PMI surveys soften and hard data such as durable goods, inflation or growth struggle to rebound then it essentially kills off any need for the Fed to raise. Markit PMI data also disappointed on Friday and these reads can lead the rise of fall of GDP by 6-12 months on average.
For the foreseeable future, we doubt the US Dollar Index will be able to break out of the 96.50 - 97.88 range. Whilst the Fed continue with their hawkish narrative to help support the Dollar, the data which is presented prevents it from breaking higher. This also means we doubt we'll see significant trends develop unless we see either of these opposing forces switch to the other's side (dovish fed with weak data, or hawkish fed with strong data).
D1 closed with a bullish piercing pattern to warn of near-term strength, although at current levels the rewards to risk ratio may be undesirable to trade D1 as we are too close to the monthly pivot (black line). Moreover, the rally from the bullish pinback may be part of a correction higher which also limits the potential upside form here. So, we may want to monitor for signs of weakness below 97.881 to aid timing a long position on EURUSD. An alternative scenario (and least favoured under the current climate) I for an inverted head and shoulders pattern to materialise. We would need to see a form close above 97.88 (neckline) and if successful it projects an approximate target around 99.50.
A more bullish scenario appears to be forming with USDJPY. We highlighted the minor pullback above 11080 last week and we have now seen a bullish follow-through. If we can clear the 112.10 resistance level then we find ourselves in an area which has relatively little in the way of resistance towards the 114.38 target. If we are to see a decent close above 112.10 then the odds of a direct rally towards target is increased. Yet if we are to falter around current levels and return to 110.80, then we must consider a deeper pullback and frustratingly slower journey towards the eventual target.
CRUDE OIL – Builds Up On Bull Recovery
CRUDE OIL - The commodity continues to retain its upside pressure on correction. On the downside, support resides at the 43.00 level where a break will expose the 42.50 level. A cut through here will set the stage for a run at the 42.00 level. Further down, support resides at the 41.50 level. Its daily RSI is bullish and pointing higher suggesting further strength. On the upside, resistance resides at the 44.00 level. Further out, resistance comes in at the 44.50 level. A break above here will aim at the 45.00 level and then the 45.50 level followed by the 46.00 level. All in all, CRUDE OIL remains biased to the upside on further strength.
A Slow Burn
A Slow Burn
Slow start to the week for markets with so many countries out on holiday (on account of Eid or local holidays), As well, investors remain extremely tentative ahead of this week’s star-studded cast of central bankers hitting the airwaves. In addition to the ECB Forum (the equivalent to Jackson-Hole schmooze fest ) being held in Sintra, Portugal this week., Dr Yellen makes an appearance in London later today. But despite the plethora of central bankers on tap, it’s unlikely there will be any revelations on monetary policy forthcoming.And given the proximity to the recent FOMC, there will certainly be no backpedalling from Dr Yellen. However, the week could turn interesting, yet highly inconclusive, as currency markets get knocked to and fro driven by month/quarter/half year end flows this week, so best not to bring out the summer desk pillow just yet.
While it’s difficult to put much trust in current price action ( using overnight Gold price as an example) risk sentiment seems improved. And with few negatives hitting the airwaves, dealers were left to assume the age-old adage of no news is good news. Equities are trading in the green ever so slightly, oil prices are moving higher, and FX has followed correspondingly
Japanese Yen
The beneficiary of the positive shift in risk sentiment is the USDJPY which has been trading in sympathy with Oil and equities. With the price of oil back from the dead, it provided the overnight fillip for the dollar-yen bulls. After a slow burn higher throughout the NY morning, an afternoon NY gap took out the 110.80 level (100 days moving average), and the markets are now within striking distance of the psychological 112.00 level. With the JPY crosses trading well, a push higher looks in the cards.
British Pound
The pound appears to have returned to its post-election happy valley between 1.2700-1.2750 although the markets have quite been quiet with volumes well below average. Even a new deal with Northern Ireland’s DUP party failed to animate. It seems that any optimism remains short lived these days, after all, that’s to rejoice about the possibility of another election and ongoing Brexit uncertainty. Not to mention rising inflation, weak wage growth and a negative shift in recent economic data is hardly a confidence builder for the Pound
Australian Dollar
The Australian dollar is firmer on the back of higher Iron ore and oil prices. The uptick in oil prices has buoyed risk sentiment, and global investors are expressing some pockets, small mind you, of interest in both commodity based and higher yielding currencies overnight. Despite the positive risk vibe, there will likely be some hesitation to breach the .7600 level with Dr Yellen on tap as there’s little chance of policy back peddling and if anything she may reaffirm her for FOMC hawkish view.