Sample Category Title
USD/CAD Canadian Dollar Higher After US Durable Goods Disappoint
The Canadian dollar started the week gaining versus the US dollar. The comments from Bank of Canada (BoC) policy makers on June 11 had pushed the loonie higher against the greenback, but the Fed turned up the rhetoric last week to even things out. Fed members were mixed in their endorsement/criticism of the aggressive rate hike path, but most were in agreement that the central bank needs to start shrinking its massive balance sheet. The trillions of dollars which were accumulated as part of the Fed's quantitive easing program and are still in the books of the CB need to be sold in a gradual manner for true normalization to be achieved.
The week started with few economic indicators to guide the market. New orders for US durable goods in May fell by 1.1 percent month to month, removing transportation items also disappointed with a 0.1 percent gain when 0.4 percent was expected. Second quarter growth has proven sluggish and the durable goods data hit the USD to the downside. The main champion for the dollar has been the Fed and this week there will be plenty of fedspeak to digest with three Federal Open Market Committee (FOMC) members due to speak on Tuesday.
Oil prices are higher on the North American session than last week. This all could change with the release of the US crude inventories on Wednesday at 10:30 am EDT. The OPEC oil production cut agreement has failed to spark a rally in energy prices when US and other non-agreement producers are ramping up their supply keeping the crude glut in place.
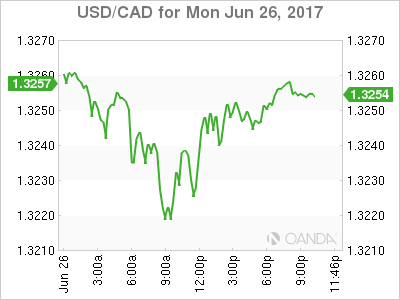
The USD/CAD lost 0.253 percent in the last 24 hours. The currency pair is trading at 1.3237 after a disappointing US durable goods number early on Monday. The final reading of the US second quarter GDP will be released on Thursday, June 28 at 8:30 am EDT with growth now expected to be lower than the 1.2 percent gain reported last month.
Bank of Canada (BoC) Governor Stephen Poloz will be in Europe this week to attend the European Central Bank (ECB) Forum in Portugal. He will be joined in a panel by the heads of the Bank of England (BoE), Bank of Japan (BOJ) and the host. At this stage the BOJ stands apart as the other have made hawkish statements about their respective economies being on the mend with rate hikes and end of QE programs to start this year. In Canada the comments from Deputy Governor Carolyn Wilkins in Winnipeg put a rate hike firmly on the table for this year. The weak inflation data on Friday is not expected to derail an upcoming hike, but it could have pushed it further back towards the fourth quarter or later.
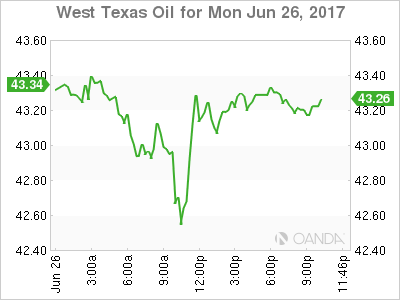
Crude gained 0.799 percent in the last 24 hours. West Texas Intermediate is trading at $43.27 near daily highs after a slow start to the week. Energy prices managed to trade above the $43 price line awaiting the weekly inventory data that tells the score between the Organization of the Petroleum Exporting Countries (OPEC) production cuts and the US ramp up of supply.
Energy prices touched 7 month lows last week and market sentiment is expecting another drop, specially if inventories of crude or gasoline in the US show another large buildup. US production has grown by about 10 percent with Brazil and Canada also increasing output, while the OPEC is now considering further cuts to keep prices from falling further.
Market events to watch this week:
Tuesday, June 27
10:00 am USD CB Consumer Confidence
Wednesday, June 28
10:30 am USD Crude Oil Inventories
Thursday, June 29
8:30 am USD Final GDP q/q
8:30 am USD Unemployment Claims
Friday, June 30
4:30 am GBP Current Account
8:30 am CAD GDP m/m
Pound Inches Upwards, PM May Secures DUP Support
The British pound has started the trading week quietly. In North American trade, GBP/USD has ticked higher and is trading at 1.2730. On the release front, British BBA Mortgage Approvals dipped to 40.3 thousand, matching the forecast. In the US, durable goods orders missed expectations, disappointing the markets. Core Durable Goods came in at 0.1%, missing the forecast of 0.4%. Durable Goods Orders declined 1.1%, short of the forecast of -0.5%. On Tuesday, we’ll get a look at CB Consumer Confidence and Fed Chair Janet Yellen will speak at an event in London.
It’s been a rough few weeks for British Prime Minister Theresa May, who suffered a major setback in the recent election, as she lost her majority in parliament. May has had to deal with domestic critics, some who have been blistering in their attacks on her poor performance in the election. With the Brexit talks finally underway, May has to deal with European leaders who are unhappy with Britain ditching their club. There was finally some good news on Monday for the embattled May, who reached an agreement with the DUP, a small Irish party. The DUP will not formally enter the government, but has committed to support the government on its legislative agenda, Brexit and the budget. In return, May will provide Northern Ireland with an additional one billion pounds over the next two years. The deal should provide May with some breathing room in parliament, allowing her to shift gears from damage control and focus on the economy and the Brexit negotiations.
There was positive news last week from the US construction industry. On Friday, New Home Sales jumped to 610 thousand, above the forecast of 599 thousand. Earlier in the week, Existing Home Sales improved to 5.62 million, beating the estimate of 5.54 million. There had been concerns about construction numbers, as Building Permits and Housing Starts both missed expectations in the May releases. Later in the week, the economy receives a report card, with the release of Final GDP for the first quarter. Preliminary GDP, which was released in May, came in at 1.2%, and this is the forecast for Final GDP. Will weak inflation and consumer spending result in a weaker than expected GDP report? If so, the US dollar could be a casualty and lose ground against its rivals.
Bearish Trend In Oil
Due to the jack of all trades nature of my role, I didn't manage to get my forex daily market update blog published yesterday. As a result, here it is today!
If you haven't noticed when you've gone to fill up your car at the local petrol station, petrol is cheap! Since we featured the following daily resistance zone, a lot has changed.
So let's take another look at oil:
Oil Daily:
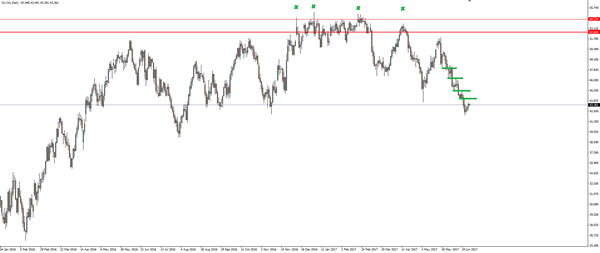
As I'm sure you're aware, each market essentially has its own different personality when it comes to the way that price moves between support and resistance levels. When commodities markets like oil trend, they tend to REALLY trend. Just take a look at that last little down leg (I say little in the context of the daily chart, but there's 2 months worth of candles in there) and you can see what I mean.
I've then zoomed into an intraday chart, which is in this case an hourly, to highlight the trending nature of the market. The chart looks a bit boring zoomed out as far as I have, but I needed to do this so I could show the entire move down from where price last rejected down out of the higher time frame resistance zone.
Oil Hourly:
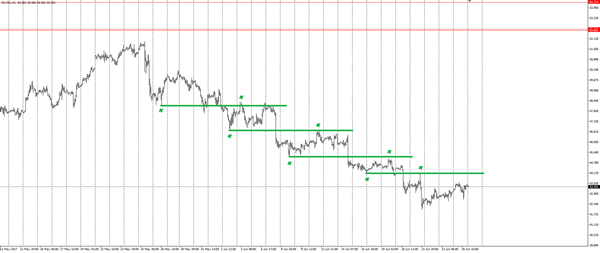
If you're a forex trading textbook manufacturer, you're free to use this chart to highlight how price moves between levels in a perfect down trend. Here you can clearly see how short term support forms, short term support breaks and short term support is finally retested as resistance. Rinse then repeat as many times as necessary.
Yen Ticks Lower, US Durables Disappoint
USD/JPY is showing limited movement at the start of the week. The pair has posted small losses on Monday and is trading at 111.50 in North American trade. In Japan, the BoJ released its Summary of Opinions for the June policy meeting, and SPPI was unchanged at 0.7%, matching the forecast. In the US, durable goods orders were soft – Core Durable Goods came in at 0.1%, missing the forecast of 0.4%. Durable Goods Orders declined 1.1%, short of the forecast of -0.5%. On Tuesday, we'll get a look at CB Consumer Confidence and Fed Chair Janet Yellen will speak at an event in London.
The BoJ Summary of Opinions didn't contain any nuggets with regard to monetary policy, as policymakers said that inflation would likely remain at low levels for an extensive period, which meant that the bank's ultra-loose accommodative policy would stay in place until a stronger economy pushed up prices. At the same time, the board members acknowledged that it was important for the BoJ to clearly communicate its plans to the markets. In the immediate present, that meant that the markets should be discouraged from speculating that the bank would withdraw monetary stimulus anytime soon. Japan's economy has shown improvement, leading to speculation on the part of the markets that the BoJ might taper its policy, but the BoJ has reiterated that this is a non-starter before inflation moves closer to the bank's target of 2.0%.
US durable goods releases were weak in May. Core Durable Goods broke a streak of two straight declines, but the weak gain of 0.1% missed expectations. Durable Goods declined 1.1%, its sharpest decline since June 2016. The slowdown in orders of business equipment could weigh on second quarter growth. Last week, it was the turn of construction numbers to disappoint, as Housing Starts and Building Permits both missed expectations. Later in the week, the economy receives a report card, with the release of Final GDP for the first quarter. Preliminary GDP, which was released in May, came in at 1.2%, and this is the forecast for the upcoming GDP report. Consumer spending has also been softer than expected, and this means that Final GDP could miss expectations. If the economy falls short of this modest estimate, the dollar could respond with losses.
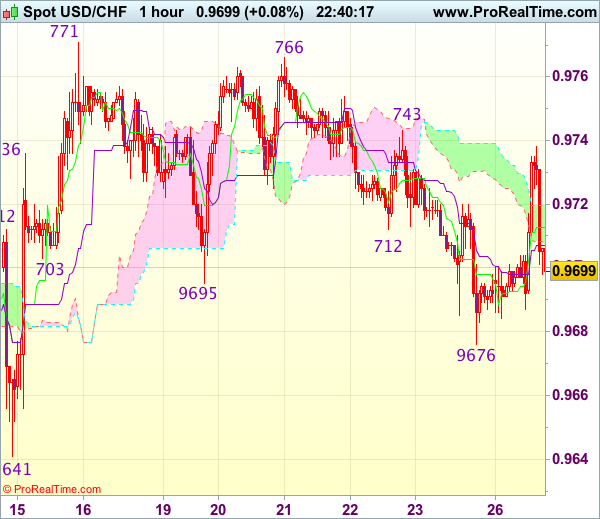
Trade Idea Wrap-up: USD/CHF – Stand aside
USD/CHF - 0.9706
Most recent candlesticks pattern : N/A
Trend : Near term up
Tenkan-Sen level : 0.9713
Kijun-Sen level : 0.9711
Ichimoku cloud top : 0.9715
Ichimoku cloud bottom : 0.9702
New strategy :
Stand aside
Position : -
Target : -
Stop : -
Despite intra-day brief rise to 0.9738, lack of follow through buying and current retreat suggest downside risk remains and test of support at 0.9676 (Friday’s low) cannot be ruled out, break there would signal the erratic fall from 0.9771 top is still in progress for retracement of recent rise, hence further weakness to 0.9660 would be seen, however, as broad outlook remains consolidative, still reckon downside would be limited to 0.9641 support, risk from there is seen for another rise to take place later.
On the upside, expect recovery to be limited to resistance at 0.9720 and price should falter below resistance at 0.9743, bring another decline later. Only a firm break above resistance at 0.9743 would revive bullishness and signal low is formed, bring test of 0.9766-71 resistance first. Once this resistance is penetrated, this would confirm recent rise from 0.9613 low has resumed for test of resistance at 0.9808, then towards another previous resistance at 0.9825.
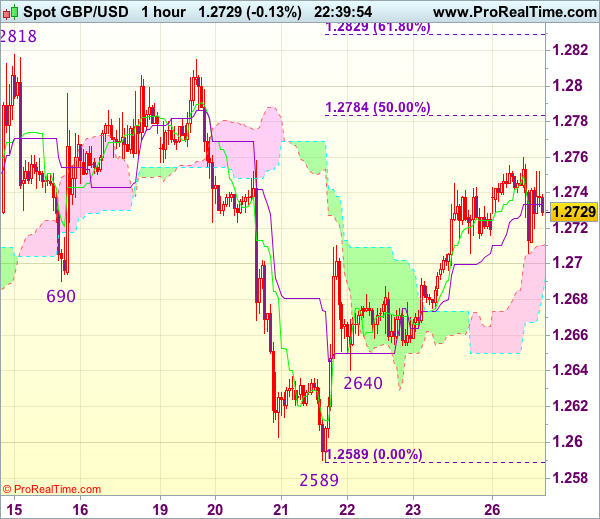
Trade Idea Wrap-up: GBP/USD – Stand aside
GBP/USD - 1.2736
Most recent candlesticks pattern : N/A
Trend : Near term down
Tenkan-Sen level : 1.2750
Kijun-Sen level : 1.2733
Ichimoku cloud top : 1.2699
Ichimoku cloud bottom : 1.2661
New strategy :
Stand aside
Position : -
Target : -
Stop : -
As cable has continued moving higher after last week’s strong rebound from 1.2589, suggesting near term upside risk remains for this move to bring retracement of recent decline to 1.2780-85 (50% Fibonacci retracement of 1.2978-1.2589), however, reckon upside would be limited to 1.2800 and price should falter below resistance at 1.2818, bring another selloff later.
In view of this, would not chase this move here and would be prudent to stand aside for now. Below 1.2705-10 would suggest an intra-day top is formed, bring weakness towards 1.2675-80 but break of latter level is needed to signal the rebound from 1.2589 has ended, bring retest of this level later.
Dollar Falls on Durable Goods Miss; Sterling Boosted on DUP Deal; Gold Declines
The main economic releases during today's European session pertained to durable goods orders out of the US and the Ifo business sentiment survey out of Germany. Beyond these, gold experienced a considerable decline and sterling received a boost after UK Prime Minister struck a deal with Northern Ireland's Democratic Unionist Party which would support her minority government.
In US economic releases, durable goods orders fell by 1.1% in May. This negatively compares to the 0.6% drop expected and exceeds April's decline by 0.9%. The data point to a loss in momentum in the manufacturing sector during the middle of the second quarter of the year.
In terms of reaction in the forex markets to the durable goods numbers, the dollar experienced sizable losses relative to majors including the yen and the euro as the data hit the markets. Dollar/yen fell to as low as 111.35. The pair traded at 111.66 previously. Euro/dollar rose to its highest on the day, at 1.1219, shortly after the figures were released. This also marks an eleven-day high for the pair which traded at 1.1188 before the data became public.
The dollar index, a broader gauge of the US currency's strength, was down one-tenth of a percent in afternoon European trading hours. Earlier in the day, San Francisco Fed President (a non-voting FOMC member), John Williams delivered a hawkish speech during which he said "If we delay (hiking) too long, the economy will eventually overheat, causing inflation or some other problem." His talk failed to significantly lift the greenback as investors remain sceptical. The CME Group's 30-day Fed Fund futures prices are currently placing the odds of another rate hike at less than 50% during the Fed's December meeting. Dollar/yen was last up on the day, trading at 111.42. In the meantime, euro/dollar was up, above the 1.12 handle. Federal Reserve Chair Janet Yellen will be speaking tomorrow in London.
During morning European trading hours, the Ifo institute's survey gauging business sentiment in Germany, Europe's largest economy, was released. The institute's business climate index for the month of June beat expectations, rising to the all-time high of 115.1 from May's 114.6. Forecasts were for a reading of 114.5. The sub-indices measuring current business conditions and expectations for the future were also released above projections and their respective figures from the previous month. The German economy seems to be maintaining positive momentum, being helped by private consumption and dodging potential threats to growth for the time being such as Brexit developments and upcoming federal elections in September. The Ifo institute chief Clemens Fuest stated that "Sentiment among German businesses is jubilant". Despite the upbeat figures, euro/dollar edged lower, though not by much, upon immediate release of the data.
Sterling firmed up, hitting a one-week high of $1.2759 in early European session, amid the news that Theresa May was about to seal a deal with the Democratic Unionist Party, which would give her a better grip of the government. Such a deal materialized a couple of hours later. Pound/dollar eased later in the day but was last still marginally up on the day, trading at 1.2741. Relative to the euro, sterling was slightly lower in afternoon European trading, with euro/pound eyeing the 0.88 handle.
Taking a look at gold, the precious metal steeply declined as a result of a large sell order hitting the markets today. In particular, the commodity fell to the more than one-month low of $1235.84 an ounce. Reports made reference to an accidental sale with the seller trying to quickly make up for the mistake by placing long positions immediately after. The precious metal made up for a significant part of the loss but was still last trading more than 1.0% down on the day, at $1244.25 an ounce.
Looking ahead, European Central Bank President Mario Draghi is scheduled to give a speech at 17:30 GMT.
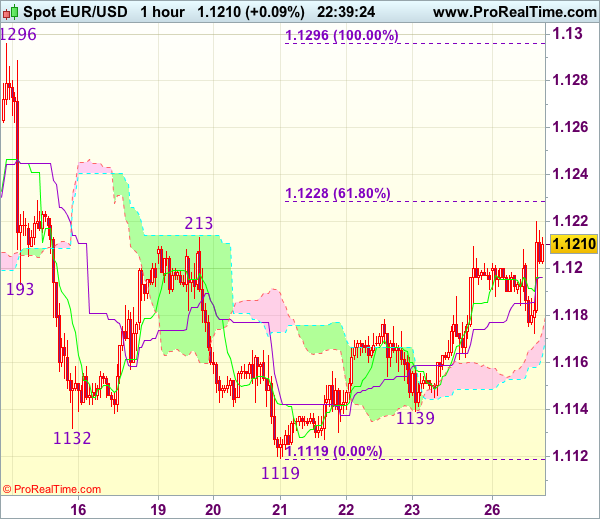
Trade Idea Wrap-up: EUR/USD – Stand aside
EUR/USD - 1.1201
Most recent candlesticks pattern : N/A
Trend : Near term down
Tenkan-Sen level : 1.1196
Kijun-Sen level : 1.1196
Ichimoku cloud top : 1.1180
Ichimoku cloud bottom : 1.1170
New strategy :
Stand aside
Position : -
Target : -
Stop : -
The single currency has risen again after brief pullback to 1.1172, retaining our view that near term upside risk remains for the rebound from 1.1119 (last week’s low) to extend gain to 1.1228-30 (61.8% Fibonacci retracement of 1.1296-1.1119), however, reckon upside would e limited to 1.1260-70 and price should falter well below resistance at 1.1296, bring retreat later.
In view of this, would not chase this rise here and would be prudent to stand aside for now. Below said intra-day support at 1.1172 would bring weakness towards 1.1139 support but break there is needed to revive bearishness and signal top is formed, bring retest of 1.1119.
Trade Idea Wrap-up: USD/JPY – Buy at 110.65
USD/JPY - 111.40
Most recent candlesticks pattern : N/A
Trend : Near term up
Tenkan-Sen level : 111.36
Kijun-Sen level : 111.32
Ichimoku cloud top : 111.35
Ichimoku cloud bottom : 111.26
Original strategy :
Buy at 110.65, Target: 111.65, Stop: 110.30
Position : -
Target : -
Stop : -
New strategy :
Buy at 110.65, Target: 111.65, Stop: 110.30
Position : -
Target : -
Stop : -
Although the greenback rebounded after finding support at 110.95 last week and gain towards resistance at 111.79 (last week’s high) cannot be ruled out, break there is needed to signal recent upmove has resumed and extend headway to 111.90-95 (50% projection of 108.82-111.42-110.65), however, upside should be limited to resistance at 112.13 and 112.25 (61.8% Fibonacci retracement of 114.37-108.82 and 61.8% projection) should hold. If said resistance at 111.79 continues to hold, then further consolidation would take place and another retreat to 110.95 cannot be ruled out, however, previous support at 110.65 would limit downside and bring another rise later.
In view of this, would not chase this rise here and we are looking to buy dollar on pullback as 110.65 support should limit downside. Below 110.30-35 (50% Fibonacci retracement of 108.82-111.79 and previous resistance turned support) would abort and signal a temporary top has been formed instead, risk weakness towards 109.95-00 (61.8% Fibonacci retracement).

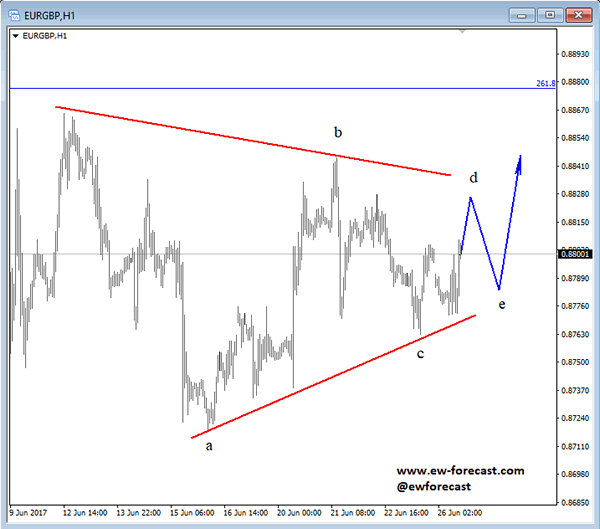
Elliott Wave Analysis: EURGBP Trading In A Triangle Correction; More Gains In View
EURGBP can be trading in a triangle of a higher degree, with current intra-day movement representing sub-wave d. Once leg d finds resistance, a new three wave movement may develop within the following wave e. That said more gains may follow on the pair, once the whole correction find support and fully unfolds.
EURGBP, 1H