
Sample Category Title
Daily Technical Analysis: USD/JPY Classical Wave 4 Pattern After Bullish Momentum
Currency pair USD/JPY
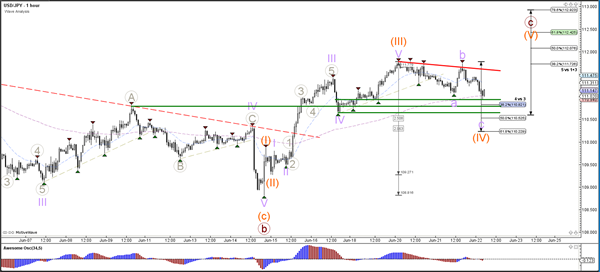
The USD/JPY failed yesterday to break the top resistance (red). Price is now building a potential pullback within wave 4 (orange) which could find support (green) at the previous bottom and tops. The retracement is starting to resemble a bull flag chart pattern, which could offer a bullish continuation signal upon a bullish breakout.
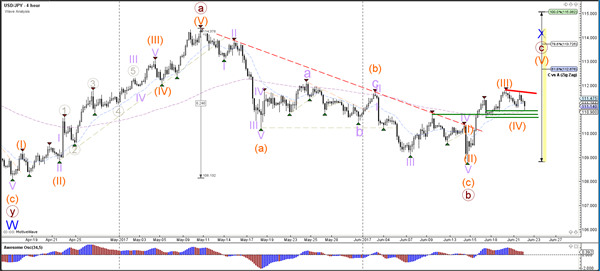
The potential USD/JPY retracement within wave 4 (orange) could also receive support from the Fibonacci levels of wave 4 vs 3. A bullish break could price start wave 5 (orange) whereas a break below the 61.8% Fib makes a wave 4 (orange) unlikely.
Currency pair EUR/USD
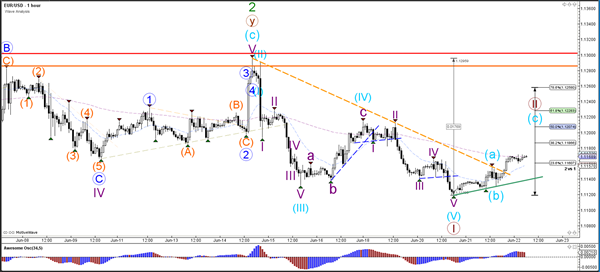
The EUR/USD is retracing back up after breaking below the long-term support trend line (dotted blue). Price will need to break below the bottom at 1.11 before a potential wave 3 becomes likely. At this point a break, pullback and continuation seems the most probable scenario, which is why a wave 1 and 2 (brown) is indicated on the chart.
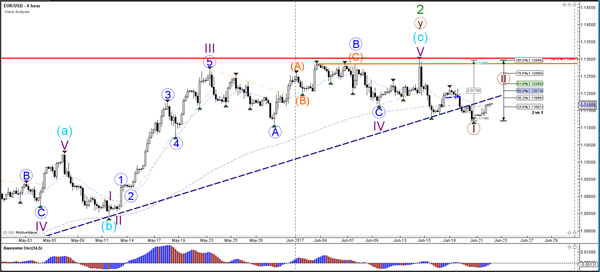
The EUR/USD is showing divergence between the bottoms which could cause a wave 2 (brown) retracement via an ABC zigzag (blue). Price invalidates wave 2 (brown) if price manages to break above the 100% Fibonacci level. A break below support (green) could indicate a continuation of the bearish trend.
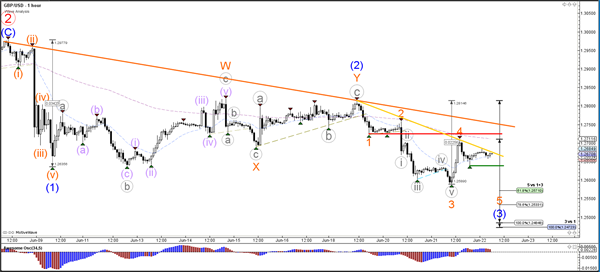
Currency pair GBP/USD
The GBP/USD bearish breakout below support (dotted blue) has not gained much bearish momentum as yet. A continuation below 1.26 is needed before further bearish extension towards the Fib targets of wave 3 (blue) is possible.
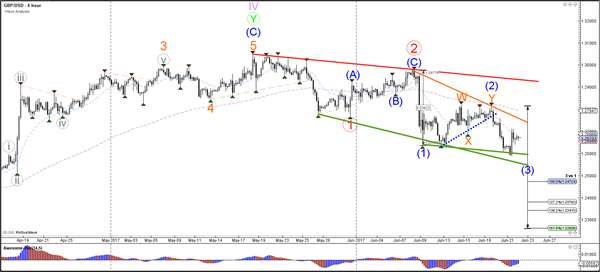
The GBP/USD completed a wave 4 and 5 (grey) yesterday and is now in a new potential wave 4 (orange). This wave is invalidated if price manages to break above the bottom of wave 1 (orange), which is indicated by the resistance trend line (red). A break below support (green) could see the continuation of wave 3 (blue).
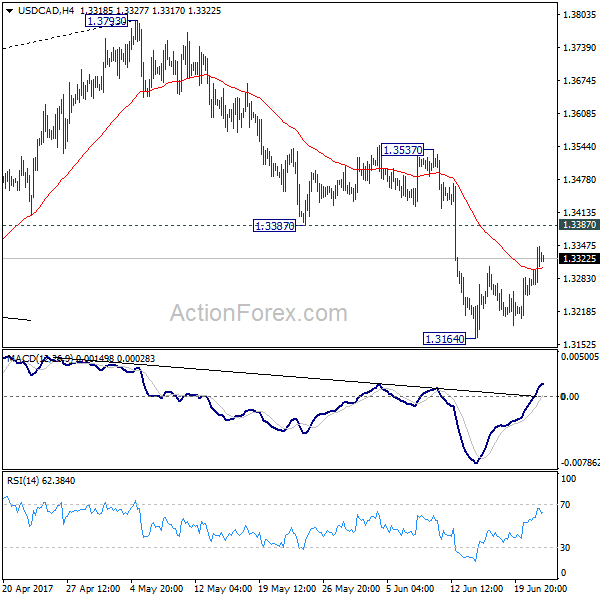
USD/CAD Daily Outlook
Daily Pivots: (S1) 1.3278; (P) 1.3312; (R1) 1.3364; More....
USD/CAD's corrective rise from 1.3164 is still in progress. But it's kept below 1.3387 support turned resistance. Intraday bias remains neutral with bearish outlook. We're holding on to the view that corrective rise from 1.2460 has completed at 1.3793 already. Below 1.3164 will target 1.2968 cluster support, 61.8% retracement of 1.2460 to 1.3793 at 1.2969. However, firm break of 1.3387 will dampen our view and turn focus back to 1.3537 resistance next.
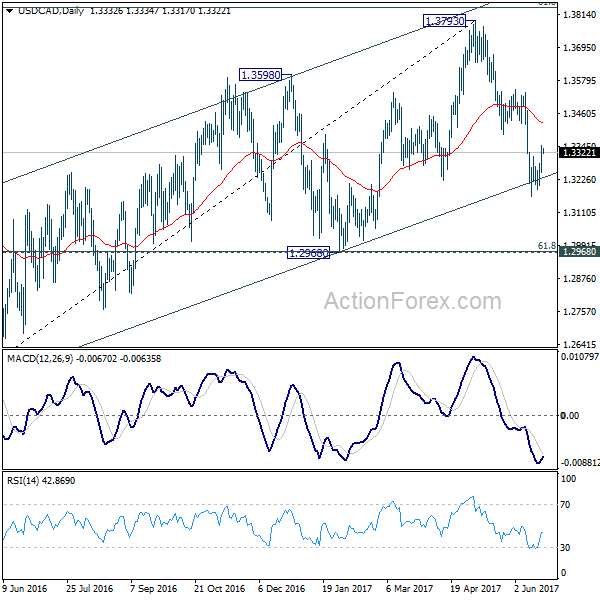
In the bigger picture, price actions from 1.4689 medium term top are seen as a correction pattern. The first leg has completed at 1.2460. Rise from 1.2460 is seen as the second leg and has completed at 1.3793, ahead of 61.8% retracement of 1.4689 to 1.2460 at 1.3838. Break of 1.3222 should now indicate the start of the third leg while further break of 1.2968 should confirm. In that case, USD/CAD should decline through 1.2460 support to 50% retracement of 0.9406 to 1.4869 at 1.2048.
AUD/USD Daily Outlook
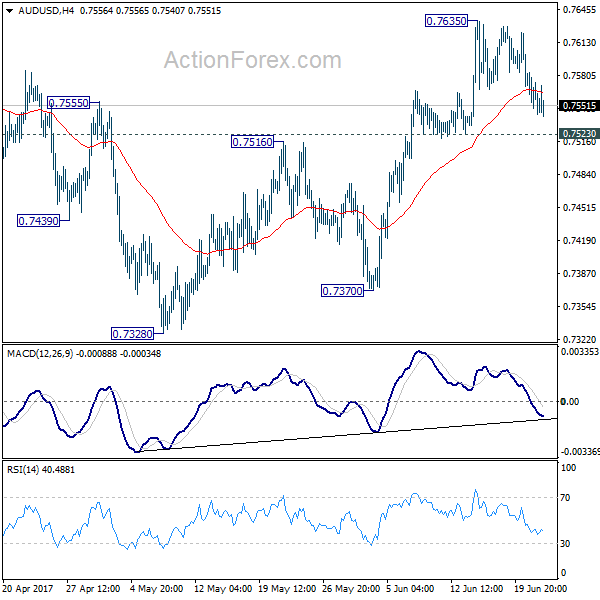
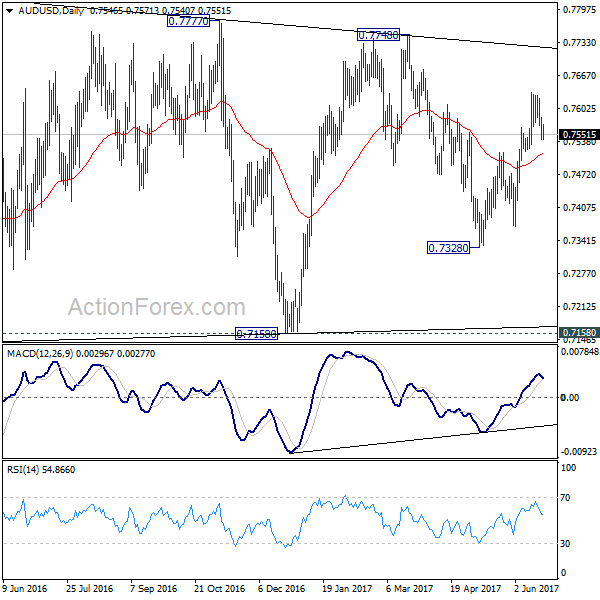
Daily Pivots: (S1) 0.7558; (P) 0.7591; (R1) 0.7611; More....
AUD/USD's retreat from 0.7635 continues today and it's staying above 0.7523 minor support. Intraday bias remains neutral first. With 0.7523 intact, further rise is expected. Break of 0.7635 will extend the rise from 0.7328 to 0.7748 resistance and above. At this point, there is no clear sign of range breakout at. Hence, we'd be cautious on topping again as it approaches medium term fibonacci level at 0.7849. Meanwhile, break of 0.7523 will argue that rebound from 0.7328 is possibly completed. In that case, intraday bias will be turned back to the downside for 0.7370 support.
In the bigger picture, we're still treating price actions from 0.6826 low as a corrective pattern. And, as long as 38.2% retracement of 0.9504 to 0.6826 at 0.7849 holds, long term down trend from 1.1079 is expected to resume sooner or later. Break of 0.6826 low will target 0.6008 key support level. However, firm break of 0.7849 will indicate that rise from 0.6826 is developing into a medium term rebound, rather than a sideway pattern. In such case, stronger rise should be seen to 55 month EMA (now at 0.8116) and above.
New Zealand Dollar Mildly High on Slight RBNZ Hawkish Turn, Markets Range Bound in General
While there was some volatility, the forex markets are generally staying in last week's range as most pairs engage in consolidative trading. New Zealand Dollar firms up slightly today as markets view RBNZ's statement as a mild hawkish turn. Meanwhile, that is followed by rebound in the Japanese Yen as oil rout continues. WTI crude oil dived further to as low as 42.05 overnight and stays soft at around 42.5. The development dragged stocks and 30 year yield down as DOW lost -0.27% and S&P 500 dropped -0.06%. Canadian Dollar is also under some pressure with oil and will try to get some support from retail sales data to be released today.
Mild RBNZ hawkish turn
New Zealand Dollar strengthens broadly after RBNZ left the OCR unchanged at record low of 1.75% as widely expected. There are two main factors that are driving up the Kiwi. Firstly, RBNZ removed "developments since the February Monetary Policy Statement on balance are considered to be neutral for the stance of monetary policy." While the the central bank is still in general in a neutral stance, some traders perceive the removal of the sentence as a mild hawkish turn. Secondly, RBNZ noted the around 3% rise in trade-weighted exchange rate since May. And it attributed that increase as "partly in response to higher export prices". While it still noted that a lower NZD will "help rebalance the growth outlook towards the tradables sector", it's not too concerned with the rise in exchange rates.
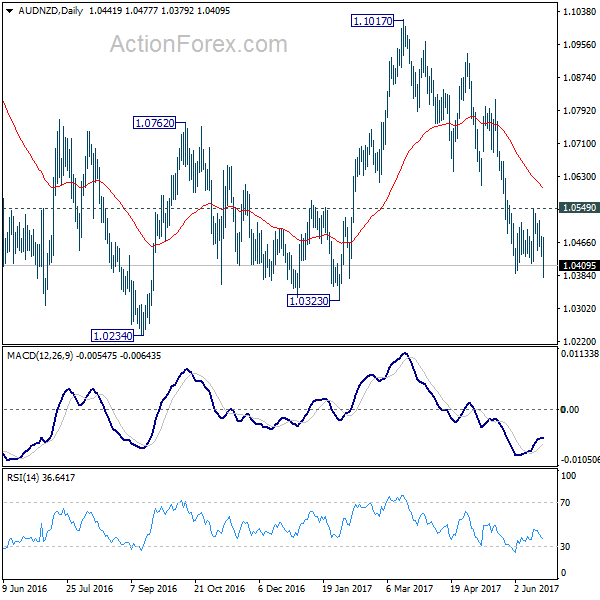
AUD/NZD resume decline
AUD/NZD breaches last week's low of 1.0389 and reaches as low as 1.0379 before recovering mildly. Technically, the fall from 1.1017 is still in progress in spite of loss of downside momentum. Deeper decline is expected to 1.0234/0323 support zone in near term. This bearish case will be favored as long as 1.0549 resistance holds.
May to brief EU leaders on citizen rights
EU leaders will start a two-day meeting in Brussels today. This will be French president Emmanuel Macron's debut in the European Council Summit. Some attention will be on the impact of the new Frenco-German alliance. But the bigger focus would be on UK Prime Minister May, who's having her first EC Summit since the disastrous election. May is expected to brief the other 27 leaders on the principles of citizens' right regarding Brexit. This topic, along with the financial settlement and Ireland, are the top priorities in Brexit negotiation. And it involves 3.2 million EU citizens living in UK and 1.2 million Britons living in EU.
While Sterling was lifted by hawkish turn of BoE chief economist Andy Haldane overnight, there was no follow through buying. The markets are left confused by mixed messages. And there are still a lot of uncertainties regarding Brexit. Such picture is reflection of what's happening in the MPC. Sterling is still maintaining bearish outlook against Euro, Dollar and Yen.
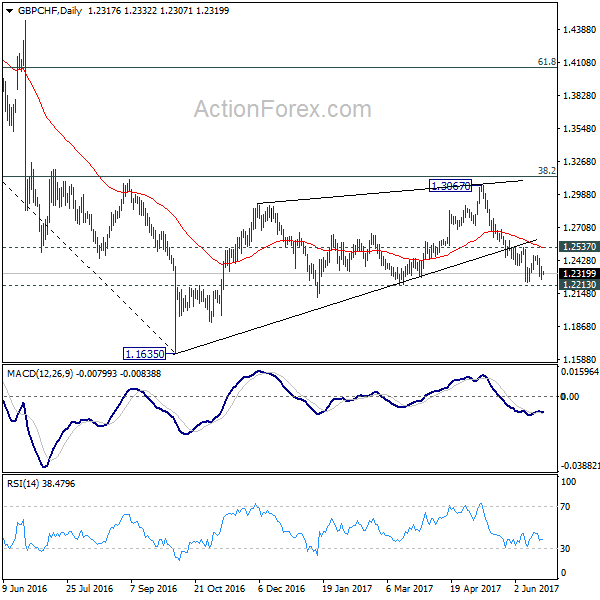
GBP/CHF stays bearish
Indeed, the weakness of the rebound is also clearly seen in GBP/CHF. For the moment, outlook stays bearish with the cross kept well below near term resistance at 1.2537. We're holding on to the view that correction from 1.1635 has completed with three waves up to 1.3067. And break of 1.2213 would extend the larger down trend through this 1.1635 low.
Elsewhere...
Swiss will release trade balance in European session while UK will release CBI trends total orders. Canada retail sales will be a key focus in US session. US will release jobless claims, house price index and leading indicators.
AUD/USD Daily Outlook
Daily Pivots: (S1) 0.7558; (P) 0.7591; (R1) 0.7611; More....
AUD/USD's retreat from 0.7635 continues today and it's staying above 0.7523 minor support. Intraday bias remains neutral first. With 0.7523 intact, further rise is expected. Break of 0.7635 will extend the rise from 0.7328 to 0.7748 resistance and above. At this point, there is no clear sign of range breakout at. Hence, we'd be cautious on topping again as it approaches medium term fibonacci level at 0.7849. Meanwhile, break of 0.7523 will argue that rebound from 0.7328 is possibly completed. In that case, intraday bias will be turned back to the downside for 0.7370 support.
In the bigger picture, we're still treating price actions from 0.6826 low as a corrective pattern. And, as long as 38.2% retracement of 0.9504 to 0.6826 at 0.7849 holds, long term down trend from 1.1079 is expected to resume sooner or later. Break of 0.6826 low will target 0.6008 key support level. However, firm break of 0.7849 will indicate that rise from 0.6826 is developing into a medium term rebound, rather than a sideway pattern. In such case, stronger rise should be seen to 55 month EMA (now at 0.8116) and above.
Economic Indicators Update
| GMT | Ccy | Events | Actual | Forecast | Previous | Revised |
|---|---|---|---|---|---|---|
| 21:00 | NZD | RBNZ Rate Decision | 1.75% | 1.75% | 1.75% | |
| 6:00 | CHF | Trade Balance (CHF) May | 2.44B | 1.97B | ||
| 8:00 | EUR | ECB Economic Bulletin | ||||
| 10:00 | GBP | CBI Trends Total Orders Jun | 7 | 9 | ||
| 12:30 | CAD | Retail Sales M/M Apr | 0.30% | 0.70% | ||
| 12:30 | CAD | Retail Sales Less Autos M/M Apr | 0.70% | -0.20% | ||
| 12:30 | USD | Initial Jobless Claims (17 Jun) | 240K | 237K | ||
| 13:00 | USD | House Price Index M/M Apr | 0.50% | 0.60% | ||
| 14:00 | EUR | Eurozone Consumer Confidence Jun A | -3 | -3.3 | ||
| 14:00 | USD | Leading Indicators May | 0.40% | 0.30% | ||
| 14:30 | USD | Natural Gas Storage | 78B |
What’s Really Going On In Crude Oil Markets?
Key Points:
- Crude Oil (WTI) prices fall below November low.
- Shale oil gaining in technological advantage.
- Watch for continued downward pressure as crude oil markets continue to rebalance.
The price of Crude Oil (WTI) has continued to crumple overnight as the benchmark declined around 2.03% and is now trading around the $42.53 a barrel mark. However, as much as OPEC might like to point the finger at non-cartel members undermining the current production agreement, the reality is that technological advances are the key factors at play.
The fact is the world is currently drowning in crude oil supplies and ongoing technological advances in the fracking industry are leading to significant increases in global productive capacity. Additionally, the gains in supply are coming right at a time when demand is less than robust and has remained relatively flat over the past few years. This subsequently provides the perfect environment for declining crude oil prices.
In fact, the International Energy Agency (IEA) recently released their statistics for May which showed a global gain of around 585,000 barrels a day in supply to 96.69 million B/PD. Subsequently, there had been incremental increases in the supply volume and marginal extraction cost throughout most of 2016 and 2017. Most of the gains are coming from Non-OPEC shale producers with the U.S. leading the charge in additional production. Subsequently, the current U.S. shale productive capacity (excluding Texas and North Dakota) has risen to around the 9.3 million barrel mark.
Therefore, OPEC faces plenty of competition from non-producers, at an increasingly lower marginal extraction cost, which suggests that their ability to hold back the tide via production cuts is diminishing daily. The reality is that the market is in the process of arranging a new structure, or crude oil order, around the additional supply and this can only see OPEC's power over the long term decline.
Subsequently, whilst the cartel is primarily focused upon attempting to control market prices through supply caps, the rest of the world is instead focused on productivity gains and finding easier and cheaper ways to extract the black gold. So it would seem counter-intuitive to suggest that we are likely to see any form of long term upward pressure on crude prices until a full rebalancing of the market occurs. In fact, ongoing supply cuts simply lengthen out the rebalancing process and prolong the pain which is yet to really come.
Ultimately, OPEC, as a cartel, is facing its toughest challenge yet of its long reign as the sovereign of oil markets. Subsequently, lower crude oil prices are here to stay, at least in the medium term, and we may just see WTI back below the $40.00 handle in due course until a complete rebalancing of the fungible market completes.
NZD Poised To Breakout Despite Recent Ranging Phase
Key Points:
- Resistance may be less robust than is immediately apparent.
- Underlying technicals suggest a breakout is warranted.
- The resulting rally could extend as far as the 0.7379 handle rather quickly
The Kiwi Dollar's rally has proven to be remarkably resilient over the past week, the pair largely resisting the urge slip lower despite some rather bearish technical readings. Moreover, this week has seen both a 0.8% contraction in the GDT Price Index and a dovish decision from the RBNZ regarding the OCR – two fundamental developments that would typically send the pair reeling. As a result, the question is now being raised, will the long-term trend line hold or will a breakout be seen going forward?
If we take a look at the daily chart, initially, there seems to be a fairly solid argument in favour of resistance remaining intact. For instance, the combination of that long-term trend line and some long wicks on recent candles provides a fairly potent signal that the bulls are beginning to lose their grip on the pair. Furthermore, we have seen the Parabolic SAR invert which now suggests that a near-term downtrend could be warranted moving forward.
Nevertheless, upon closer inspection, this forecast may not be as clear cut as it at first appears and there is evidence to suggest that we might, instead, see an upside breakout relatively shortly. The obvious technical reading in dissent is the EMA bias. As shown above, all three averages are in their most bullish configuration and hinting that buying pressure may yet be seen. What's more, this bias is reinforced by the current ADX readings which are sitting at around the 45.0 level – a sign that a very strong trend is in play.
It is also worth noting that the recent ranging phase has pushed stochastic readings out of overbought territory. The removal of yet another cap on upside potential will surely not have gone unnoticed by the markets and many bulls will now be waiting for the right moment to make a move.
However, we may have to wait another week or so before any major push higher is seen as the trend line and the 0.72 support likely need to converge to a greater degree.
Ultimately, keep an eye on the Kiwi Dollar as it may have a surprise in store for us yet and this might see it all the way back up to around the 0.7379 mark. Technically, the pair certainly has some strong evidence signalling that this is not only possible but actually rather likely. From a more fundamental perspective, next week's NZ trade data could prove to be what is needed to get a breakout started so don't neglect the news feed and risk missing out on any resulting upswings.
Elliott Wave View: DAX Pullback Completed
Short term DAX Elliott Wave view suggests the rally from 5/18 is unfolding as a double three Elliott Wave structure. Minute wave ((w)) ended at 12879.5 and Minute wave ((x)) pullback ended at 12617. Internal of Minute wave ((x)) subdivided as an expanded flat Elliott Wave structure where Minutte wave (a) ended at 12633.5, Minutte wave (b) ended at 12922.5 and Minutte wave (c) of ((x)) ended at 12617. DAX has broken above Minutte wave (b) on 6/14, adding conviction that the next leg higher has started. Up from 12617, the rally is unfolding as a zigzag Elliott Wave structure where Minutte wave (a) ended at 12948.5 and Minutte wave (b) is proposed complete at 12701.5. Near term, while pullbacks stay above 12701.5, and more importantly above 12617, expect Index to extend higher. We do not like selling the Index.
DAX 1 Hour Elliott Wave Chart
Market Morning Briefing: Gold Moved Marginally Higher Yesterday
STOCKS
Low Crude prices have pulled down energy sector stocks while the tech stocks seem to be rallying.
Dow (21410.03, -0.27%) has come off in line with our expectation and while the important resistance near 21500 holds, the index could be headed towards 21300 soon. 21500 is likely to remain as a medium term top for now.
Dax (12774.26, -0.32%) came off to test immediate support near 12700 as expected but bounced back sharply to close at higher levels. While 12700 holds, we may expect a rise towards 12900 again in the coming sessions. A break below 12700 is necessary to ignore immediate rise from current levels.
Shanghai (3169.41, +0.42%) tested 3172, our upside target mentioned yesterday. Shanghai looks positive for the medium term and could move up eventually towards 3200 by the end of next week possibly. An interim dip towards 3155 is possible in the near term.
Nikkei (20118.25, -0.10%) is in a corrective phase after the sharp rally from 19970 to 20090 on Monday. The current fall could extend towards 19990 before again trying to move up towards 20300 levels.
Nifty (9633.60, -0.21%) could possibly move up today but may remain within 9600-97000 region for some more sessions. Overall near to medium term looks bullish.
COMMODITIES
Gold (1254) moved marginally higher yesterday and hovering around its key support of 1242-45. If 1245 holds, a quick bounce towards 1262 and 1295 can’t be ruled out. Otherwise it remains in a slow corrective move which may take it to the support of 1242 and 1232 respectively. We will remain bullish on gold while it is trading above 1230 levels. Silver (16.59) is also trading above its support of 16.50 and could be ranged within 16.50-16.90 regions.
Copper (2.59) is trading within the narrow range of 2.56-2.67. Only above 2.67, higher resistances of 2.84 can come into consideration. We will remain bullish on copper while it is trading above 2.55 regions.
Oil prices had failed to close higher irrespective of weekly U.S crude and gasoline stockpiles fell. Investors are now looking for more signs of production cut by OPEC and other producers to stop the free fall. Brent (44.91) and WTI (42.65) are going to test their respective supports of 43.20 and 40.80 respectively. Both Brent and WTI are highly oversold in near term time frame and we will be assured of strength of Brent and WTI only when a firm and sustainable closing above 46.30 and 44.50 are made by both of them.
FOREX
Dollar Index (97.49) is in a minor corrective mode which may end by 97.45-35 and the next leg up can push it to 98.10-40.
Euro (1.1168) remains stuck in the broader range of 1.1100-1.1300 but the immediate upside may be limited to 1.1200 levels with the major support unchanged at 1.1100-1.1090.
Dollar-Yen (111.08) correction continues but the minor decline is not expected to go beyond the support of 110.60-50 from where the larger uptrend may resume for the higher targets of 112-113.
Pound (1.2665) has already enjoyed a corrective bounce from 1.2600 to 1.2700 exactly in line with our expectations but for a reversal, a break above 1.2820 is required. For the next few sessions, the currency may trade sideways in the range of 1.2540-1.2820.
Contrary to expectations, Aussie (0.7550) has weakened below the support of 0.7570-60 which implies a loss of upside momentum. The correction may take it to the major support of 0.7490 before a short covering bounce emerges.
Dollar-Rupee (64.52) opened strong but lost almost all the gains made by the closing. The resistance of 64.70-75 has held well so far and keeps the pair in the broader range of 64.10-70 as expected.
INTEREST RATES
The US 10-5Yr (0.39%) has broken below immediate support at 0.40% but could bounce back from 0.38%, the earlier low seen in Aug’16. The US yields by themselves are trading lower and the medium term charts are working well just now. We could see a pause in the falling yields possibly in the early-next week. The 5Yr , 10YR and 30YR are trading lower by 1bps at 1.76%, 2.16% and 2.71% respectively.
The US-Japan 10Yr (2.09%) spread is looking bearish for the medium term and could move lower towards 2% in the coming sessions.
The German-US 10YR (-1.88%) could re-test levels of -1.85% on the upside before again coming off towards -1.95% in the near term. For now the yield spread is likely to consolidate sideways within the -1.85% and -1.95% region.
(RBNZ) Official Cash Rate Unchanged at 1.75 Percent
The Reserve Bank today left the Official Cash Rate (OCR) unchanged at 1.75 percent.
Global economic growth has increased and become more broad-based. However, major challenges remain with on-going surplus capacity and extensive political uncertainty.
Headline inflation has increased over the past year in several countries, but moderated recently with the fall in energy prices. Core inflation and long-term bond yields remain low. Monetary policy is expected to remain stimulatory in the advanced economies, but less so going forward.
The trade-weighted exchange rate has increased by around 3 percent since May, partly in response to higher export prices. A lower New Zealand dollar would help rebalance the growth outlook towards the tradables sector.
GDP growth in the March quarter was lower than expected, with weaker export volumes and residential construction partially offset by stronger consumption. Nevertheless, the growth outlook remains positive, supported by accommodative monetary policy, strong population growth, and high terms of trade. Recent changes announced in Budget 2017 should support the outlook for growth.
House price inflation has moderated further, especially in Auckland. The slowdown in house price inflation partly reflects loan-to-value ratio restrictions, and tighter lending conditions. This moderation is projected to continue, although there is a risk of resurgence given the on-going imbalance between supply and demand.
The increase in headline inflation in the March quarter was mainly due to higher tradables inflation, particularly petrol and food prices. These effects are temporary and may lead to some variability in headline inflation. Non-tradables and wage inflation remain moderate but are expected to increase gradually. This will bring future headline inflation to the midpoint of the target band over the medium term. Longer-term inflation expectations remain well-anchored at around 2 percent.
Monetary policy will remain accommodative for a considerable period. Numerous uncertainties remain and policy may need to adjust accordingly.
RBNZ On Hold And NZD/USD Still Capped By Trend Line Resistance
The Reserve Bank of New Zealand surprised no one this morning by leaving the official cash rate on hold at 1.75%.
While there is no Monetary Policy Statement for release with today's decision (or press conference from Governor Wheeler for that matter), the RBNZ did say that monetary policy would remain 'accommodative' for 'a considerable period'.
Markets have digested this as being a clear neutral stance on rates from Wheeler as the expectation continues to be that they will not be raising rates into 2018.
Forex traders pushed the kiwi slightly higher in the wake of the interest rate decision as the Kiwi rose from US 72.31 cents to US 72.51 cents and also gained about 0.20 cents against the Euro within minutes of the statement.
But while price rocketed up to NZD/USD trend line resistance, half of those gains were given back once technical resistance was touched. Not much has changed fundamentally and this is reflected in the Kiwi daily chart below:
NZD/USD Daily:
This level is still key heading forward and any intraday shorts will depend on it holding. Remember, if you're trading NZD/USD then screenshot your chart and be sure to mention @VantageFX on Twitter to contribute to the discussion.