

Sample Category Title
Loonie Trading A Tad Higher In The Asian Session
For the 24 hours to 23:00 GMT, the USD rose 0.4% against the CAD and closed at 1.3332.
In the Asian session, at GMT0300, the pair is trading at 1.3325, with the USD trading marginally lower against the CAD from yesterday's close.
The pair is expected to find support at 1.3280, and a fall through could take it to the next support level of 1.3235. The pair is expected to find its first resistance at 1.3359, and a rise through could take it to the next resistance level of 1.3393.
Going ahead, Canada's retail sales data for April, scheduled to release later in the day, will keep investors on their toes.
The currency pair is showing convergence with its 20 Hr moving average and trading above its 50 Hr moving average.

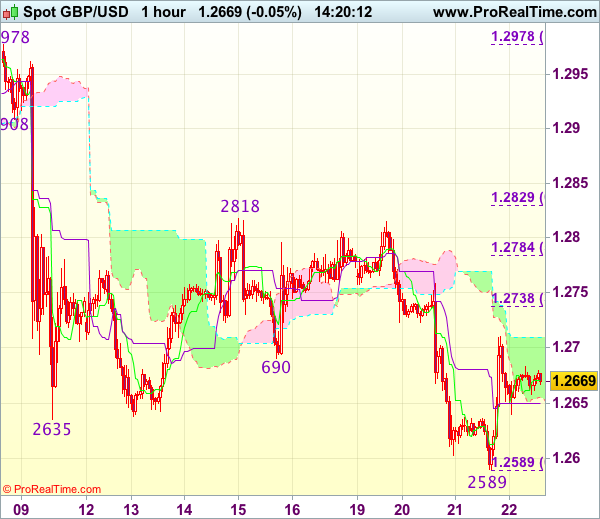
Trade Idea : GBP/USD – Hold short entered at 1.2695
GBP/USD - 1.2669
Most recent candlesticks pattern : N/A
Trend : Near term down
Tenkan-Sen level : 1.2671
Kijun-Sen level : 1.2650
Ichimoku cloud top : 1.2709
Ichimoku cloud bottom : 1.2655
Original strategy :
Sold at 1.2695, Target: 1.2595, Stop: 1.2710
Position : - Short at 1.2695
Target : - 1.2595
Stop : - 1.2710
New strategy :
Hold short entered at 1.2695, Target: 1.2595, Stop: 1.2710
Position : - Short at 1.2695
Target : - 1.2595
Stop : - 1.2710
Although cable staged a strong rebound after yesterday’s brief fall to 1.2589, as long as 1.2710 holds, mild downside bias remains for another decline, below 1.2635-40 would bring another fall towards said support but break there is needed to retain bearishness and signal recent decline has resumed for weakness towards 1.2550, however, oversold condition should limit downside to 1.2520-25.
In view of this, we are holding on to our short position entered at 1.2695. Only above 1.2720-25 would abort and suggest low has been formed instead, bring a stronger rebound to 1.2755-60 and possibly 1.2780 but price should falter below indicated strong resistance at 1.2818.
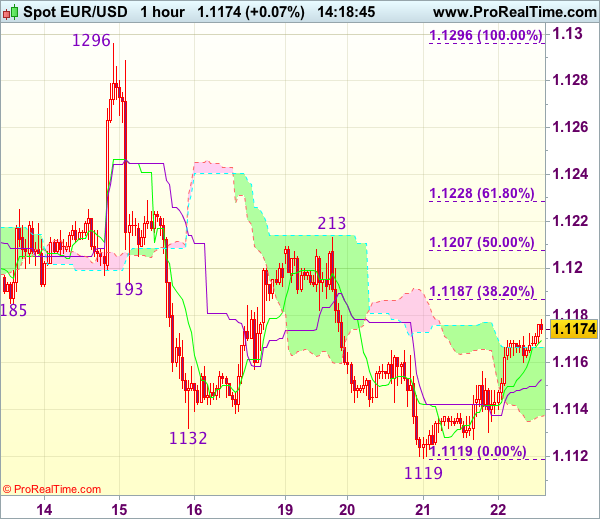
Trade Idea : EUR/USD – Sell at 1.1190
EUR/USD - 1.1173
Most recent candlesticks pattern : N/A
Trend : Near term down
Tenkan-Sen level : 1.1169
Kijun-Sen level : 1.1153
Ichimoku cloud top : 1.1166
Ichimoku cloud bottom : 1.1137
Original strategy :
Sell at 1.1185, Target: 1.1085, Stop: 1.1220
Position : -
Target : -
Stop : -
New strategy :
Sell at 1.1190, Target: 1.1090, Stop: 1.1225
Position : -
Target : -
Stop : -
The single currency has rebounded again after holding above this week’s low at 1.1119, suggesting further consolidation would be seen and near term upside risk remains for retracement to 1.1185-90 (38.2% Fibonacci retracement of 1.1296-1.1119), however, upside should be limited and price should falter below 1.1207-13 (50% Fibonacci retracement and previous resistance), bring another decline later, below 1.1135-40 would suggest the rebound from 1.1119 has ended, brig retest of this level, below there would confirm recent decline has resumed for further weakness to previous support at 1.1109, then towards 1.1075-80 but loss of near term downward momentum should prevent sharp fall below 1.1050.
In view of this, we are looking to sell euro on recovery as 1.1185-90 should limit upside. Only above 1.1213 resistance would defer and risk a stronger rebound to 1.1230-35 but upside should be limited to 1.1260-70, bring another decline later.
Trade Idea : USD/JPY – Buy at 110.65
USD/JPY - 111.05
Most recent candlesticks pattern : N/A
Trend : Near term up
Tenkan-Sen level : 111.20
Kijun-Sen level : 111.35
Ichimoku cloud top : 111.42
Ichimoku cloud bottom : 111.35
Original strategy :
Buy at 110.65, Target: 111.65, Stop: 110.30
Position : -
Target : -
Stop : -
New strategy :
Buy at 110.65, Target: 111.65, Stop: 110.30
Position : -
Target : -
Stop : -
As the greenback has slipped again after faltering below recent high at 111.79, retaining our view that further consolidation below this level would be seen and pullback to 111.80 is likely, however, reckon previous support at 110.65 would limit downside and bring another rise later, above 111.45-50 would bring retest of 111.79 but break there is needed to confirm the rise from 108.82 low has resumed and extend headway to 111.90-95 (50% projection of 108.82-111.42-110.65), however, upside should be limited to resistance at 112.13 and 112.25 (61.8% Fibonacci retracement of 114.37-108.82 and 61.8% projection) should hold.
In view of this, would not chase this rise here and we are looking to buy dollar on pullback as 110.65 support should limit downside. Below 110.30-35 (50% Fibonacci retracement of 108.82-111.79 and previous resistance turned support) would abort and signal a temporary top has been formed instead, risk weakness towards 109.95-00 (61.8% Fibonacci retracement).

EUR/USD Daily Outlook
Daily Pivots: (S1) 1.1141; (P) 1.1154 (R1) 1.1182; More....
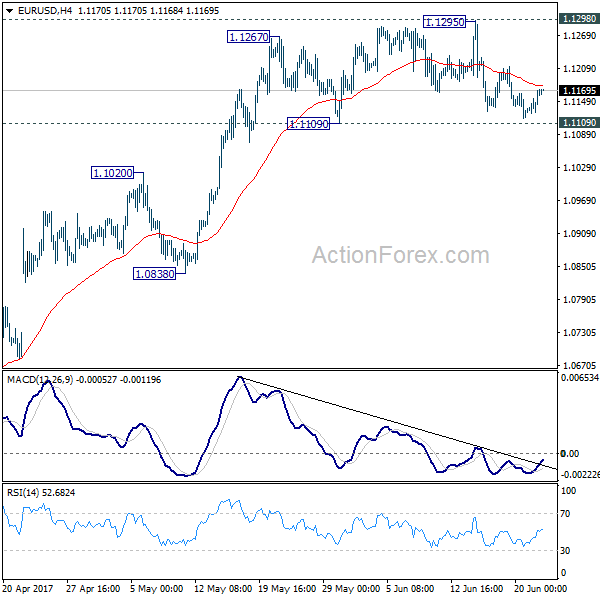
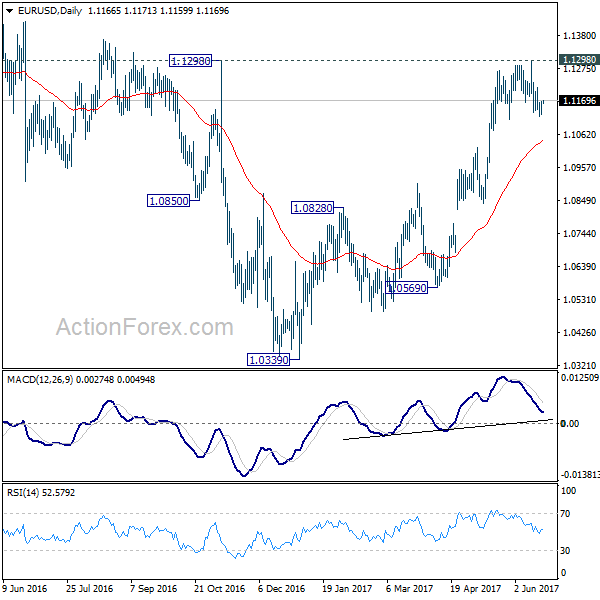
Intraday bias in EUR/USD remains neutral as it's still bounded in range of 1.1109/1295. On the upside, decisive break of 1.1298 key resistance will carry larger bullish implication and target 1.1615 resistance next. On the downside, break of 1.1109 support will indicate short term topping and rejection from 1.1298. In such case, intraday bias will be turned to the downside for 1.0838 support.
In the bigger picture, the case for medium term reversal continues to build up with EUR/USD staying far above 55 week EMA (now at 1.0932). Also, bullish convergence condition is seen in weekly MACD. Focus will now be on 1.1298 key resistance. Rejection from there will maintain medium term bearishness and would extend the whole down trend from 1.6039 (2008 high). However, firm break of 1.1298 will indicate reversal. In such case, further rally would be seen back to 1.2042 support turned resistance next.
GBP/USD Daily Outlook
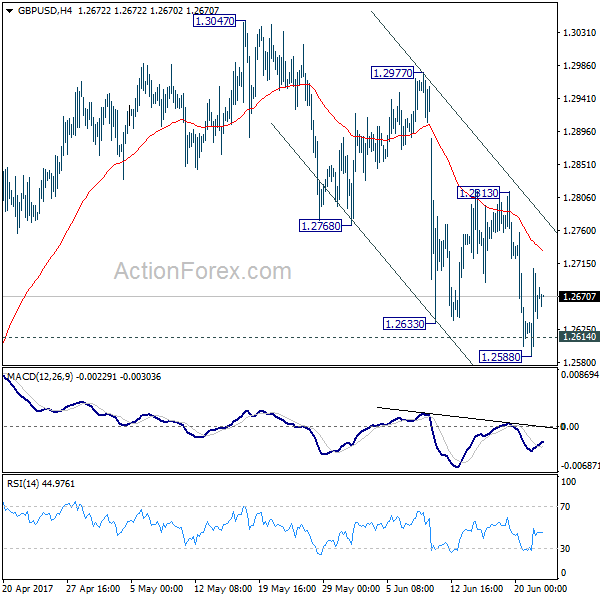
Daily Pivots: (S1) 1.2603; (P) 1.2656; (R1) 1.2723; More...
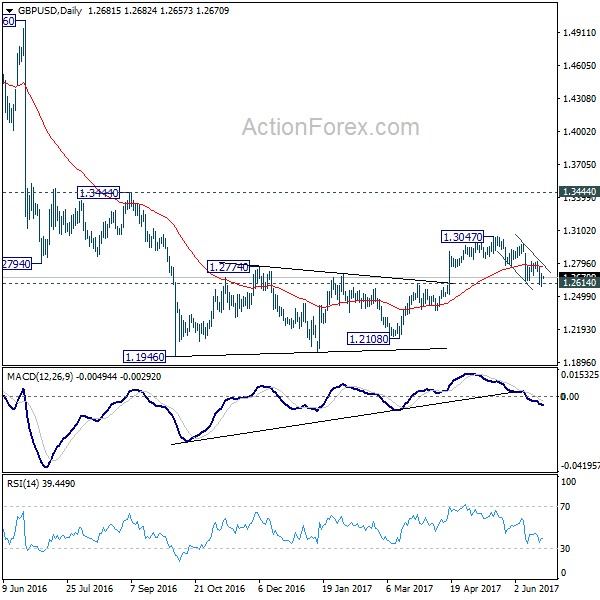
Intraday bias in GBP/USD remains neutral and outlook stays bearish with 1.2813 resistance intact. At this point, we're still favoring the bearish case that consolidation pattern from 1.1946 has completed at 1.3047 already. Sustained break of 1.2614 resistance turned support should confirm our bearish view and target a test on 1.1946 low next. However, break of 1.2813 resistance will dampen our view and turn bias back to the upside for 1.3047 and above.
In the bigger picture, fall from 1.7190 is seen as part of the down trend from 2.1161. Price actions from 1.1946 medium term low are seen as a consolidation pattern, which could have completed after hitting 55 week EMA. Break of 1.1946 low will target 61.8% projection of 1.5016 to 1.1946 from 1.3047 at 1.1150 next. In case the consolidation from 1.1946 extends, outlook will stay remain bearish as long as 1.3444 resistance holds.
USD/JPY Daily Outlook
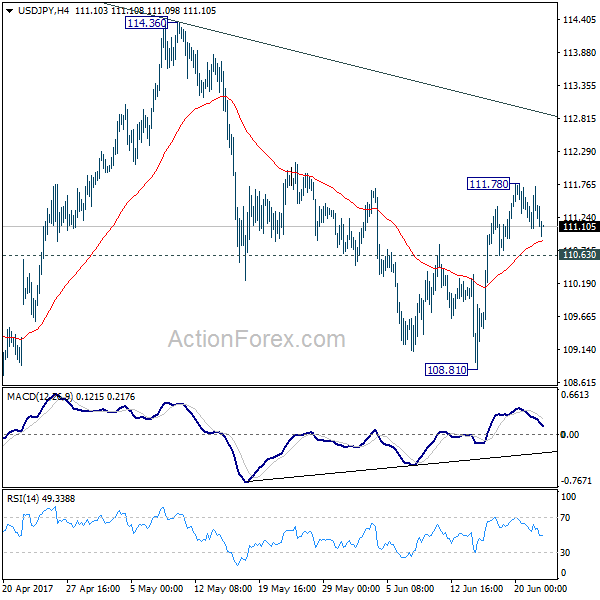
Daily Pivots: (S1) 111.03; (P) 111.39; (R1) 111.71; More...
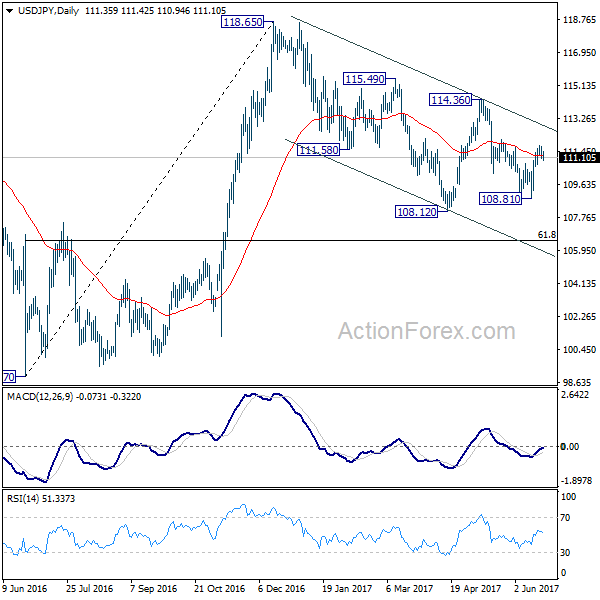
Intraday bias in USD/JPY stays neutral for consolidation below 111.78 temporary top. With 110.63 minor support intact, further rise is still expected. Break of 111.78 will target near term channel resistance (now at 113.02). Sustained break there will suggest that whole pull back from 118.65 has completed at 108.12 already. In such case, further rise should be seen to 114.36 resistance for confirmation. However, break of 110.63 will turn bias back to the downside for 108.81 instead.
In the bigger picture, price actions from 125.85 high are seen as a corrective pattern. It's uncertain whether it's completed yet. But in case of another fall, downside should be contained by 61.8% retracement of 75.56 to 125.85 at 94.77 to bring rebound. Overall, rise from 75.56 is still expected to resume later after the correction from 125.85 completes.
European Open Briefing: The RBNZ Kept Rates Unchanged As Expected
Global Markets:
- Asian stock markets: Nikkei up 0.10 %, Shanghai Composite gained 0.75 %, Hang Seng rose 0.50 %, ASX 200 rallied 0.80 %
- Commodities: Gold at $1254 (+0.65 %), Silver at $16.58 (+1.25 %), WTI Oil at $42.50 (-0.05 %), Brent Oil at $44.80 (-0.10 %)
- Rates: US 10-year yield at 2.16, UK 10-year yield at 1.04, German 10-year yield at 0.26
News & Data
- RBNZ Keeps Official Cash Rate Unchanged at 1.75%, As Expected
- RBNZ: Monetary Policy Remain Accommodative for Considerable Period
- RBNZ: Longer-Term Inflation Expectations Remain Well-Anchored at Around 2%
- RBNZ: Expects Future Headline Inflation to Reach the Midpoint of The Target Band Over the Medium Term
- RBNZ: Inflation Rise Mainly Due to Temporary Factors, May Lead to Some Variability in Headline Inflation
- RBNZ: House Price Inflation Has Moderated Further, Moderation Projected to Continue
- RBNZ: Risk of Resurgence in House Price Inflation Given the Ongoing Imbalance Between Supply and Demand
- PBoC Fixes USDCNY Reference Rate At 6.8197 (prev fix 6.8193 prev close 6.8299)
- Asian stocks rise as oil tries to claw up from 10-month low – RTRS
- Dollar index steady below one-month high; Kiwi firms after RBNZ – RTRS
Markets Update:
The RBNZ kept rates unchanged as expected, and maintained an optimistic outlook for the NZ economy. NZD/USD rallied from 0.7210 to 0.7270 immediately after the statement was released. The pair retraced some of the gains later in the session, but remains well bid. A test of 0.7320 resistance seems likely in the near-term.
AUD/NZD selling brought the Australian Dollar under pressure. AUD/USD fell from 0.7560 to 0.7540. Support at 0.7520 is now key. A break below that support level could signal that AUD/USD will extend losses to 0.74 in the short-term.
USD/JPY fell in Asia, despite the recovery in stock markets. Support is seen at 110.80 and 110.20/25, while strong resistance lies ahead of 112. Overall, the outlook is still positive and there is solid buying interest ahead of 110.
The Euro remains resilient and managed once again to bounce ahead of 1.11. In Asia, EUR/USD recovered to 1.1170. Should it manage to clear 1.12 resistance, a retest of 1.13 is likely.
Upcoming Events:
- 13:30 BST – US Initial Jobless Claims
- 13:30 BST – Canadian Retail Sales
- 14:00 BST – US House Price Index
- 15:00 BST – Euro Zone Consumer Confidence
USD/CHF Daily Outlook
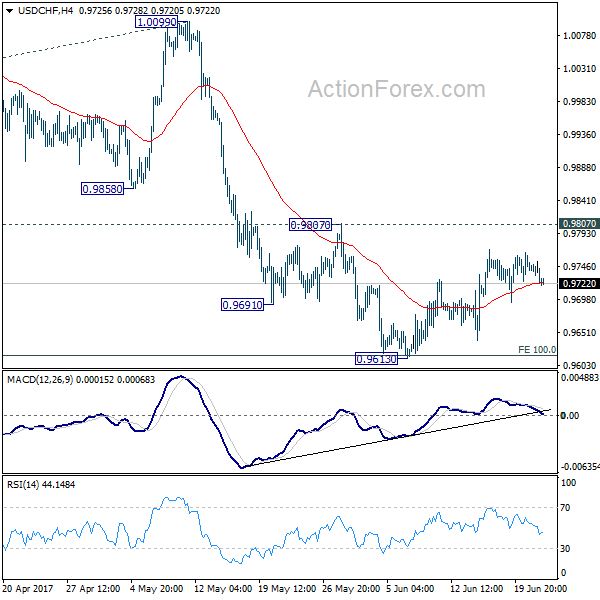
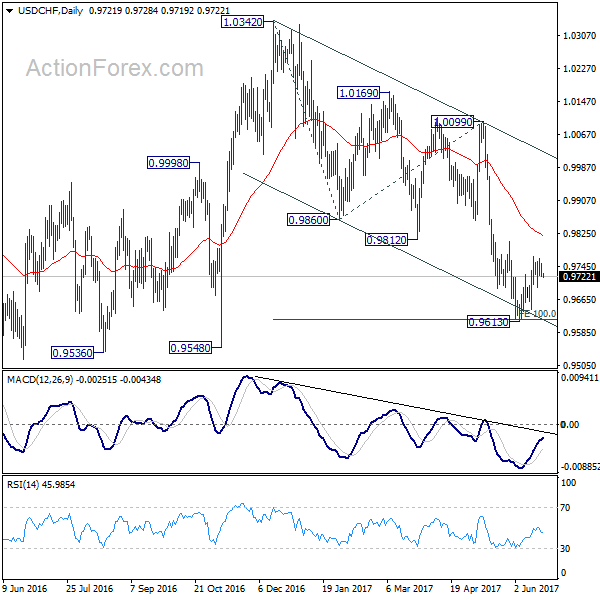
Daily Pivots: (S1) 0.9712; (P) 0.9732; (R1) 0.9743; More.....
USD/CHF is still staying in consolidation from 0.9613 and intraday bias remains neutral. With 0.9087 resistance intact, near term outlook stays bearish. Break of 0.9613 will extend the whole decline from 1.0342 to 0.9548 support and below. We'd start to look for bottoming signal again as it approaches 0.9443 key support level. However, considering bullish convergence condition in 4 hour MACD, break of 0.9807 will indicate near term reversal and turn outlook bullish for 1.0099 resistance next.
In the bigger picture, USD/CHF is still bounded in medium term range of 0.9443/1.0342 for the moment. Consolidative trading would likely continue and medium term outlook remains neutral. Break of 1.0342 key resistance is needed to confirm underlying bullish momentum in the pair. Meanwhile, downside attempts should be contained by 0.9443 key support level. However, sustained break of 0.9443 will carry larger bearish implication and target 0.9 handle.
Daily Technical Outlook And Review: EUR/USD, GBP/USD, AUD/USD, USD/JPY, USD/CAD, USD/CHF, DOW 30, GOLD
A note on lower timeframe confirming price action...
Waiting for lower timeframe confirmation is our main tool to confirm strength within higher timeframe zones, and has really been the key to our trading success. It takes a little time to understand the subtle nuances, however, as each trade is never the same, but once you master the rhythm so to speak, you will be saved from countless unnecessary losing trades. The following is a list of what we look for:
- A break/retest of supply or demand dependent on which way you're trading.
- A trendline break/retest.
- Buying/selling tails ... essentially we look for a cluster of very obvious spikes off of lower timeframe support and resistance levels within the higher timeframe zone.
- Candlestick patterns. We tend to only stick with pin bars and engulfing bars as these have proven to be the most effective.
We typically search for lower-timeframe confirmation between the M15 and H1 timeframes, since most of our higher-timeframe areas begin with the H4. Stops are usually placed 1-3 pips beyond confirming structures.
EUR/USD
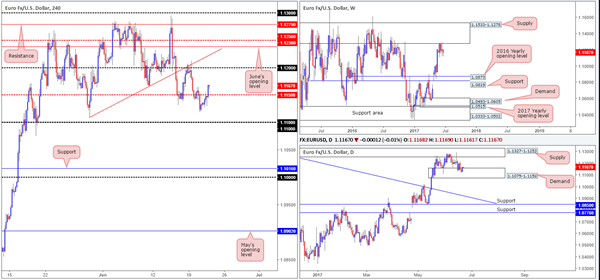
Using a top-down approach this morning, the weekly sellers continue to reflect a strong bearish stance from the underside of a major weekly supply at 1.1533-1.1278. The story on the daily chart, however, shows price has been consolidating between supply at 1.1327-1.1253 and demand drawn from 1.1075-1.1158 since May 22nd. Ideally, bearish strength will not be confirmed until the said demand is taken out. The next downside target in view is the trendline support etched from the high 1.1616, followed closely by support at 1.0850.
Over on the H4 candles, the mid-level number 1.1150 failed to offer much in the way of resistance during yesterday’s trading. This saw price run above Tuesday’s high 1.1164 and end the day forming a near-full-bodied bullish candle. By and of itself, this could encourage further buying up to the 1.12 handle today, which was a level that held beautifully on Monday.
Our suggestions: Technically speaking, 1.12 will likely be next in the firing range today. Before that though, we may see the H4 candles retest 1.1150 as support. Apart from 1.1150 being housed within the aforementioned daily demand, there’s little confluence bolstering this number for a buy trade today. With that, our team’s position will remain flat going into today’s sessions.
Data points to consider: US weekly unemployment claims at 1.30pm, FOMC member Powell speaks at 3pm GMT+1.
Levels to watch/live orders:
- Buys: Flat (stop loss: N/A).
- Sells: Flat (stop loss: N/A).
GBP/USD
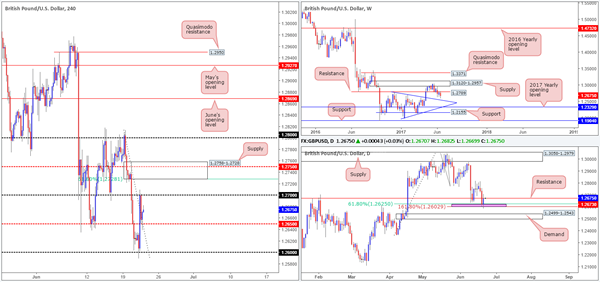
As London buyers entered the fray yesterday, cable rocketed north from the 1.26 handle. The move was exacerbated by comments made by MPC member Haldane, which saw the H4 mid-level resistance at 1.2650 consumed and the 1.27 hurdle challenged. Aside from the fundamental driver here, this recent advance was also likely helped by the daily 161.8% ext. seen at 1.2602 drawn from the high 1.3047, and the 61.8% daily Fib support at 1.2625 taken from the low 1.2365 (small pink zone).
The unit finds itself at a rather critical crossroads at the moment. 1.27, as you can see also held firm, which should not really come as a surprise considering that it is positioned nearby a daily resistance pegged at 1.2673. Also worth mentioning is that weekly price shows room to extend down to a trendline support taken from the high 1.2774 that happens to intersect with daily demand seen below the two above said daily Fib levels at 1.2499-1.2543.
Our suggestions: While a great deal of traders will be eyeing the 1.27 handle for shorts today, we’re looking at the H4 supply seen above at 1.2758-1.2728. Not only does it hold a H4 mid-level resistance level at 1.2750, it also boasts a 61.8% H4 Fib resistance at 1.2728 taken from the high 1.2814. Furthermore, the stops planted above 1.27 will help provide the big boys liquidity to sell into! An ideal setup would be for a H4 selling wick to pierce through 1.27 (taking out the stops), attack the underside of the said H4 supply and then close back below 1.27. This would permit a short entry, targeting 1.2650 as an initial take-profit level.
Data points to consider: MPC member Forbes speaks at 7pm. US weekly unemployment claims at 1.30pm, FOMC member Powell speaks at 3pm GMT+1.
Levels to watch/live orders:
- Buys: Flat (stop loss: N/A).
- Sells: 1.2758-1.2728 ([waiting for a reasonably sized H4 bear candle – preferably a full-bodied candle – to form before pulling the trigger is advised] stop loss: ideally beyond the candle’s wick).
AUD/USD
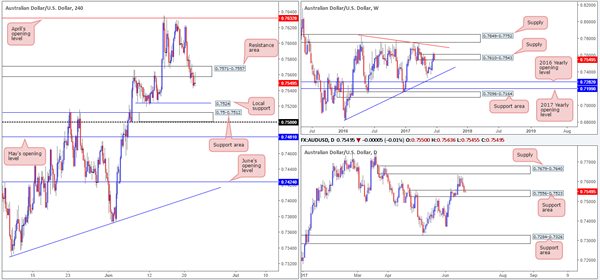
The Australian dollar declined in value for a third consecutive day yesterday. The H4 support area at 0.7571-0.7557 was taken out and is, as we write, being retested as resistance. Beyond here, the next area in the spotlight is a local H4 support pegged at 0.7524, followed closely by a H4 support area at 0.75-0.7512.
On the weekly timeframe, we can see that the unit marginally closed above supply at 0.7610-0.7543 last week. From our perspective right now, last week’s close higher looks as though it was little more than a fakeout. While the weekly and H4 chart are pointing toward possible selling, let’s not forget the daily picture! Price is currently trading within the walls of a support area formed by 0.7556-0.7523, which could very well hold the candles higher.
Our suggestions: Although we would like nothing more than to short this beast, we are not comfortable with the current daily support area! In addition to this, there’s not a great deal of room for the H4 candles to trade lower, given the next hurdle below sits only 30 or so pips away. As such, remaining flat until more conducive price action presents itself is the route we’ve chosen to take.
Data points to consider: US weekly unemployment claims at 1.30pm, FOMC member Powell speaks at 3pm GMT+1
Levels to watch/live orders:
- Buys: Flat (stop loss: N/A).
- Sells: Flat (stop loss: N/A).
USD/JPY
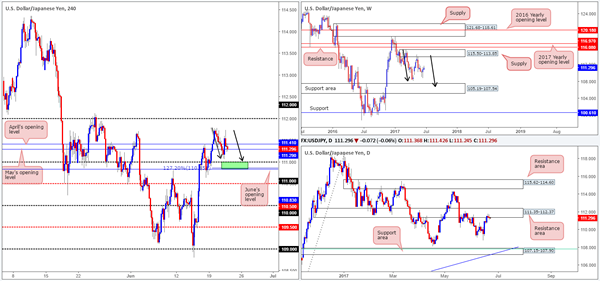
The USD/JPY is effectively unchanged this morning, consequently forming a clear-cut daily indecision candle around the underside of a daily resistance area at 111.35-112.37. On the weekly timeframe, we still feel that weekly bears remain in a relatively strong position after pushing aggressively lower from supply registered at 115.50-113.85. We know there’s a lot of ground to cover here, but this move could possibly result in further downside taking shape in the form of a weekly AB=CD correction (see black arrows) that terminates within a weekly support area marked at 105.19-107.54 (stretches all the way back to early 2014).
Despite H4 price recently seesawing around May/April’s opening levels at 111.29/111.41, the pair appears to be forming a rather attractive H4 AB=CD bullish formation (see black arrows) that completes around the 111 handle. Between June’s opening level at 110.83 and the 111 level (green zone), this is an area we expect at least a bounce to be seen. How much of a bounce is difficult to judge, nevertheless, given what we’ve noted on the bigger picture.
Our suggestions: We just cannot justify a buy from 110.83/111 knowing that we are coming from a daily resistance area! With that, we have decided to remain flat for the time being.
Data points to consider: US weekly unemployment claims at 1.30pm, FOMC member Powell speaks at 3pm GMT+1.
Levels to watch/live orders:
- Buys: Flat (stop loss: N/A).
- Sells: Flat (stop loss: N/A).
USD/CAD
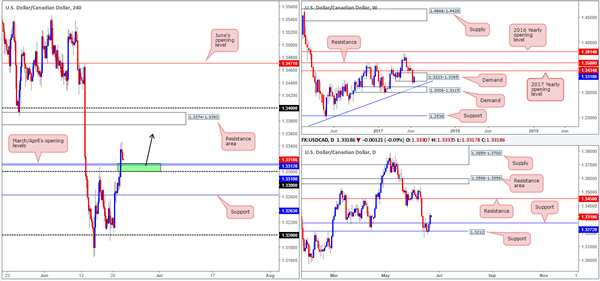
The USD/CAD, as you can see, extended higher and took out the 1.33 handle and nearby March/April’s opening levels at 1.3312/1.3310 during recent trade. Consequent to this, the daily resistance level at 1.3272 was also engulfed and should, technically speaking, now act as support. Also worth mentioning is that weekly action is seen trading from within the walls of demand formed at 1.3223-1.3395.
Our suggestions: With H4 price showing room for the unit to rally up to a resistance area coming in at 1.3374-1.3393, and the higher-timeframe picture indicating further buying is likely on the cards, we are very interested in buying from 1.33/1.3312 today (green zone). Due to the area being rather small, we would advise waiting for a H4 bull candle to form before pulling the trigger. This will help avoid any possible fakeouts that may take shape.
Data points to consider: US weekly unemployment claims at 1.30pm, FOMC member Powell speaks at 3pm. Canadian retail sales at 1.30pm GMT+1.
Levels to watch/live orders:
- Buys: 1.33/1.3312 ([waiting for a reasonably sized H4 bull candle – preferably a full-bodied candle – to form before pulling the trigger is advised] stop loss: ideally beyond the candle’s tail).
- Sells: Flat (Stop loss: N/A).
USD/CHF
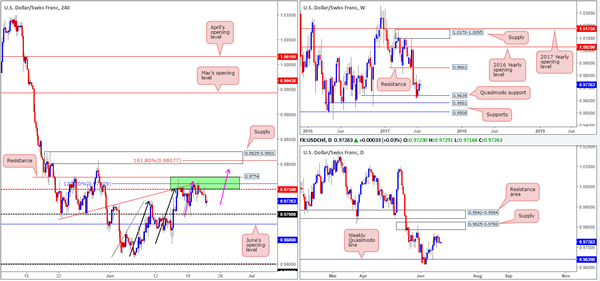
The green H4 area at 0.9774/0.9750 managed to remain steady amid Wednesday’s segment. This zone is comprised of a H4 resistance level at 0.9774, a H4 AB=CD 127.2% ext. at 0.9760 taken from the low 0.9613, a H4 trendline resistance etched from the low 0.9691 and a H4 mid-level resistance drawn from 0.9750.
Currently, the pair looks poised to challenge the 0.97 handle, which happens to be shadowed closely by June’s opening level at 0.9680. However, should H4 price stabilize at current price and rally today, this could form a H4 AB=CD pattern that could imply a break through the H4 green zone into H4 supply at 0.9825-0.9801. Apart from converging with a H4 AB=CD 161.8% ext. at 0.9807 taken from the low 0.9695 and the round number 0.98, this supply area is also positioned around the upper edge of daily supply marked at 0.9825-0.9786.
Our suggestions: Should price strike the H4 supply area mentioned above at 0.9825-0.9801 today/this week, we would, dependent on the time of day, look to sell from here at market, with stops sited at 0.9827, targeting 0.9750 as an initial take-profit zone.
Data points to consider: US weekly unemployment claims at 1.30pm, FOMC member Powell speaks at 3pm. Gov. board member Maechler speaks at 5pm GMT+1.
Levels to watch/live orders:
- Buys: Flat (stop loss: N/A).
- Sells: 0.98 (stop loss: 0.9827).
DOW 30
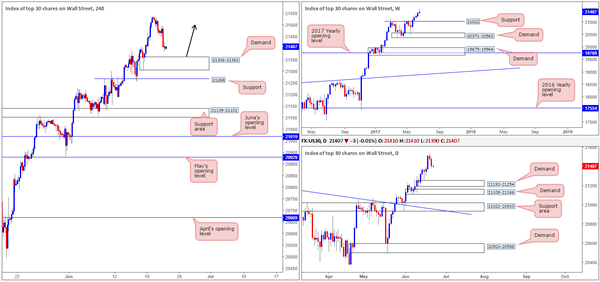
The DOW continued to correct itself yesterday, after price topped at a fresh record high of 21541 on Tuesday. Latest movement has brought the H4 candles down to within striking distance of a H4 demand base penciled in at 21306-21363.
For those who follow our analysis on a regular basis, you may recall that our desk is currently long from 21164. 50% of that position was quickly liquidated at 21234, with the remaining 50% left in the market to run since we intend on trailing this trend long term. The stop-loss order is currently positioned below the said H4 demand at 21298, as we believe this to be the safest area for the time being.
Our suggestions: Should price challenge 21306-21363 today, and is reinforced by a full or near-full-bodied bullish candle, we may look to add to our current position (as per the black arrows) and trail accordingly.
Data points to consider: US weekly unemployment claims at 1.30pm, FOMC member Powell speaks at 3pm GMT+1.
Levels to watch/live orders:
- Buys: 21164 ([live] stop loss: 21298). 21306-21363 ([waiting for a reasonably sized H4 bull candle – preferably a full-bodied candle – to form before pulling the trigger is advised] stop loss: ideally beyond the candle’s tail).
- Sells: Flat (stop loss: N/A).
GOLD
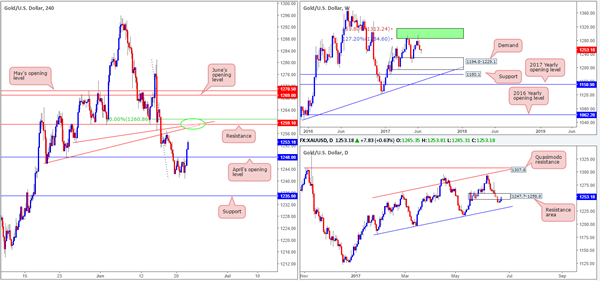
In recent hours, we’ve seen the price of gold advance to the upside. Running through offers around April’s opening level at 1248.0, the yellow metal now looks to be on course to test the H4 resistance at 1259.1. Interestingly, this level merges with two H4 trendline resistances taken from lows of 1245.9/1252.9 and a H4 50.0% retracement value at 1260.7. Also noteworthy is that this H4 resistance level is planted just above a daily resistance area pegged at 1247.7-1258.8. And alongside this, we also see that weekly price shows room to extend down to demand at 1194.8-1229.1.
Our suggestions: The confluence surrounding the H4 resistance mentioned above at 1259.1 is, we believe, enough to justify a short position. With that being said, however, we would only consider this a valid sell zone if, and only if, a reasonably sized H4 bearish candle took shape from here. This will help avoid an unnecessary loss and also help sidestep any fakeout that may be seen given that the sell zone (1260.8/1259.1) is relatively small.
Levels to watch/live orders:
- Buys: Flat (stop loss: N/A).
- Sells: 1259.1 region ([waiting for a reasonably sized H4 bear candle – preferably a full-bodied candle – to form before pulling the trigger is advised] stop loss: ideally beyond the candle’s wick).