Sample Category Title
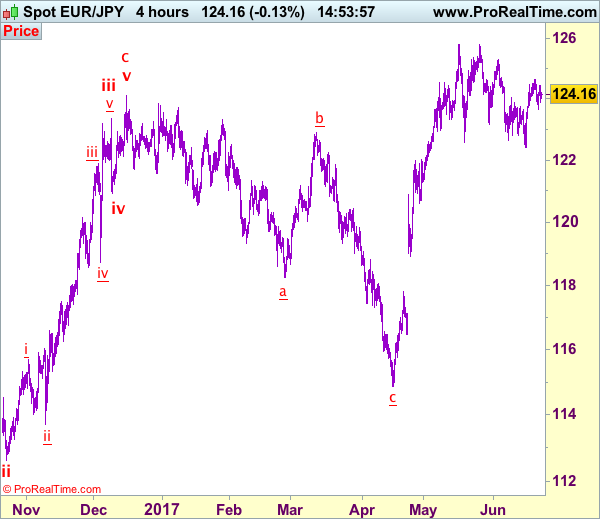
Trade Idea: EUR/JPY – Hold long entered at 123.80
EUR/JPY - 124.03
Recent wave: wave v of (C) ended at 94.12 and major correction in wave A has ended at 149.79
Trend: Near term up
Original strategy:
Bought art 123.80, Target: 125.30, Stop: 123.20
Position: - Long at 123.80
Target: - 125.30
Stop: - 123.20
New strategy :
Hold long entered at 123.80, Target: 125.30, Stop: 123.20
Position: - Long at 123.80
Target: - 125.30
Stop:- 123.20
Euro’s retreat after meeting resistance at 124.65 earlier this week suggests consolidation below this level would be seen, however, as long as 123.20-25 holds, prospect of another rise remains, above said resistance at 124.65 would signal recent upmove from 122.40 (last week’s low) is still in progress and may extend further gain to 125.00 but break of resistance at 125.31 is needed to retain upside bias and signal correction from 125.82 has ended at 122.40, bring subsequent rise towards this level which is likely to hold on first testing.
In view of this, we are holding on to our long position entered at 123.80. Below 123.20-25 would defer and suggest first leg of rebound from 122.40 has ended instead, risk further weakness to 122.90-00 but price should stay well above said support at 122.40, bring another rebound later.
Our latest preferred count is that wave (ii) is ABC-X-ABC which ended at 123.33 and wave (iii) is unfolding with wave iii ended at 100.77, followed by wave iv at 111.57 and wave v as well as the wave (iii) has ended at 97.04, followed by wave (iv) at 111.43 and wave (v) has ended at 94.12 which is also the end of the larger degree v, this also implied the major wave (C) has also ended there, hence major correction has commenced from there with (A) leg unfolding in its lower degree wave c which has possibly ended at 145.69. Under this count, A-B-C wave (B) has commenced with A leg ended at 136.23, wave B at 143.79 and wave C has possibly ended at 149.79.
Our larger degree count is that the decline from 139.26 is wave (C) and is sub-divided into a diagonal triangle i-ii-iii-iv-v with wave i - 105.44, wave ii- 123.33, wave iii - 97.03, wave iv - 111.43, followed by the final wave v as well as the end of wave (C) at 94.12, this also mark the bottom of larger degree wave B. Under this count, major rise in wave C has commenced as an impulsive wave with minor wave III ended at 145.69, wave V is still in progress for further gain to 150.00. Having said that, this so-called wave V could well be the first leg of larger degree 5-waver wave C and this wave C should bring at least a retest of wave A top at 169.97 (July 2008).
Trade Idea: AUD/USD – Hold long entered at 0.7595
AUD/USD – 0.7555
Recent wave: Wave 5 ended at 1.1081 and major correction has commenced for fall to 0.7000 and then towards 0.6500-10
Trend: Near term up
Original strategy :
Bought at 0.7595, Target: 0.7745, Stop: 0.7535
Position: - Long at 0.7595
Target: - 0.7745
Stop: - 0.7535
New strategy :
Hold long entered at 0.7595, Target: 0.7745, Stop: 0.7535
Position: - Long at 0.7595
Target: - 0.7745
Stop:- 0.7535
Yesterday’s retreat has kept aussie under near term pressure and 0.7535 needs to hold to retain prospect of another rise, above 0.7600 would bring test of indicated resistance at 0.7636, break there would confirm recent upmove has resumed and extend the rise from 0.7329 towards previous resistance at 0.7680 but loss of momentum should limit upside to chart resistance at 0.7750 and price should falter below 0.7785-90.
In view of this, we are holding on to our long position entered at 0.7595. Below 0.7535 would defer and suggest top is possibly formed, bring correction to 0.7515-20, break there would provide confirmation, then correction to 0.7490-95 and possibly towards support at 0.7457 would be seen later.
On the 4-hour chart, the move from 0.8066 is the wave 5 with i: 0.8860, ii: 0.8315, wave iii is an extended move ended at 1.0183, iv: 0.9706 and wave v has ended at 1.1081 (also the top of entire wave 5). The subsequent selloff is the major correction which is unfolding as ABC-X-ABC and 2nd A leg has ended at 0.8848, followed by a-b-c wave B which ended at 0.9758, hence, 2nd C wave is now in progress and indicated downside target at 0.7000 and 0.6950 had been met, so further fall to 0.6710-20 cannot be ruled out.

Aussie Trading Marginally Lower In The Morning Session
For the 24 hours to 23:00 GMT, the AUD declined 0.32% against the USD and closed at 0.7549.
LME Copper prices declined 0.4% or $23.5/MT to $5650.0/MT. Aluminium prices declined 1.2% or $23.5/MT to $1865.5/MT.
In the Asian session, at GMT0300, the pair is trading at 0.7548, with the AUD trading a tad lower against the USD from yesterday's close.
The pair is expected to find support at 0.7534, and a fall through could take it to the next support level of 0.7520. The pair is expected to find its first resistance at 0.7569, and a rise through could take it to the next resistance level of 0.7590.
The currency pair is trading below its 20 Hr and 50 Hr moving averages.

EUR/GBP Candlesticks and Ichimoku Analysis
Weekly
• Last Candlesticks pattern: N/A
• Time of formation: N/A
• Trend bias: Near term up
Daily
• Last Candlesticks pattern: Hammer
• Time of formation: 3 Feb 2016
• Trend bias: Up
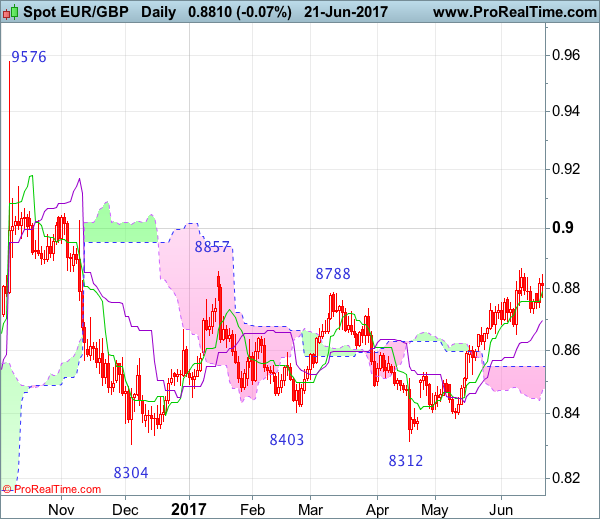
EURGBP – 0.8677
Although the single currency found support at 0.8719 and has rebounded, break of recent high at 0.8866 is needed to confirm our bullish view that recent rise from 0.8304 low is still in progress and upside bias remains for this move to extend further gain to 0.8900, however, near term overbought condition should prevent sharp move beyond 0.8940-50 (50% Fibonacci retracement of 0.9576-0.8304) and reckon psychological resistance at 0.9000 would hold from here, price should falter well below 0.9090 (61.8% Fibonacci retracement), bring retreat later.
On the downside, if said resistance at 0.8866 continues to hold, then further consolidation would be seen and another retreat to 0.8719 cannot be ruled out, however, reckon downside would be limited to 0.8680-85 and bring another rise later. A daily close below support at 0.8652 would abort and suggest a temporary top is formed instead, bring retracement of recent upmove to 0.8590-95, then 0.8550 but reckon previous support at 0.8524 would hold from here, bring rebound later.
Recommendation: Buy again at 0.8680 for 0.8880 with stop below 0.8580.
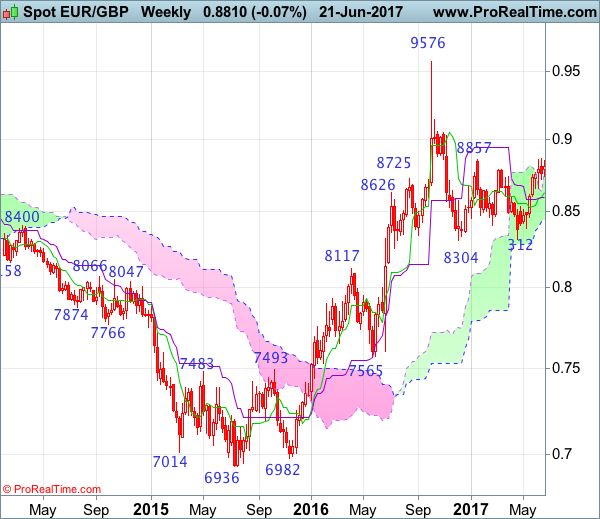
On the weekly chart, as the single currency has continued trading with a firm undertone, adding credence to our bullishness for the erratic rise from 0.8304 low to extend gain to 0.8840-50 (50% Fibonacci retracement of 0.9576-0.8304), then 0.8900-10, however, reckon upside would be limited to 0.9000 and 0.9045-50 should hold from here, price should falter well below 0.9090 (61.8% Fibonacci retracement), risk from there has increased for a retreat to take place later this month.
On the downside, although pullback to 0.8715-20 cannot be ruled out, reckon support at 0.8652 would hold and bring another rise to aforesaid upside targets. A weekly close below the Kijun-Sen (now at 0.8589) would defer and suggest top is possibly formed, risk weakness to 0.8550 but a drop below previous resistance at 0.8531 is needed to add credence to this view, bring further fall to 0.8490-00, then towards support at 0.8457 which is likely to hold from here. \
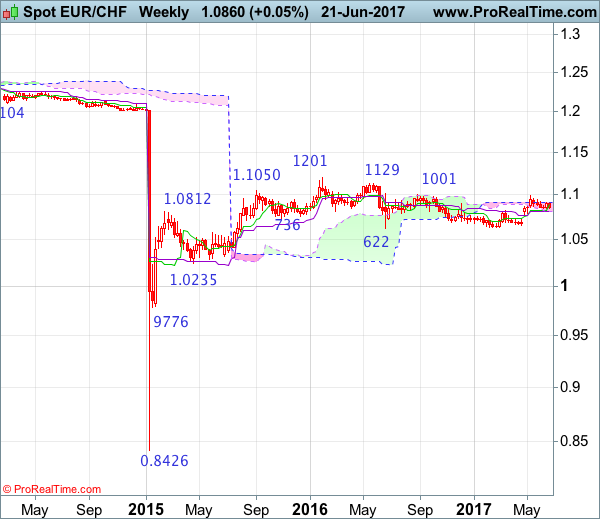
EUR/CHF Candlesticks and Ichimoku Analysis
Weekly
• Last Candlesticks pattern: Doji
• Time of formation: 20 Feb 2017
• Trend bias: Up
Daily
• Last Candlesticks pattern: Doji
• Time of formation: 1 Sep 2016
• Trend bias: Near term down
EUR/CHF – 1.0863
Failure to extend early rebound from 1.0838 and the subsequent retreat from 1.0910 suggest consolidation would be seen, however, as long as said support at 1.0838 holds, mild upside bias remains for another bounce to said resistance but a break of resistance at 1.0949 is needed to signal the pullback from 1.0988 has ended, bring test of 1.0960, break there would suggest upmove has resumed for retest of 1.0988, then towards previous resistance at 1.1001. Looking ahead, only a break there would retain bullishness and encourage for headway to 1.1050-60, then 1.1100, having said that, price should falter below another previous resistance at 1.1201.
On the downside, below 1.0838 support would risk test of previous support at 1.0792 but only a daily close below there would signal top is formed at 1.0988 instead, bring subsequent fall to 1.0750 and then towards 1.0700-10, having said that, support at 1.0671 should remain intact, the single currency shall stage another rebound from there later this month.
Recommendation: Hold long entered at 1.0865 for 1.1065 with stop below 1.0835.

On the weekly chart, despite this week’s initial marginal gain to 1.0910, lack of follow through buying and the subsequent retreat suggest consolidation would be seen and indicated support at 1.0838 needs to hold to retain prospect of another rebound, above 1.0910 would bring test of 1.0949 resistance but break there is needed to signal the pullback from 1.0988 has ended, bring retest of this level, above there would extend recent upmove from 1.0631 to previous resistance at 1.1001, a sustained breach above this level would signal the fall from 1.1201 has ended, bring further gain to 1.1100 and possibly test of resistance at 1.1129 but price should falter below said recent high at 1.1201.
On the downside, a break of said support at 1.0838 would risk test of the Kijun-Sen (now at 1.0810) but only break of previous support at 1.0780 would abort and signal top has been formed at 1.0988 instead, bring further weakness to 1.0720, however, still reckon support at 1.0656 would remain intact, bring another rebound later.
Euro Trading A Tad Higher, Ahead Of The ECB’s Economic Bulletin Report
For the 24 hours to 23:00 GMT, the EUR rose 0.29% against the USD and closed at 1.1167.
In the US, data showed that existing home sales unexpectedly advanced 1.1% to a level of 5.62 million on a monthly basis in May, defying investor consensus for a drop to a level of 5.55 million. In the previous month, existing home sales had recorded a revised reading of 5.56 million. Also, the nation's MBA mortgage applications climbed 0.6% in the week ended 16 June 2017, following a rise of 2.8% in the prior week.
In the Asian session, at GMT0300, the pair is trading at 1.1170, with the EUR trading slightly higher against the USD from yesterday's close.
The pair is expected to find support at 1.1141, and a fall through could take it to the next support level of 1.1113. The pair is expected to find its first resistance at 1.1185, and a rise through could take it to the next resistance level of 1.1201.
Ahead in the day, investors will keep a close watch on the European Central Bank's (ECB) economic bulletin report and the Euro-zone's flash consumer confidence data for June. Moreover, in the US, house price index for April, leading indicators for May and initial jobless claims data, will attract market attention.
The currency pair is trading above its 20 Hr and 50 Hr moving averages.

Interest Rate Hike Might Be Prudent In Second Half Of This Year: BoE’s Haldane
For the 24 hours to 23:00 GMT, the GBP rose 0.36% against the USD and closed at 1.2675, after the Bank of England's (BoE) Chief Economist, Andy Haldane, stated that he is likely to back an interest rate hike later this year, citing strong resilience of the economy and to prevent tightening too fast in the future.
Macroeconomic data showed that UK's public sector net borrowing has posted a deficit of £6.0 billion in May, after recording a revised deficit of £8.7 billion in the prior month. Meanwhile, markets were expecting public sector net borrowing to report a deficit of £7.0 billion.
In the Asian session, at GMT0300, the pair is trading at 1.2665, with the GBP trading 0.08% lower against the USD from yesterday's close.
The pair is expected to find support at 1.2599, and a fall through could take it to the next support level of 1.2534. The pair is expected to find its first resistance at 1.2720, and a rise through could take it to the next resistance level of 1.2776.
In absence of any crucial economic releases in the UK today, investor sentiment will be governed by global macroeconomic news.
The currency pair is showing convergence with its 20 Hr and 50 Hr moving averages.

Japanese Yen Trading On A Stronger Footing This Morning
For the 24 hours to 23:00 GMT, the USD slightly declined against the JPY and closed at 111.33.
On the data front, Japan’s final machine tool orders climbed 24.5% YoY in May, compared to a gain of 24.4% recorded in the preliminary figures. In the prior month, machine tool orders had registered a rise of 34.7%.
Meanwhile, the Bank of Japan (BoJ) Governor, Haruhiko Kuroda, reiterated that it is wise to stick to the central bank’s current monetary policy stance as inflation pressures in the economy remain stubbornly low.
In the Asian session, at GMT0300, the pair is trading at 111.04, with the USD trading 0.26% lower against the JPY from yesterday’s close.
The pair is expected to find support at 110.75, and a fall through could take it to the next support level of 110.45. The pair is expected to find its first resistance at 111.54, and a rise through could take it to the next resistance level of 112.03.
Looking ahead, investors will closely monitor Japan’s flash Nikkei manufacturing PMI for June, slated to release overnight.
The currency pair is trading below its 20 Hr and 50 Hr moving averages.

Swiss Franc Extends Its Gains In The Morning Session
For the 24 hours to 23:00 GMT, the USD declined 0.2% against the CHF and closed at 0.9724.
In the Asian session, at GMT0300, the pair is trading at 0.9722, with the USD trading marginally lower against the CHF from yesterday's close. The pair is expected to find support at 0.9711, and a fall through could take it to the next support level of 0.9701.
The pair is expected to find its first resistance at 0.9743, and a rise through could take it to the next resistance level of 0.9765.
The currency pair is trading below its 20 Hr and 50 Hr moving averages.

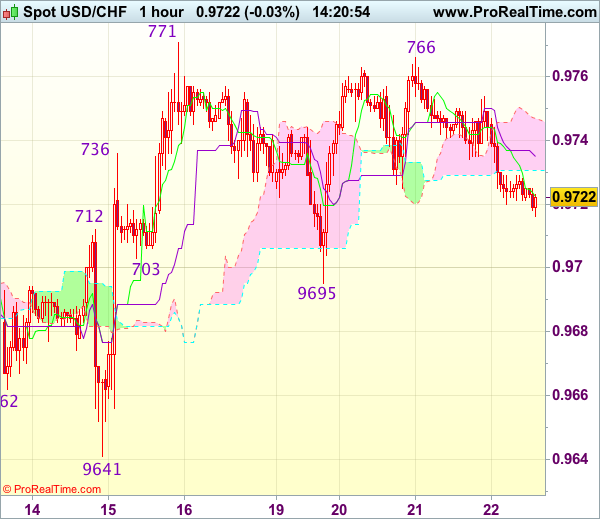
Trade Idea : USD/CHF – Hold long entered at 0.9705
USD/CHF - 0.9721
Most recent candlesticks pattern : N/A
Trend : Near term up
Tenkan-Sen level : 0.9723
Kijun-Sen level : 0.9735
Ichimoku cloud top : 0.9747
Ichimoku cloud bottom : 0.9731
Original strategy :
Bought at 0.9705, Target: 0.9805, Stop: 0.9690
Position : - Long at 0.9705
Target : - 0.9805
Stop : - 0.9690
New strategy :
Hold long entered at 0.9705, Target: 0.9805, Stop: 0.9690
Position : - Long at 0.9705
Target : - 0.9805
Stop : - 0.9690
As the greenback has slipped again after meeting resistance at 0.9766, suggesting further consolidation below said last week’s high at 0.9771 would be seen, however, as long as support at 0.9695 holds, bullishness remains for recent upmove to resume after initial sideways trading, break of said resistance at 0.9771 would confirm recent rise from 0.9613 low has resumed for test of resistance at 0.9808 but reckon previous resistance at 0.9825 would hold from here due to near term overbought condition.
In view of this, we are holding on to our long position entered at 0.9705. Below said support at 0.9695 would defer and risk weakness towards said support at 0.9641 but only break there would abort and revive bearishness, this would also suggest the rebound from 0.9613 has ended instead, bring retest of this level later.