Sample Category Title
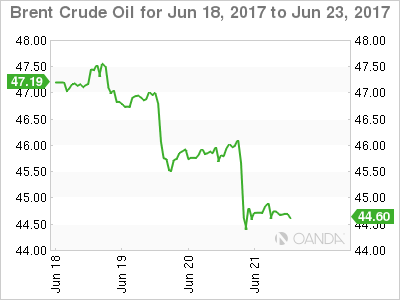
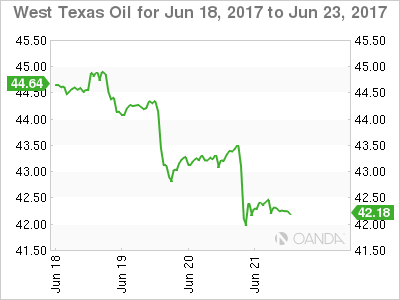
Crude Oil Inventories Drop For Second Straight Week
'US crude and gasoline stockpiles are significantly higher compared with their five-year averages, which will weigh on prices.' — Abhishek Kumar, Energy's Global Gas Analytics
US oil inventories fell for the second consecutive time last week, official data showed on Wednesday. As reported by the Energy Information Administration, the number of barrels of crude oil dropped 2.5M in the week ended June 16, compared to the preceding week's decline of 1.7M barrels, while analysts predicted a much lower drop of 1.2M barrels. US crude oil production climbed to 9.35M barrels per day, 20K higher than in the prior week, the EIA reported. Gasoline stockpiles plunged 578K, whereas analysts anticipated a gain of 444K barrels. In the meantime, distillate stocks advanced 1.1M barrels, surpassing expectations for a 465K-barrel increase. US refinery runs fell 104K bpd as the utilisation rate dropped 0.4% to 94%. The number of barrels of crude oil held in storage at the Cushing, Oklahoma, plunged 1.08M barrels during the reported week. Oil prices rose shortly after the report was published but failed to sustain those gains. Thus, soon after the release, West Texas Intermediate futures fell to $43.41 per barrel, whereas Brent futures declined to $45.79 per barrel.

Reserve Bank Of New Zealand Remains On Hold
'It appears that the bank isn't too perturbed by the rally in the currency given that export prices have also risen.' — Zoe Wallis, Kiwibank
The Reserve Bank of New Zealand held its policy and interest rates unchanged at its meeting on Thursday, stating it would unlikely change its stance in the near future. Policymakers voted to leave the benchmark rate at a record low of 1.75% and keep the Bank's monetary policy accommodative for 'a considerable period' amid high uncertainties. According to the RBNZ, interest rates are set to remain unchanged until late 2019 despite the fact that inflation returned to its 1-3% target range. Even though inflation hit 2.2% in the three-month period to March, policymakers said that the following inflation pickup was triggered by temporary factors. However, the Bank suggested that pay and non-tradables inflation would likely improve in the upcoming months. The RBNZ Governor Graeme Wheeler said that the Kiwi's recent gains were driven mainly by higher export prices. Nevertheless, the Governor noted that the weaker New Zealand Dollar would help to rebalance the growth outlook towards the tradable sector. Despite the weak March quarter performance, the Bank expressed optimism over the economic outlook for New Zealand.
Bear Territory For Oil?
Oil continued to trade lower on Thursday as traders look ready to test new lows for crude prices with worries persisting over a global glut.
Since peaking in late February, crude has dropped approximately 20%, with only brief rallies, completely erasing the gains it made at the end of the year following the initial OPEC-led production cut. OPEC and other major producers agreed to cut output by 1.8 million barrels per day from January for six months which was recently extended for an additional nine months. Whilst this was a major shift in policy for OPEC the hope it gave to markets was short lived. With increased production from the US, Nigeria, Libya and other producers the extra supply outstripped demand and forced prices lower. US Crude inventories fell 2.5 million barrels in the week to June 16, surpassing analyst expectations for a decrease of 2.1 million barrels. Even comments from Iran’s oil minister that OPEC members are considering further output cuts has made little impact to prices.
Brent crude was trading at $44.95 a barrel at 09:05 GMT, after spending much of the Asian trading day in positive territory. Brent had fallen 2.6% in the previous session to its lowest level since November of last year.
WTI was trading at $42.50 a barrel at 9:10 after spending much of the day trading higher this after touching its lowest intraday level since August 2016.
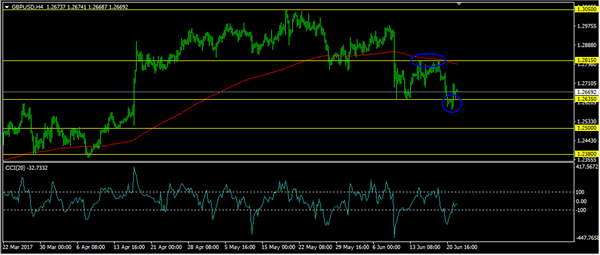
GBPUSD is trading around $1.2670 after making some gains on Wednesday after Bank of England’s chief economist, Andy Haldane, suggested that “he was likely to vote for an interest rate hike this year”. Haldane was largely supportive of keeping rates low, contrasting sharply with the tone set by the bank’s Governor Mark Carney just the day before.
NZD gained nearly 0.5% against USD following the expected RBNZ decision to keep interest rates unchanged at a record low 1.75%. RBNZ Governor Wheeler stated “Global economic growth has increased and become more broad-based. However, major challenges remain with on-going surplus capacity and extensive political uncertainty”. NZDUSD was trading at 0.7260 at 9:30 BST.
Markets will be looking at US Initial Jobless claims, that are released at 13:30 BST today and a scheduled speech from FOMC member Powell at 15:00 BST for further evidence of the US economy strengthening.
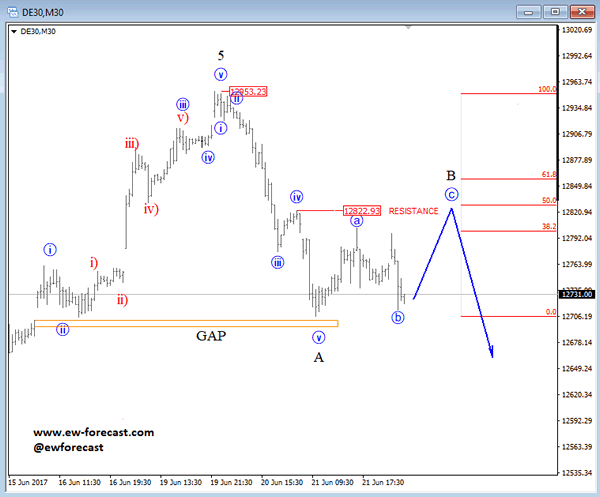
Elliott Wave Analysis: German DAX Trading In A Temporary Correction, More Weakness In View
German DAX is undergoing a three wave correction within black wave B. Upside for the final leg c of B can be found around the Fibonacci ratios of 38.2, 50.0 or 61.8 and as we can see on the chart around the previous levels of wave iv at 12822. Once wave B completes itself, a new reversal lower can come in play.
German DAX, 1H
Technical Outlook: GBPUSD – Recovery Remains Capped By Falling Tenkan-Sen
Cable stayed within 30-pips range in Asia and below fresh recovery high at 1.2709, following strong rally on Wednesday, sparked by hawkish comments from BoE's Haldane.
Failure to clearly break above 1.2700 pivot (50% of 1.2814/1.2588 downleg, reinforced by daily Tenkan-sen in steep fall and descending 10SMA), keeps risk at the downside, as daily studies are in bearish setup.
The pair may extend consolidation after repeated failure to close below cracked 100SMA, but limited upside is seen for now, as multiple bear-crosses of daily MA's maintain bearish pressure.
Lower pivots lay at 1.2631 (100SMA) and 1.2600 (correction low), loss of which would open way towards targets at 1.2578/50 (daily cloud base/200SMA).
Conversely, lift above 1.2700 pivot would expose key near-term barriers at 1.2800/20 zone (daily cloud top/recent multiple upside rejection).
Sterling will be closely watching the outcome of Queen's speech vote in the parliament for stronger signals. The vote will be basically vote of confidence in PM Theresa May and her government and approval of Queen's speech is expected to boost pound. Conversely, Sterling may come under strong pressure if Queen's speech will not be approved.
Res: 1.2686, 1.2700, 1.2728, 1.2757
Sup: 1.2656, 1.2631, 1.2600, 1.2578
Foreign Exchange Market Commentary: EUR/USD, USD/JPY, GBP/USD, GOLD, WTI CRUDE, DJIA, FTSE100, DAX
EUR/USD
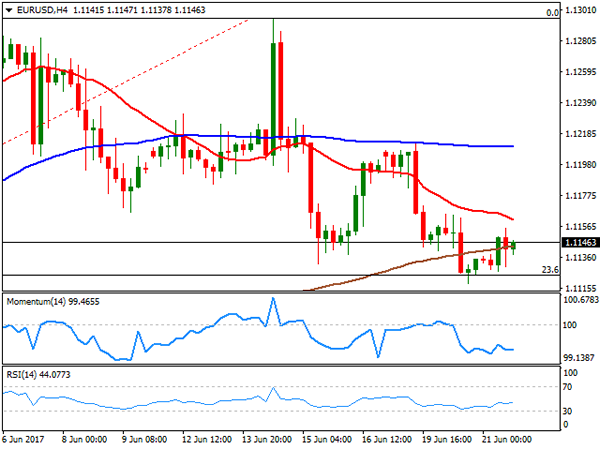
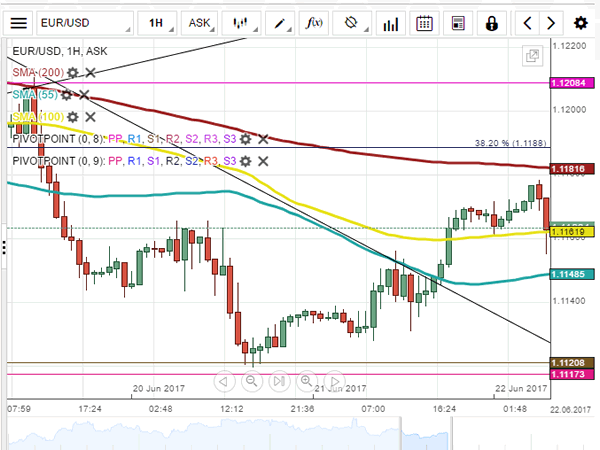
The EUR/USD pair recovered some ground after this Thursday, but the pair remained confined to a tight intraday range and near the lower end of its last 5-week extend. The European macroeconomic calendar remained empty, while in the US, Fed's officers were once again in the wires talking about unwinding the balance sheet, despite latest weak inflation, although with less impressive headlines. Also, the country released its May Existing Home Sales figures, surprisingly better-than-expected, as home prices rose by 5.8% to a new record. Sales climbed 1.1% to a seasonally adjusted annual rate of 5.62 million in the month, from a downwardly revised 5.56 million in April. This Thursday, the US will release its usual weekly unemployment data, alongside with April housing price index and the Kansas manufacturing index.
From a technical point of view, the pair has found some support around 1.1125 the 23.6% retracement of its latest bullish between 1.0606, April 10th low, and the high set this June at 1.1295. The pair has also a relevant low at 1.1109 posted on May 30th, with the lowest for the last five weeks being 1.1075, reached on May 18th. A break below this last will likely open doors for a steeper downward move, moreover as the price keeps moving away from the critical 1.1300 mark. In the meantime, the short term picture remains neutral-to-bearish, with the price holding below a strongly bearish 20 SMA that already broke below the 100 SMA, whilst technical indicators hold directionless near oversold readings.
Support levels: 1.1110 1.1075 1.1030
Resistance levels: 1.1220 1.1260 1.1300
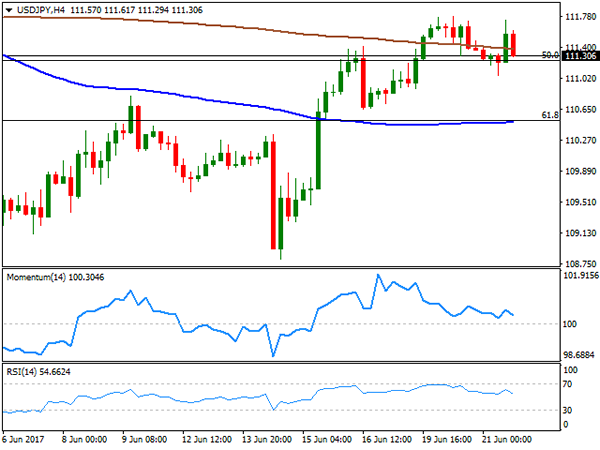
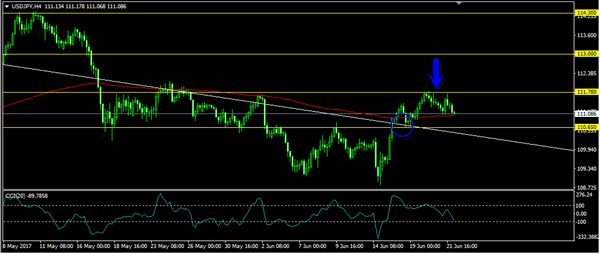
USD/JPY
The USD/JPY pair closed the day unchanged around 111.30, still stubbornly attached to yields' behavior and despite news coming from both major economies. The Bank of Japan released the Minutes of its latest meeting at the beginning of the day, cooling down speculation of tapering surged during the past few weeks. Policy makers officers acknowledged that the amount of government debt purchases will fluctuate under the current quantitative easing programme, but don't expect that to pose a problem, while also recognized that there's a long way ahead before inflation reaches the desirable target of 2%. In the US, existing home sales surprised to the upside, up in May by 1.1%, following a notable decline in April of 2.5% according to the official report. Technically, the 4 hours chart shows that the price struggles around a modestly bearish 200 SMA and the 50% retracement of its latest bullish run, while technical indicators eased within positive territory, lacking, however, directional strength, all of which limits chances of further gains ahead. A stronger decline is likely only on a break below 110.50, a strong Fibonacci support.
Support levels: 111.25 110.80 110.50
Resistance levels: 111.60 112.00 112.45
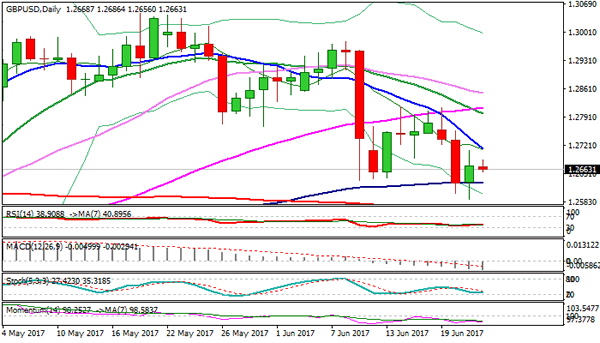
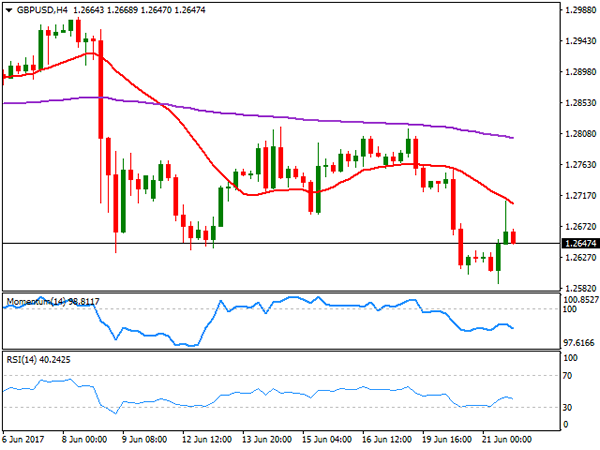
GBP/USD
It was a wild ride for the Pound this Wednesday, with the GBP/USD pair sinking to a fresh 2-month low of 1.2588 before bouncing to 1.2709, and then settled midway around 1.2640. The pair fell early London on news indicating that the Democratic Unionist Party (DUP) threatened to walk away from a deal with May's conservatives. The following bounce was triggered by hawkish comments coming from BOE's Haldane, who said he is ready to vote for a rate hike amid rising inflation. Haldane didn't vote for a hike in the latest monetary policy meeting, which pretty much anticipates already 4 hike votes out of 8 MPC members for the next Central Bank meeting. Also, Queen's speech at the Parliament opening, focusing on getting the best deal possible for the UK on the Brexit, something looking harder day after day, as PM May seems unable to form a government. Mid American afternoon, hundreds of protesters marched to Downing Street, asking for May's resignation, while another of her top advisors, John Godfrey, quit. The 4 hours chart shows that the intraday rally found sellers around a bearish 20 SMA, currently around 1.2710, while technical indicators have resumed their declines well-below their mid-lines, after correcting oversold readings earlier today. The risk remains towards the downside, with an immediate support now at 1.2635, the post-election low.
Support levels: 1.2635 1.2590 1.2560
Resistance levels: 1.2670 1.2710 1.2750
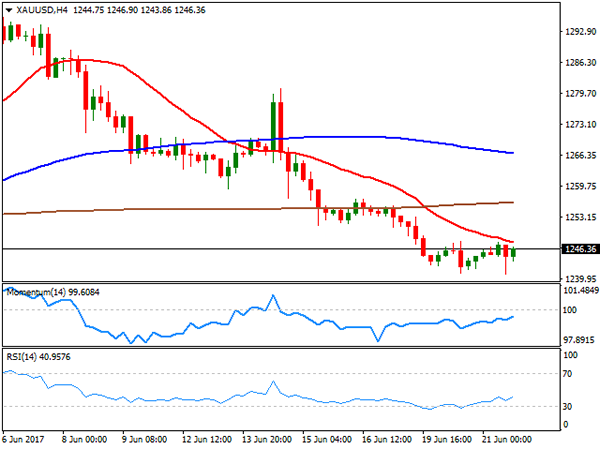
GOLD
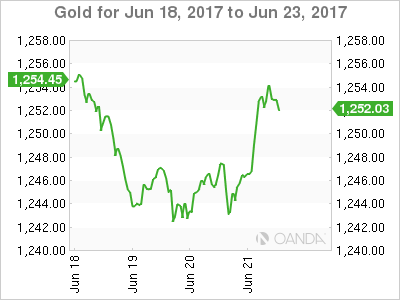
Gold prices consolidate losses around the 1-month low reached this week, with spot adding a few cents daily basis and settling at $1,246.10 a troy ounce. The commodity was unable to attract buyers, despite falling equities, while the downside was limited by diminishing Fed's surprise headlines on rate hikes and shrinking the balance sheet. The daily chart for the commodity shows that the price peaked right below Tuesday's high, but still stands below its 20 and 100 DMAs, while technical indicators turned horizontal near well below their mid-lines, limiting chances of a steeper recovery. In the 4 hours chart, the recovery stalled right below a bearish 20 SMA, this last acting as an immediate resistance at 1,248.20 while technical indicators recovered within negative territory, not enough to confirm an upcoming advance. At this point, the commodity would need to advance beyond 1,260.00 to regain its bullish stance and attempt a retest of the 1,300 region.
Support levels: 1,241.95 1,230.90 1,222.80
Resistance levels: 1,248.10 1,257.20 1,265.90
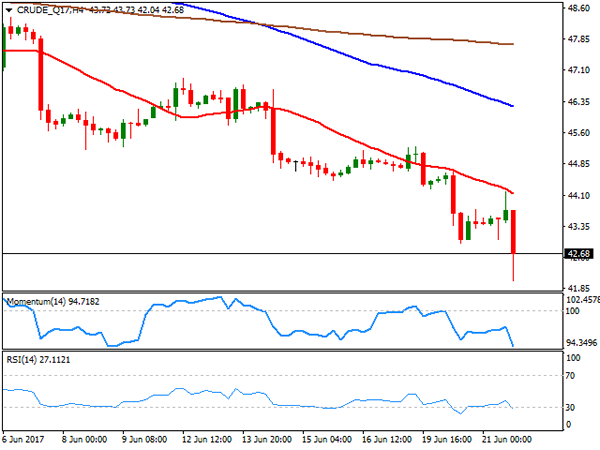
WTI CRUDE OIL
Crude oil prices extended their declines to fresh 2017 lows, despite the EIA weekly stockpiles´ report showed a larger-than-expected draw-down. West Texas Intermediate crude oil prices traded at as low as $42.04 a barrel and settled at 42.66, while Brent fell below $45.00 a barrel. The US Energy Information Administration reported that crude inventories declined by 2.45 million barrels in the week ended June 16th, exceeding expectations for a 2.1 million-barrel drop, with the news triggering a short-lived spike in prices. West Texas Intermediate crude futures quickly turned south as the headline was not enough to revert concerns over a worldwide glut. From a technical point of view, the daily chart shows that technical indicators extended their declines, with the RSI still heading south, despite being at 23, and the price further below its moving averages, in line with further declines. Shorter term, and according to the 4 hours chart, the risk remains also towards the downside, as an early advance was rejected by a bearish 20 SMA, whilst technical indicators are currently consolidating within oversold levels, due to limited volumes at the time being.
Support levels: 42.10 41.65 41.10
Resistance levels: 43.00 43.75 44.50
DJIA
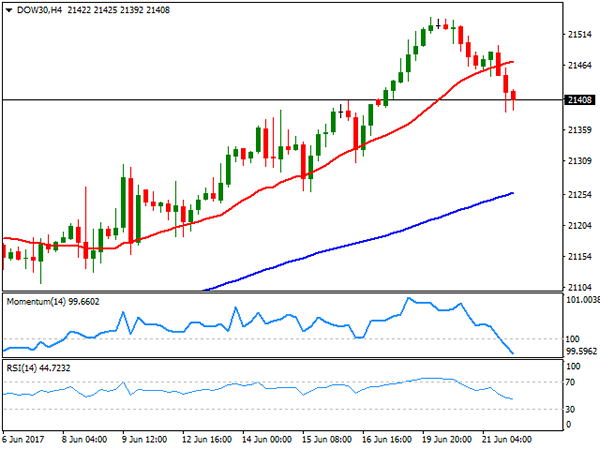
Wall Street closed mixed, with only the Nasdaq Composite managing to advance, up 45 points to 6,233.95. The Dow Jones Industrial Average lost 57 points, and closed at 21,410.03, while the S&P ended pretty much unchanged, down 0.06%, to 2,435.61. The sour sentiment that dominated equities at the beginning of the week was exacerbated by a sharp decline in oil prices to fresh 2017 lows. Within the Dow, Caterpillar led decliners, down 3,52%, followed by El du Pont and Chevron, down 2.65% and 1.82% respectively. Nike was the best performer adding 1.83%. Falling for a second day in a row, the daily chart for the DJIA shows that the movement remains corrective, as moving averages maintain their sharp bullish slopes below the current level, whilst the RSI indicator is barely beginning to correct overbought conditions, now heading lower around 66. In the 4 hours chart, the index is poised to extend its decline, having extended below its 20 SMA and with technical indicators heading south within bearish territory.
Support levels: 21,389 21,351 21,303
Resistance levels: 21,449 21,495 21,542
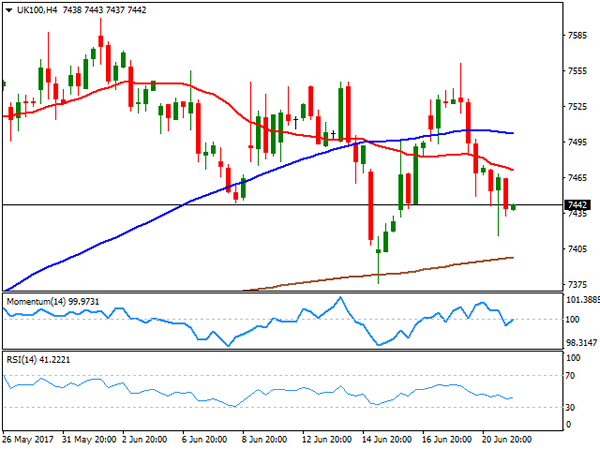
FTSE100
The Footsie edged lower, undermined by a stronger Pound and falling oil prices. The London benchmark settled at 7,447.79, down 24 points or 0.33%, as the Sterling got an unexpected boost from BOE's Haldane, pledging to vote for a rate hike in the next BOE's meeting should inflation remain high. Plummeting oil prices weighed on the energy sector, although financials also edged lower across the region. The worst performer was Provident Financial, down by 17.59% after warning a shake-up of its lending division would dent profits much more than previously forecast. Among losers was also Royal Dutch Shell, down 1.34%, and Standard Chartered that lost 1.33%. Whitbread was the best performer with a 3.40% gain. The daily chart for the FTSE 100 shows that the index remains below a directionless 20 DMA but above its 100 DMA, while technical indicator present modest downward slopes right below their mid-lines, maintaining the risk towards the downside. In the 4 hours chart, the technical outlook is neutral-to-bearish as indicators keep hovering around their mid-lines, but the index develops below its 20 and 100 SMA, with the shortest gaining bearish traction.
Support levels: 7,403 7,376 7,327
Resistance levels: 7,499 7,541 7,584
DAX
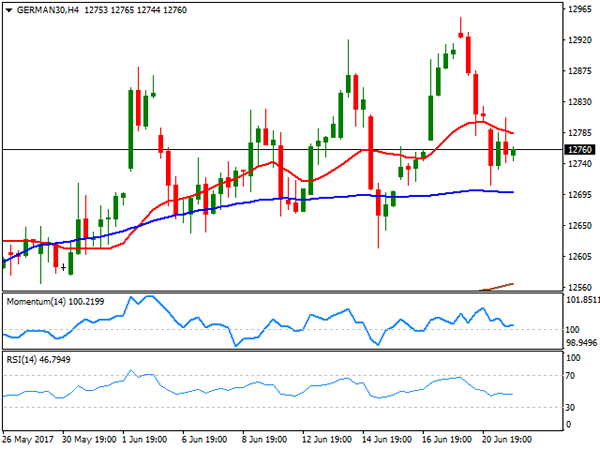
The German DAX closed the day at 12,774.26, down 40 points amid falling oil prices dragging energy-related equities lower. Banks and retailers also edged lower across the region, and within the DAX, Deutsche Boerse was the worst performer, down 1.84%, while Commerzbank shed 0.81% and Deutsche Bank lost 0.35%. Only 5 members closed up, led once again by ThyssenKrupp that added 2.23%. The index closed down for a second consecutive day, now flat weekly basis, and with the daily chart showing that the index met some buying interest on a test of its 20 DMA, now around 12,719, the immediate support, while technical indicators turned lower, still holding above their mid-lines. In the shorter term, and according to the 4 hours chart, the benchmark presents a neutral-to-bearish stance, trading a few points below its 20 SMA but above the larger ones, whilst technical indicators head nowhere around their mid-lines.
Support levels: 12,719 12,653 12,605
Resistance levels: 12,807 12,851 12,892
Commodities: The 1st Cut Isn’t The Deepest
Gold lifted by Oil's collapse as the noise around a deeper OPEC cut intensifies.
Oil's suffering continued overnight with both Brent and WTI finishing over 2 percent lower in the New York session. The story, however, isn't the headline fall for the session, it is the price action after the U.S. EIA Crude Inventory numbers. Inventories fell by a larger than expected 2.45 million barrels with gasoline inventories also falling 0.6 million barrels. Crude immediately bounced about one dollar, but both Brent and WTI ran into a brick wall of sellers and collapsed some 4 percent to both finish near their lows.
The fact that oil is now falling on a bullish inventory number must be a red light for producers and traders alike. One implication is that U.S. shale producers have moved their hedges lower and are selling oil futures on any rally from these levels as per last night. The other is that OPEC/Non-OPEC must now confront the oil elephant in the room, increasing the overall production cut from its present levels. The other choice will be to let the market set the price which may mean oil drops to a level that even the newly slimline U.S. shale industry struggles to break even at. OPEC may be forced to choose the least ugly horse in the glue factory in a Hobson's choice nightmare.
Brent spot trades at 44.60 with Asia's dead cat bounce over as soon as Europe has walked in. Resistance is at last night's highs around 46.50 followed by 47.70. Technical support is absent until the November low at 42.95 followed by the must hold 41.00 region.
WTI spot trades at 42.15 this morning with its nascent rally meeting the same fate as Brent's. Resistance is at 44.00 and 45.00. Support is just below at 42.00 followed by a charting black hole until the 39.00 region.
Gold finally showed some signs of life overnight with a weak pulse helping the yellow metal climb seven dollars to finish at 1252.00 for the New York session. The uncontrolled oil price spill in the futures markets may have seen some traders pushing the risk aversion button and buying gold. The primary driver, however, appears to be the flattening of the longer-dated U.S. Treasury curve, particularly the 10/30 year spread as the bond market continues to call the Federal Reserve's bluff on the trajectory of U.S. rates and the underlying health of the economy.
With the weekend rapidly approaching and the carnage in the oil market, which is rattling investors, we may see some buying emerge in precious metals to hedge risk aversion in what is a very data-light week.
Gold is trading at 1252.00 in early Europe with the 100-day moving average at 1248.35 below the initial support followed by 1240. Above, gold has a clear run until first resistance at 1257.00 followed by 1267.00, some distance behind.
Daily Technical Analysis: EURUSD, GBPUSD, USDJPY, USDCHF
EURUSD
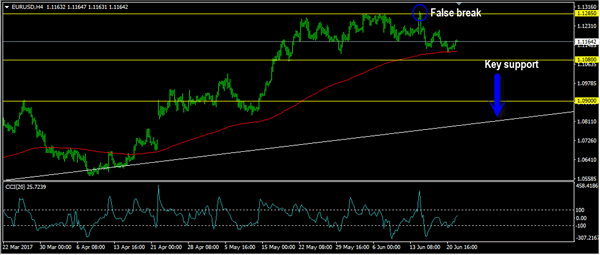
The EURUSD had a moderate bullish momentum yesterday topped at 1.1169. The bias is neutral in nearest term. As long as stay above 1.1080 I remain bullish, but we need a clear break above 1.1285 to end the current bearish correction phase (after the false break above 1.1285 last week) and continue the bullish scenario targeting 1.1350 – 1.1452 area. On the downside, 1.1080 remains a good place to buy with a tight stop loss, as a clear break and daily close below 1.1080 would interrupt the bullish scenario testing a major trend line support and 1.0900 as you can see on my H4 chart below.
GBPUSD
The GBPUSD failed to continue its bearish momentum yesterday topped at 1.2710 but closed a little bit lower at 1.2670. The bias is neutral in nearest term. The double top bearish scenario (1.2815) should remain valid, but any rejection to move consistently below 1.2635 could create a false breakdown bullish scenario retesting 1.2815. On the downside, a clear break and daily close below 1.2635 would expose 1.2500 region. Overall I remain neutral.
USDJPY
The USDJPY had another indecisive movement yesterday. The bias is neutral in nearest term probably with a little bearish bias. Price is still in a bullish phase after broke above the trend line resistance as you can see on my H4 chart below, but found an important resistance at 111.78 – 112.00 which need to be clearly broken to the upside to continue the bullish phase targeting 113.00 region. On the downside, key support is seen around 110.65. A clear break back below that area would interrupt the bullish scenario testing 110.00 or lower.
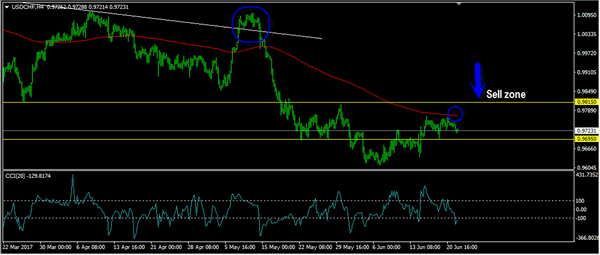
USDCHF
The USDCHF had a moderate bearish momentum yesterday and hit 0.9716 earlier today. The bias is bearish in nearest term testing 0.9695. A clear break below that area could trigger further bearish pressure testing 0.9650 region. Immediate resistance is seen around 0.9770 but key resistance remains around 0.9815 which remains a good place to sell with a tight stop loss as a clear break above that area would end the bearish outlook testing 0.9900 area or higher.
EUR/USD Analysis: Breaks Short Term Pattern
Although the recent surge of the EUR/USD currency exchange pair was mainly caused by the depreciation of the US Dollar, the push was strong enough to pass the resistance of a channel down pattern. The pattern dictated the pairs movements throughout June, and it was expected that it will continue to do so until the end of the month. However, after seven hours of continues assault, the upper trend line of the descending channel was broken. On Thursday morning the currency pair traded between the 100 and 200-hour SMAs, respectively, at 1.1162 and 1.1182. It is most likely that the rate will resume its decline, as it is expected in the medium term. However, market participants should watch out for short term surges.
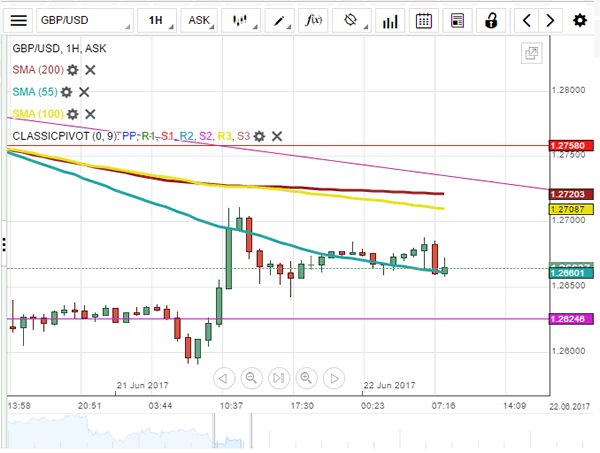
GBP/USD Analysis: Anchored Around 1.27
As was anticipated, the Sterling done its best to erase most of Tuesday's losses yesterday, but was still unable to fully reclaim the 1.27 level, which resulted in a close 30 pips lower. The Cable is now expected to maintain trade between the monthly S2 and the monthly S1, with the exchange rate mostly gravitating towards the 1.2750 area. Consequently, another bullish development today would confirm this scenario, even though some technical indicators suggest otherwise. Furthermore, the GBP/USD currency pair has been sliding down for five weeks in a row now, which only adds fuel to the already bearish ‘fire'. A possible trend-line at 1.2730 could also limit today's gains should they occur. In case bears manage to prevail, the pair is unlikely to drop far below the monthly S2 or the 1.26 major level.