Sample Category Title
Trade Idea Update: USD/JPY – Buy at 110.65
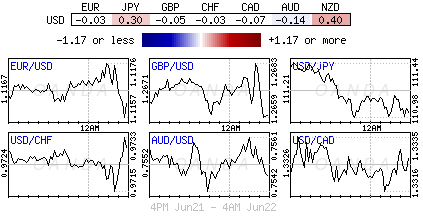
USD/JPY - 111.23
Original strategy :
Buy at 110.65, Target: 111.65, Stop: 110.30
Position : -
Target : -
Stop : -
New strategy :
Buy at 110.65, Target: 111.65, Stop: 110.30
Position : -
Target : -
Stop : -
As the greenback slipped again after faltering below recent high at 111.79, retaining our view that further consolidation below this level would be seen and pullback to 110.80 is likely, however, reckon previous support at 110.65 would limit downside and bring another rise later, above 111.45-50 would bring retest of 111.79 but break there is needed to confirm the rise from 108.82 low has resumed and extend headway to 111.90-95 (50% projection of 108.82-111.42-110.65), however, upside should be limited to resistance at 112.13 and 112.25 (61.8% Fibonacci retracement of 114.37-108.82 and 61.8% projection) should hold.
In view of this, would not chase this rise here and we are looking to buy dollar on pullback as 110.65 support should limit downside. Below 110.30-35 (50% Fibonacci retracement of 108.82-111.79 and previous resistance turned support) would abort and signal a temporary top has been formed instead, risk weakness towards 109.95-00 (61.8% Fibonacci retracement).

CAC Inches Lower as Investors Search for Cues
The CAC index has ticked lower in the Thursday session. The index has dropped 0.32% and is currently trading at 5260.25 points. On the release front, the eurozone will release consumer confidence, which is expected to remain at -3 points. On Friday, the eurozone will release Manufacturing PMI, which continues to point towards expansion.
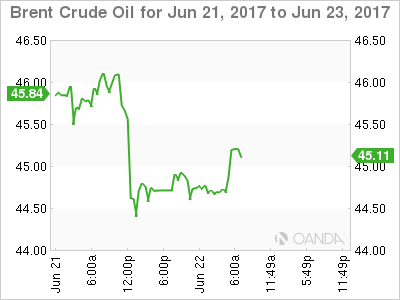
French stock markets lost ground on Wednesday, as falling oil prices weighed on share prices. Brent crude is down 4.6% this week, and has dropped below $45 a barrel, its lowest level since November 2016. June has been a disaster for oil producers, with Brent sinking 10.5% this month. With the world awash in oil, crude prices could be headed even lower. OPEC has made intensive efforts to cut production, but supply continues to outstrip demand. Lower oil prices have also taken the wind out of inflation in North American and Europe (with the exception of Britain), as central banks in the US, Japan and the eurozone continue to grapple with weak inflation levels that are well below the target of 2.0%. If crude continues to nosedive, the CAC could drop to lower levels.
The Federal Reserve raised interest rates last week, and also stated that it was ready to tackle its bloated balance sheet. The balance sheet has ballooned to $4.5 trillion, which accumulated after the 2008 financial crisis when the Fed went on a bond-buying spree to stimulate the economy. The reduction will be gradual, but still marks an important change in direction for the central bank. It's not clear when the Fed will start to trim. FOMC member Patrick Harker said on Wednesday said that he was in favor of the reduction commencing in September, but added that the Fed had yet to determine a start date. As for additional rate increases, the Fed has hinted at one more rate hike in the second half of 2017, and the markets have circled December as the most likely date for a rate move. The CME Group has pegged the odds of a September hike at just 13%, compared to 18% a week ago. However, the odds for a December increase are at 49%, and this could increase if Fed policymakers continue to wax positive about the economy.
It’s Deja Vu For The Dollar
Global stocks remain on the back foot, pressured by crude oil tumbling into a ‘bear' market on concern a global supply glut will persist.
The weakness in crude and other commodities is denting the Fed's argument that weak inflation rates will be transitory, despite the domestic economy showing any signs of distress. Fixed income dealers are facing a ‘bull' flattening U.S treasury yield curve.
The yen is heading for its longest winning streak in nine-weeks, while gold continues to climb from its one-month low.
In the U.K, investors are watching the divorce proceedings with the E.U. PM May heads to Europe for her first summit since the recent election and will outline her approach towards E.U nationals before publishing a detailed plan next Monday.
Note: Fed Governor Powell speaks at a hearing of the Senate Banking Committee in Washington.
1. Stocks under pressure from commodities
Battered oil prices hovering near seven-month lows on worries about a supply glut and falling demand is taking its toll on global equity indices.
In Japan, the Nikkei ended a tad lower as a stronger yen (¥111.12) took a toll on sentiment. The broader Topix fell -0.1% after fluctuating throughout the session.
Down-under, Australia's S&P/ASX 200 Index jumped +0.7%, after tumbling -1.6% in the previous session to erase all of this years gains.
In Hong Kong, the Hang Seng was little changed as investors ponder the potential impact of MSCI's decision to include more mainland China stocks in a key benchmark index.
In China, the Shanghai Composite Index slipped -0.3%, after climbing yesterday on MSCI Inc.'s decision to include mainland shares in its indexes. The CSI 300 Index has erased almost all of its +1.3% gain.
In Europe, regional indices have fallen for a third consecutive day as battered oil prices hover atop of its seven-month lows hit. The U.K's FTSE 100, Germany's DAX and France's CAC 40 have all slipped -0.3-0.4%.
U.S stocks are set to open in the ‘red' (-0.1%).
Indices: Stoxx600 -0.5% at 387, FTSE -0.6% at 7406, DAX -0.4% at 12729, CAC-40 -0.6% at 5241, IBEX-35 -0.8% at 10651, FTSE MIB -1.0% at 20867, SMI +0.3% at 9017, S&P 500 Futures -0.1%.
2. Oil prices slip as physical excess overpowers OPEC
Oil dropped -2% yesterday and is little changed in the overnight session on continued negative sentiment about global market oversupply. Jawboning from Iranian oil officials has had little effect on price action.
Yesterday's EIA data for crude oil stocks showed a drop last week of -2.5m barrels, coming in more than expected. However, concerns of continued increases in supply continue to outweigh any bullish data.
Brent crude futures are down -15c at +$44.67 a barrel –it fell -2.6% in the previous session to their lowest since November. U.S crude futures (WTI) are down -14c at +$42.39 a barrel – yesterday, they touched their lowest intraday level since August 2016.
Since peaking in late February, crude has dropped around -20% in the wake of the initial OPEC-led production cut.
Note: OPEC and non-OPEC oil producers' compliance with the output deal reached 106 percent in May. However, a number of producers – notably Iraq, Saudi Arabia and Russia – aggressively ramped up output in the run-up to the deal.
Ahead of the U.S open, gold prices have rallied (+0.5% to +$1,252.41 per ounce) for a second consecutive session as risk averse sentiment amid weaker oil prices drives up the demand for the metal, with a softer USD and weakness in U.S Treasury yields also lending support.
3. Yield's ‘bull' flattener
Subdued inflation and concerns about the outlook for global growth as the Fed raises rates has triggered a flattening in bond yield curves.
The gap between yields on U.S 5-yeqr notes and 30-year long bond has flattened to +95 bps, holding atop its narrowest in a decade.
Note: A flatter curve suggests that both dealer and investor have concerns about the future pace of both growth and inflation.
Treasuries had a low impact session Wednesday, with little volatility in a choppy market. 10-year yield are flat in the overnight session, just over +2.15%, while the 10-year/30-year spread curve continues to flatten reaching +56.7 bps, bringing the 30-year lower to 2.72%.
Yesterday, Philly Fed President Harker argued for a 'pause in rate policy' in the months ahead as the Fed implements its balance sheet unwind. Harker believes a pause would be prudent, citing business owners telling him that they are 'feeling real pressure for wage increases given the strong jobs market.' He expects inflation will eventually assert itself.
Note: In April, Fed's Dudley (dove, FOMC voter) also made the case for a 'little pause' in rate hikes when the Fed starts reducing bond holdings on the balance sheet, to avoid simultaneous policy moves.
4. 'Big' dollar little changed
The USD remains steady against the major currencies (€1.1166, £1.2655 and ¥110.10) in relatively quiet trading.
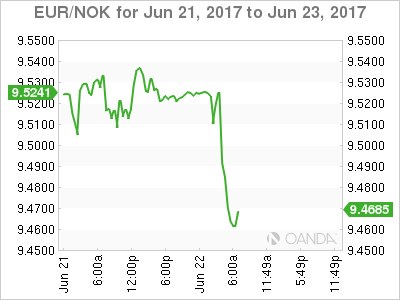
The NOK currency was the main focus after Norway's Central Bank (Norges – see below) removed its 'easing' bias. Norges now sees the Deposit Rate at current level going forward. EUR/NOK has fallen from €9.51 to test below €9.47 before consolidating.
Note: Policy officials had previously leaned towards more rate cuts if needed.
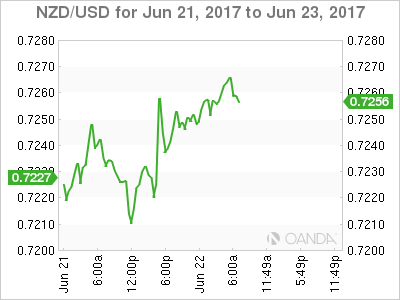
Elsewhere, the NZD has gained +0.5% to NZ$0.7257 after the Reserve Bank of New Zealand (RBNZ) yesterday held official cash rates at record lows, but sounded less ‘dovish' than bears in the market had been banking on.
5. Reserve Bank of New Zealand (RBNZ) and Norges decisions
Yesterday's RBNZ statement provided little foreign exchange rate jawboning and a positive growth outlook.
Kiwi officials left the overnight benchmark at +1.75% as expected. Governor Wheeler Graeme cited 'numerous uncertainties' locally and globally that would keep the central bank cautious.
In Europe, Norway's central bank (Norges) left its deposit rate unchanged at +0.5% as expected. The decision was unanimous and the rate is likely to be at current level in period ahead – removed the easing bias – and reiterated their view that forecasts are little changed from March.
Inflation is lower than expected and may continue to drift down in the months ahead as low domestic cost growth is weighing on inflation.
Oil Bears Chase Away Equity Bulls
A renewed sell-off in oil prices amid oversupply concerns effectively dented risk sentiment on Wednesday with global stocks exposed to heavy losses as oil bears pressured equity bulls. European markets were punished by the sharp decline in energy shares and the bearish contagion was swift to contaminate Wall Street which concluded mostly lower. Although Asian stocks edged cautiously higher during Thursday's trading session, the lack of appetite for risk may limit upside gains.
It seems oil prices have a firm grip on the financial markets with equities retreating and risk aversion intensifying when the commodity tumbles. With depressed oil, ongoing Brexit developments and political instability in the US still weighing on sentiment, a pending stock market correction could be on the cards.
BoE's Haldane enters the scene
Sterling volatility may intensify in the coming weeks as Brexit talks, the formation of a UK coalition government and an interest rate tug of war between BoE policymakers get underway. It was only on Tuesday that Mark Carney inspired bears when he suggested that 'now is not yet the time to raise interest rates,' but on Wednesday bulls received a pleasant surprise after BoE's Andy Haldane offered a hawkish lifeline. With Haldane widely viewed as one of the more conservative members of the BoE when it comes to rate increases, his comments on backing a rate hike this year were seen as a big deal. Although the expectation of higher rates could support the British Pound, gains are likely to remain limited by UK political risk and uncertainty over Brexit.
Speaking of politics, Theresa May jets off to Brussels on Thursday where she is expected to provide the European Union leaders insight on the rights of EU citizens residing in Britain after Brexit. Although the outcome of May's meeting in Brussels remains another uncertainty, sellers can capitalize on this to drag Sterling lower. From a technical standpoint, the GBPUSD currently respects a bearish channel on the daily charts. A breakdown below 1.2600 should encourage a further selloff towards 1.2450.
Dollar Index hovering around 97.50
The Dollar Index retreated from a one-month high against a basket of currencies during Wednesday's trading session as a selloff in Wall Street encouraged some traders to profit take. Although the Greenback roared back to life at the start of the week following hawkish comments from a Fed official, price action currently suggests that Dollar bullish investors are lacking the inspiration to support prices further. Investors may direct their attention towards the pending unemployment report from the U.S this afternoon which could pump some life back into the Dollar if unemployment claims fall. From a technical standpoint, the Dollar Index is at risk of trading lower if bulls fail to break above 98.00.
Commodity spotlight – WTI Oil
WTI Crude was exposed to steep losses during Wednesday's trading session as sellers exploited the persistent oversupply concerns to initiate fresh rounds of selling. The bigger-than-expected decline in U.S Crude stockpiles did little to quell the selloff with technical traders utilizing the technical bounce to drive prices lower. With the 'bear market' in Crude attracting bearish investors to the commodity like bees to honey, further downside should be expected moving forward. From a technical standpoint, WTI is extremely depressed on the daily charts and a breakdown below $42 should encourage a further decline towards $40.
Market Update – European Session: Norway Central Bank Removes Its Easing Bias
Notes/Observations
ECB Economic Bulletin was in line with Draghi's Jun press conference with current economic recovery is proving to be increasingly robust with inflation likely to remain around recent levels in coming months
Norway Central Bank keeps policy steady but removes easing bias
Japan Govt raised overall economic assessment for the 1st raise since Dec
Overnight
Asia:
New Zealand Central Bank (RBNZ) left its Official Cash Rate (OCR) unchanged at 1.75% (as expected). Noted that its policy to remain accommodative for some time and that a lower currency would help rebalance for New Zealand growth. Recent changes announced in Budget 2017 should support the outlook for growth.
BOJ Dep Gov Iwata: Monetary easing was still necessary in Japan; Inflation was still lacking momentum and remained distant from target
PBoC Adviser Sheng Songcheng reiterated that PBoC woud not unwind balance sheet like the US Fed. Liquidity would not be tighter in China, market rates had kept increasing for some time and don't have large room to rise further
Europe:
Democratic Unionist Party (DUP) MP Donaldson: Remain confident that a deal with the UK govt will be done; have made progress in talks with Conservatives. Deal centers on infrastructure spending and cuts in air travel tax and VAT
German Finance Ministry Monthly Report reiterated view that domestic economy was in an upswing; exports to rise despite uncertainties
Americas:
Fed's Harker (hawk, voter) has argued for a pause in rate policy in the months ahead as the Fed implements balance sheet unwind
Energy:
Weekly DOE Crude Oil Inventories: Crude -2.5M v -1.0Me
Economic Data
(CH) Swiss May Trade Balance (CHF): 3.4B v 2.0B prior, Real Exports M/M: +2,9 v -2.4% prior; Real Imports M/M: +2.0 v +3.5% prior
(FR) France Jun Business Confidence: 106 v 105e; Manufacturing Confidence: 108 v 109e, Production Outlook: 17 v 7 prior, Own-Company Production: 13 v 16 prior
(DK) Denmark Jun Consumer Confidence: 7.1 v 6.3e
(TR) Turkey Jun Consumer Confidence: 70.0 v 72.8 prior
(NO) Norway Central Bank (Norges) left its Deposit Rates unchanged at 0.50%; as expected
(PH) Philippines Central Bank (BSP) left its Overnight Borrowing Rate unchanged at 3.00%; as expected
(TW) Taiwan Central Bank (CBC) leaft itsBenchmark Interest Rate unchanged at 1.375% (as expected)
Fixed Income Issuance:
None seen
SPEAKERS/FIXED INCOME/FX/COMMODITIES/ERRATUM
Equities
Indices [Stoxx600 -0.5% at 387, FTSE -0.6% at 7406, DAX -0.4% at 12729, CAC-40 -0.6% at 5241, IBEX-35 -0.8% at 10651, FTSE MIB -1.0% at 20867, SMI +0.3% at 9017, S&P 500 Futures -0.1%]
Market Focal Points/Key Themes European Indices trade lower across the board with the exception of the Swiss SMI gaining on strength in shares of Novartis which account for ~20% of the index. Weakness in Oil continues to be the overriding theme, with futures down over 2%, which continue to weigh on commodity names. On the corporate front Imagination Technologies trades sharply higher after formally announcing a sale process, whilst Healthcare stocks Novartis trades higher after phase III results, and Santhera Pharma is up after positive MHRA opinion. Altran shares declining after holders sold 8.4% of capital.
Equities
Industrials: [Chemring [CHG.UK] +4.3% (Earnings), Solstad Farstad [SOFF.NO] -7% (Names new CFO)]
Technology: [ Imagination Technologies [IMG.UK] +15.0% (Starts formal sale process), Altran [ALT.FR] -4.5% (Placing by holders)]
Healthcare: [Novartis [NOVN.CH] +2.9% (Phase III study shows ACZ885 (canakinumab) reduces cardiovascular risk in people who survived a heart attack), Sannthera Pharma [SANN.CH] +9.3% (Positive MHRA opinion), Shire Pharmaceuticals [SHP.UK] +2.2% (Announces EMA Validation of Veyvondi)]
Speakers
ECB Economic Bulletin noted that the Current economic recovery is proving to be increasingly robust with inflation likely to remain around recent levels in coming months
ECB's Praet (Belgium): ECB understands German complaint on low interest rates. Inflation to pick-up eventually. ECB needed its own debt-sustainability study on Greece
Norway Central Bank (Norges) Policy Statement noted that the decision to keep policy steady was unanimous. Rate likely to be at current level in period ahead. Reiterated view that forecasts are little changed from March
Norway Central Bank (Norges) Gov Olsen post rate decision press conference noted that it still needed expansionary monetary policy. Interest rates were likely to stay at current level for a significant time
ECB's Hakkarainen (SSM member): banks should not wait for the public sector to provide an overarching solution to NPL proble
France President Macron reiterated the need for stronger Euro Zone integration, including a shared budget for the zone. Wanted a Euro Zone budget and noted that Germany was willing to accept change
Chancellor Hammond: Confident of reaching an agreement with DUP on working govt. Says he was behind PM May 'all the way'
Democratic Unionist Party (DUP) MP Donaldson reiterated view that chances of Conservative-DUP agreement was very good
ECB lowered emergency liquidity assistance (ELA) cap for Greece banks from €44.2B to €43.6B
South Africa Chief Justice Mogoeng noted that no-confidence motion was a tool for accountability. Constitution did not specify type of vote but Parliament could determine the type of vote. Speaker could determine whether to use secret ballot in motion of no-confidence against President Zuma
Hungary Central Bank (NBH) Jun Inflation Report saw CPI between 2.0-2.5% in coming months. Forecasted 2017 Core Inflation at 2.3% and 2018 Core Inflation at 2.8%
S&P Global chief ratings officer Kraemer: Brexit negotiations is a lose-lose for both UK and Europe. Believed that UK had more to lose in negotiations; recent election results reduced options. Any UK sovereign downgrade would unlikely be more than one notch
Philippines Central Bank Policy Statement reiterated view that current policy settings remained appropriate as keeping policy steady gave space to monitor developments. It noted that inflation risks were tilted to the upside but its baseline forecast showed lower path for future CPI
Taiwan Central Bank policy statement noted it would maintain appropriately monetary policy and reiterated its view to maintain FX stability
Japan Cabinet Office (Govt) Monthly Economic Report for Jun raised overall economic assessment for the 1st raise since Dec. Economy was experiencing a moderate recovery (**Note: dropped a previous reference to delayed improvement in some areas). Raised its view of private consumption noting that it was picking up gradually
OPEC committee said to focus on rising oil production in Libya and Nigeria
Currencies
The USD was steady against the major European currencies in relatively quiet trading. -The NOK currency was the main focus after the Norway Central Bank removed its easing bias. Norges now saw the Deposit Rate at current level going forward. It had previously leaned towards more rate cuts if needed. EUR/NOK fell from 9.51 to test below 9.47 before consolidating
Fixed Income
Bund futures trade at 165.13 up 17 ticks, recovery after making the 164.79 low. Resistance lies near the 165.52 level, followed by 166.21. A break of the 163.89 support level could see lows target 162.05 followed by 160.30.
Gilt futures trade at 129.22 up 5 ticks with the focus on the DMO's £2.5B auction in 1.5% 2047 Gilts. Price is pulling back towards the middle of the June trading range. If price becomes bearish and drops below the noted 129.14 level, initial support lies at the 128.27 level, with key support at the 127.96 support level. An acceleration lower could test the 127.43 region. Resistance lies at the 129.80 level followed by 132.65.
Thursday's liquidity report showed Wednesday's excess liquidity fell to €1.6016T a decline of €0.8B from €1.6096T prior. Use of the marginal lending facility fell to €203M from €380M prior.
Corporate issuance saw over $11.45B come to market via 5 issues headlined by Reckitt Benckiser $7.75B 4-part senior unsecured note offering and EDP Finance $1.0B senior unsecured notes
Looking Ahead
(EU) EU Leaders begin 2-day Summit in Brussels
(UR) Ukraine May Industrial Production M/M: No est v -6.9% prior; Y/Y: -3.9%e v -6.1% prior
(PT) Portugal Apr Current Account: No est v €0.2B prior
(CO) Colombia May Industrial Confidence: No est v -8.5 prior; Retail Confidence: No est v 17.8 prior
05:30 (UK) DMO to sell £2.25B in 1.50% 2047 Gilts
05:30 (HU) Hungary Debt Agency (AKK) to sell Bonds (3 tranches)
05:30 (NO) Norway Central Bank (Norges) Gov Olsen post rate decision press conference
05:30 (IT) Italy Fin Min Padoan at seminar
06:00 (UK) Jun CBI Industrial Trends Total Orders: 7e v 9 prior, Selling Prices: 20e v 23 prior
06:00 (IE) Ireland May PPI M/M: No est v -0.7% prior; Y/Y: No est v 1.8% prior
06:00 (IL) Israel May Unemployment Rate: No est v 4.4% prior
06:00 (CZ) Czech Republic to sell Bills
06:45 (US) Daily Libor Fixing - 07:30 (BR) Brazil Central Bank (BCB) Quarterly Inflation Report
08:00 (PL) Poland Central Bank (NBP) Jun Minutes
08:15 (UK) Baltic Dry Bulk Index
08:30 (US) Initial Jobless Claims: 240Ke v 237K prior; Continuing Claims: 1.93Me v 1.935M prior
08:30 (CA) Canada Apr Retail Sales M/M: 0.3%e v 0.7% prior; Retail Sales Ex Auto M/M: +0.7%e v -0.2% prior
08:30 (US) Weekly USDA Net Export Sales
09:00 (RU) Russia Gold and Forex Reserve w/e Jun 16th: No est v $408.3B prior
09:00 (US) Apr FHFA House Price Index M/M: 0.5%e v 0.6% prior
09:30 (DE) German Fin Min Schaeuble on Stability Council meeting
10:00 (US) Fed's Powell (moderate, voter) in Senate banking committee
10:00 (EU) Euro Zone Jun Advance Consumer Confidence: -3.0e v -3.3 prior
10:00 (US) May Leading Index: 0.3%e v 0.3% prior
10:30 (US) Weekly EIA Natural Gas Inventories
11:00 (US) Jun Kansas City Fed Manufacturing Activity: 9e v 8 prior
11:00 (US) Treasury announcement on upcoming issuance (2-year, 5-year, 7-year duering week of Jun 26th)
11:00 (BR) Brazil to sell Fixed Rate 2023 and 2027 Bonds
11:00 (BR) Brazil to sell 2017, 2019 and 2020 LTN Bills
12:00 (CH) SNB's Maechler in Zurich
12:00 (UK) BOE's Forbes (hawk, outgoing) in London
13:00 (US) Treasury to sell $5B in 30-Year TIPS Reopening
14:00 (MX) Mexico Central Bank (Banxico) Interest Rate Decision: Expected to raise Overnight Rate by 25bps to 7.00%
15:00 (AR) Argentina May Trade Balance: -$0.1Be v -$0.1B prior
15:00 (CO) Colombia Apr Economic Activity Index (Monthly GDP) Y/Y: -0.3%e v -0.9% prior
Oil Steadies But For How Long?
- Traders continue to test the resolve of oil producers;
- May faces counterparts after humiliating election campaign;
- GBP remains volatile with BoE as polarised as British public.
We're seeing risk aversion in the markets once again on Thursday, with US futures currently slightly in the red, Gold adding to recent gains and the yen edging higher.
After falling into bear market territory – having fallen more than 20% from a recent peak – oil appears to have found some support on Thursday, buoyed by Wednesday's inventory data from EIA which reported a 2.451 million reduction in stocks. The number was roughly in line with that reported by API the day before but traders still appear a little unconvinced by these and tend to wait for the EIA release. While this has offered some near-term support, there's little reason at the moment to believe that oil isn't headed for further losses.
Traders appear to be testing the resolve of those countries that signed up to the production cut, having been clearly disappointed with the decision not to deepen the cuts on top of extending them by nine months. Oil is currently trading at seven month lows despite a commitment from a number of producers to bring the market back into balance. Ten of the last 11 inventory reports from EIA have been drawdowns and yet, traders appear unconvinced, with rising output in the US, Nigeria and Libya being touted as the reason behind this. Regardless of what's driving these moves, the real question is how much more producers will stomach before they consider deepening the cuts?
As has been the case for a number of weeks now, the UK will once again be in focus today as Theresa May faces her EU counterparts for the first time since the election at a summit Brussels. May will be seeking to put the humiliating experience behind her and instead focus on achieving a good deal for the UK but the reality is, her hand has been weakened and her counterparts will be fully aware. May is expected to outline plans for citizens' rights following the divorce, something that has already been a contentious issue and one that everyone wants to resolve quickly. Still, both sides are at odds on the details of how it will be achieved and how this is handled could offer some clues into how the rest of the talks will go.
The pound has not been lacking in catalysts recent, with the Bank of England being the latest to chip in. The vote on interest rates last week saw three policy makers favour a hike – including outgoing Kristin Forbes – a scenario that Governor Mark Carney later played down, only for his colleague Andy Haldane – who voted to leave rates unchanged last week - to take the opposite view. It would appear the BoE is as polarised as the rest of the country at the moment, which should complicate matters further in the months ahead and make it increasingly difficult to anticipate what they will do.
We have another quiet session on the cards, with US jobless claims and Canadian retail sales the only notable releases. We'll also hear from the Fed's Jerome Powell, who will testify before the Senate Banking Committee, as well as the BoE's Kristin Forbes who, as mentioned earlier, will leave the BoE later this month.
Euro Ticks Lower, US Jobless Claims Next
The euro is having a quiet week, and has inched higher in the Thursday session. Currently, EUR/USD is trading at 1.1160. On the release front, there are no major events in the eurozone. The US will release unemployment claims, which is expected to rise to 241 thousand. On Friday, Germany and the eurozone release manufacturing PMIs, and the US will publish Home Sales.
Germany's economy, the largest in the euro-area has been thriving. Growing global demand for German products has boosted the export and manufacturing sectors. There were jitters in political and business circles when Donald Trump was elected, as Trump campaigned on a protectionist, “America first' agenda. However, these concerns have diminished, as the economy has performed well and Trump has been in damage control mode, as he focuses on domestic scandals. Earlier this week, the well-respected German BDI Federation of Industry added its voice to the chorus of accolades for the German economy. The BDI said that Germany's economic output would increase by 1.5% this year. However, the BDI counseled caution, noting that the economy had been buoyed by a weaker euro, lower oil prices and the ECB's accommodative monetary policy. All three are ‘external factors', in the sense that Germany has limited influence on them, and a significant change in any one factor could weigh on economic growth.
At last week's policy meeting, the Federal Reserve said it would reduce its balance sheet in the near future. The balance sheet has ballooned to $4.5 trillion, which accumulated after the 2008 financial crisis, when the Fed went on a bond-buying spree to stimulate the economy. The reduction will be gradual, but still marks an important change in direction for the central bank. It's not clear when the Fed will start to trim, but FOMC member Patrick Harker said on Wednesday that no decision had been made. Harker said that he was in favor of the reduction commencing in September. The Fed has hinted at one more rate hike in the second half of 2017, and the markets have circled December as the most likely date for a rate move. The CME Group has pegged the odds of a September hike at just 13%, compared to 18% a week ago. However, the odds for a December increase are at 49%, and this could increase if Fed policymakers continue to wax positive about the economy.
BoE’s Haldane Pushes Sterling Back Up
The British pound rebounded yesterday, after BoE's chief economist Andy Haldane said that he favors a partial withdrawal of the stimulus the BoE introduced in August 2016. He added that if data come in broadly as expected in the period ahead, policy tightening is likely to be needed well ahead of current market expectations. The key message we got was that he could support a rate hike at one of the upcoming policy meetings.
These comments come in contrast with Governor Carney's remarks on Tuesday that now is not the time to raise rates. This highlights the difference in views among the MPC and suggests that the Committee may be somewhat divided. What we would like to focus on though, is the common ground between these two officials. Both noted that anemic wage growth is the biggest argument against raising rates. As such, we think that moving forward, the main determinant of whether we will see a BoE rate hike may be wage and inflation data. We believe that a material pickup in domestic inflationary pressures, particularly wages, is needed before the Bank decides to act.
EUR/GBP traded lower on Haldane's hawkish remarks. The pair hit resistance at 0.8840 (R1) and slid to find support at 0.8775 (S1), before rebounding again. The rate continues to trade above the short-term uptrend line taken from the low of the 10th of May and thus, we consider the near-term outlook of the pair to still be positive. We expect the bulls to aim for another test near 0.8840 (R1) soon, where a break could aim for the next resistance of 0.8870 (R2). A decisive move above the latter hurdle would confirm a forthcoming higher high and perhaps open the way for the 0.8945 (R3) territory.
RBNZ stands pat, disappoints Kiwi shorts
Overnight, the RBNZ kept its policy unchanged, as was widely expected. The tone of the meeting statement was relatively optimistic on the economy, dismissing soft GDP growth in Q1 as being transitory and indicating that the growth outlook remains positive. With regards to the Kiwi dollar, the Bank noted that it has gained around 3% in trade weighted terms since May, and that a lower NZD would help rebalance the growth outlook.
What we found most striking, was how soft the Bank's language on the currency's strength was, given that the last time NZD was trading at similar levels, officials noted that “a decline in the exchange rate is needed”. We think market participants may have been looking for much stronger hints that the RBNZ wants a weaker Kiwi. In the absence of such signals, NZD gained on the decision. Looking ahead, we think that the outlook of the currency is neutral overall, with the next major indicator that could cause it to assume a direction being CPI data for Q2, due out in mid-July. That said, we also believe that further upside in NZD may be relatively limited, as a sustained rally could cause the RBNZ to become once again more vocal about wanting a weaker currency.
NZD/USD traded higher on the less-concerned-than-expected RBNZ. The pair rebounded after it hit support at the lower bound of the short-term triangle it has been trading within since the 6th of June. Nevertheless, the advance was stopped by the upper bound of the formation. Therefore, we would maintain our flat stance for now. That said, we still see the likelihood for the pair to turn down at some point in the not-too-distant future. We base our view on the fact that the pair has turned sideways after it hit resistance at the downside resistance line drawn from the peak of the 8th of November, while our daily momentum indicators have topped near extreme positive levels.
As for the rest of today's highlights:
During the European day, the Norges Bank will announce its rate decision and the forecast is for no change in policy. At its latest gathering, the Bank essentially noted that the outlook had not changed much since its March assessment, when it indicated there is a slightly higher probability of a rate cut rather than a rate hike. Ever since, developments have been slightly optimistic, on balance. On the bright side, GDP and the unemployment rate were better than the NB's own forecasts. On the downside, the core CPI rate declined by more than the Bank anticipated. Having said that though, the recent decline in NOK argues in favor of higher inflation, so the NB could incorporate into its forecasts a higher inflation path. In this case, we could get a more optimistic tone, considering that the slowdown in inflation is the only dark spot in Norway's economic picture at the moment. Such a tone could support NOK.
As for the economic indicators, we get Eurozone's preliminary consumer confidence index for June, and Canada's retail sales for April. In the US, initial jobless claims for the week that ended June 16th are due out.
We have only one speaker on the agenda: Fed Board Governor Jerome Powell will testify before the Senate Banking Committee. Given that the FOMC appears to be divided in two camps too (optimistic and cautious), it will be interesting to see where Powell stands.
EUR/GBP
Support: 0.8775 (S1), 0.8715 (S2), 0.8640 (S3)
Resistance: 0.8840 (R1), 0.8870 (R2), 0.8945 (R3)
NZD/USD
Support: 0.7215 (S1), 0.7180 (S2), 0.7150 (S3)
Resistance: 0.7270 (R1), 0.7300 (R2), 0.7320 (R3)
EURAUD Records One-Week High, Short-Term Bias Looks Neutral
EURAUD has posted gains in the previous two days after the significant decline it recorded since the beginning of June that threw the pair from the one-year high of 1.5226 to as low as 1.4626. In today’s trading the pair touched a one-week high of 1.4803 and currently trades close to the day’s open.
The RSI is currently hinting to a neutral short-term picture. The indicator recorded a rise in recent days but is flat at the moment and close to the 50 neutral-perceived level at 47.
The 23.6% Fibonacci retracement level (February 22 – June 1 upleg) at 1.4848 might constitute an important resistance mark. This level held significance in the recent past as well. Above this, the 1.49 handle could act a psychological barrier to upside movements in price.
If the price moves down, the 50-day moving average (MA) at 1.4743 could provide intra-day support. It should be noted that this point was briefly violated today. Further down, the 38.2% Fibonacci mark at 1.4613 might offer additional support.
Turning to the medium-term outlook, it remains bullish, albeit the fall since the start of June has been tilting it towards neutrality. The pair also recorded a bullish (golden) cross in mid-May when the 50-day MA moved above the 200-day MA. The price currently exceeds both MAs.
Daily Technical Analysis: EUR/GBP Positive Momentum Above 0.8833
The EUR/GBP has recently made a u-turn after the V shaped reversal formed and pushed the price from the D L4 support. At this point the POC zone is 0.8790-0.8805 (D L3, EMA89, ATR pivot, 50.0, W H3, historical buyers) and if the price gets into the zone again, we might see another push to the upside targeting 0.8833. If the price manages to stay above the inner trend line at 0.8820, I expect D H3 retest -0.8833 and hourly close above D H3 should give another positive impulse to the pair that with targets at 0.8853 and 0.8885.