Sample Category Title
USD/CHF Short-Term Bearish Pressures, USD/CAD Short-Squeeze, AUD/USD Testing Support Area Around 0.7500.
USD/CHF Short-term bearish pressures.
USD/CHF is pushing lower. Hourly resistance can be found at given at 0.9771 (09/06/2017 high). Strong resistance is given at 1.0107 (10/04/2017 high). Expected to show continued short-term bullish pressures.
In the long-term, the pair is still trading in range since 2011 despite some turmoil when the SNB unpegged the CHF. Key support can be found 0.8986 (30/01/2015 low). The technical structure favours nonetheless a long term bullish bias since the unpeg in January 2015.
USD/CAD Short-squeeze.
USD/CAD is now consolidating after the strong decline. Hourly support lies at 1.3165 (14/06/2017 high). Expected to show renewed weakness towards support given at 1.3010 (16/02/2017 low)
In the longer term, the pair lies in a bullish channel since a year. Strong resistance is given at 1.4690 (22/01/2016 high). Long-term support can be found at 1.2461 (16/03/2015 low).
AUD/USD Testing support area around 0.7500.
AUD/USD is consolidating lower after the continued increase since the start of May. The technical structure is clearly negative and the pair should show continued bearish pressures towards support given at 0.7520 (09/06/2017 low)
In the long-term, we are waiting for further signs that the current downtrend is ending. Key supports stand at 0.6009 (31/10/2008 low) . A break of the key resistance at 0.8295 (15/01/2015 high) is needed to invalidate our long-term bearish view.
EUR/USD Sideways Price Action, GBP/USD No Real Buying Pressures, USD/JPY Bearish Consolidation Before Testing Again Resistance At 112.13.
EUR/USD Sideways price action.
EUR/USD is trading lower. The pair is still trading below strong resistance given at 1.1300 (09/11/2017 high). Hourly support can be found at 1.1076 (18/05/2017 low). Stronger support lies at 1.0842 (11/05/2017 low). Expected to show further weakness.
In the longer term, the momentum is clearly negative. We favour a continued bearish bias towards parity. Key resistance holds at 1.1714 (24/08/2015 high) while strong support lies at 1.0341 (03/01/2017 low).
GBP/USD No real buying pressures.
GBP/USD has bounced back above broken hourly support given at 1.2636 (09/06/2017 low). Hourly resistance lies at 1.2818 (14/06/2017 high). The road is wide-open for further decline.
The long-term technical pattern is even more negative since the Brexit vote has paved the way for further decline. Long-term support given at 1.0520 (01/03/85) represents a decent target. Long-term resistance is given at 1.5018 (24/06/2015) and would indicate a long-term reversal in the negative trend. Yet, it is very unlikely at the moment.
USD/JPY Bearish consolidation before testing again resistance at 112.13.
USD/JPY has failed to monitor resistance given at 112.13 (24/05/2017 high). Hourly support can be found at 108.89 (14/06/2017 high). Stronger support is located at 108.13 (17/04/2017 low).
We favor a long-term bearish bias. Support is now given at 96.57 (10/08/2013 low). A gradual rise towards the major resistance at 135.15 (01/02/2002 high) seems absolutely unlikely. Expected to decline further support at 93.79 (13/06/2013 low).
Technical Outlook: USDCAD – 200SMA Capped Recovery, Bearish Techs Keep Risk At The Downside
Strong two-day recovery from 1.3190 was capped by 200SMA at 1.3340 zone on Wednesday and the pair eased to 1.3300 on Thursday after repeated rejection at 200 SMA barrier.
Limited correction of 1.3538/1.3164 bear-leg, which is part of broader downtrend from 1.3792 (05 May peak) is expected as technical studies remain in bearish setup on daily chart.
In addition, slow stochastic is approaching overbought territory and daily Tenkan-sen resumed steep descend after being in sideways mode in past few days.
Strong bearish pressure is maintained by 10/200SMA death cross and multiple bear-crosses that formed above.
Close below falling 10SMA (1.3287) is needed to signal reversal and lower top at 1.3340, with extension below 1.3250 (Fibo 61.8% of 1.3190/1.3340 recovery leg) to confirm.
Initial target lies at 1.3190 (19 June trough) ahead of 1.3164 (14 June low), break of which would expose psychological 1.3000 support and 1.2968 (2017 low).
Res: 1.3340, 1.3351, 1.3383, 1.3395
Sup: 1.3287, 1.3250, 1.3200, 1.3190
Technical Outlook: AUDUSD – Pullback Pressures Key Supports Provide By Daily Cloud Top And 200SMA
The Aussie pressures strong support at 0.7539 (daily cloud top) following three days in red after repeated upside rejections above 0.7600.
Strong bearish signals have been generated on close below 10/100SMA's that keeps negative near-term outlook.
Dips should be ideally contained above strong support zone between 0.7539 and 0.7527 (daily cloud base / Fibo 38.2% of 0.7369/0.7635 upleg / 200SMA) to keep in play broader bulls which are underpinned by 20/55 and 30/55SMA bull-crosses.
Conversely, bearish extension below 0.7539 /27 pivots would confirm reversal from 0.7630 zone tops and risk further retracement of 0.7369/0.7635 rally.
Res: 0.7555, 0.7574, 0.7600, 0.7630
Sup: 0.7539, 0.7527, 0.7516, 0.7492
Technical Outlook: USDJPY – Mixed Outlook Between 110.65 And 111.80 Pivots
The pair remains at the back foot on Thursday and probed below 111.00 handle (55SMA) on extension of pullback from 111.80 zone after repeated rejection at daily cloud base.
Thin cloud which twists next week may attract for fresh attack. Plethora of daily MA's continues to underpin and supports scenario.
Strong supports at 110.85 (200SMA) and 110.65 (10/20SMA bull-cross/Fibo 38.2% of 108.80/111.78) are expected to hold for fresh upside attempts.
On the other side, slow stochastic is reversing from overbought territory on daily chart and warns of deeper pullback.
Firm break below 110.65 will neutralize expectations of fresh bullish action and expose supports at 110.29/109.94 (Fibo 50% and 61.8% retracement of 108.80/111.78 rally respectively).
Res: 111.42, 111.78, 112.24, 112.05
Sup: 111.00, 110.85, 110.65, 110.29
EUR/GBP Elliott Wave Analysis
EUR/GBP – 0.8823
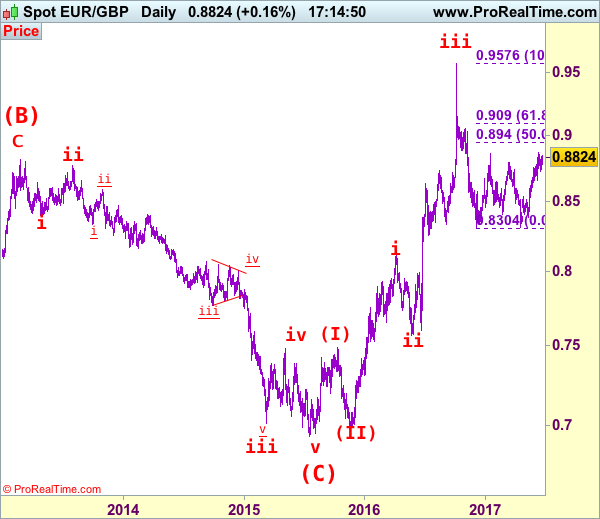
EUR/GBP – The major (A)(B)(C)-(X)-(A)(B)(C) correction from 0.9805 is unfolding and 2nd (A) has possibly ended at 0.6936.
As the single currency has maintained a firm undertone after recent upmove, suggesting the erratic rise from 0.8304 low is still in progress and above resistance at 0.8866 would extend gain to 0.8900, then towards 0.8940-50 (50% Fibonacci retracement of 0.9576-0.8304), however, loss of upward momentum should prevent sharp move beyond 0.9000 psychological level and price should falter below 0.9090-00 (61.8% Fibonacci retracement) and bring retreat later.
Our latest preferred count is that the wave V of a 5-wave series from 0.5682 ended at 0.9805 earlier and major from there has possibly ended at 0.8067 as A-B-C-X-A-B-C. We are keeping our view that the entire correction from 0.9805 has possibly ended at 0.7756 and as labeled as the attached daily chart and impulsive move from 0.9084 has ended at 0.7756 as a 5-waver which marked either the (C) wave or the A leg of (C), a daily close above resistance at 0.8831 would suggest (C) leg has ended and headway towards 0.9084.
On the downside, whilst initial pullback to 0.8735-40 cannot be rule out, reckon 0.8680-90 would limit downside and bring another rise later. A daily close below support at 0.8652 would suggest top is possibly formed and risk weakness towards 0.8600-05 but reckon downside would be limited to 0.8550 and previous support at 0.8524 should hold from here, bring rebound later.
Recommendation: Buy at 0.8680 for 0.8880 with stop below 0.8580
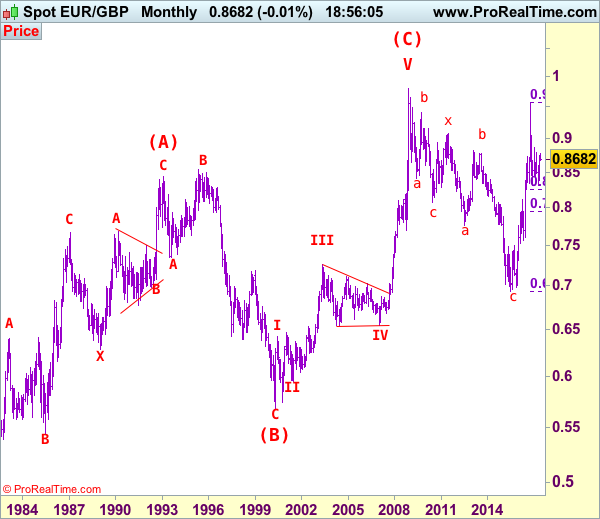
Euro's long term uptrend started in Feb 1981 at 0.5039 and is unfolding as a (A)-(B)-(C) move with (A): 0.8433 (Feb 1993), (B): 0.5682 (May 2000) and impulsive wave (C) should have ended at 0.9805 with wave III ended at 0.7254 (May 2003), triangle wave IV at 0.6536 (23 Jan 2007) and wave V as well as wave (C) has ended at 0.9805.
We are keeping an alternate count that only wave III ended at 0.9805 and the correction from there is the wave IV and may extend weakness to 0.7700, however, it is necessary to see a daily close above resistance at 0.9143 would change this to be the preferred count.
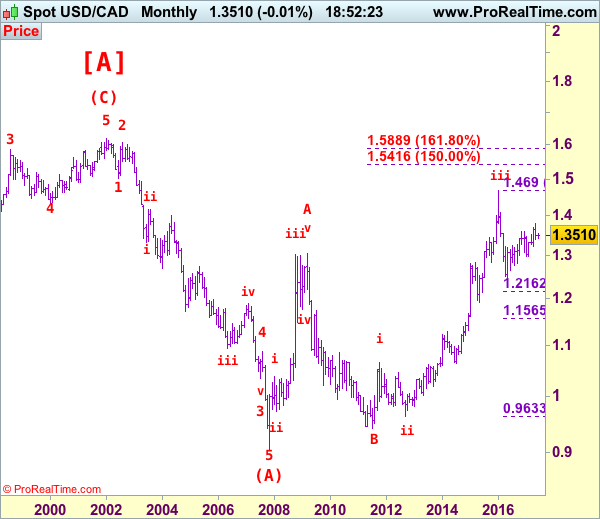
USD/CAD Elliott Wave Analysis
USD/CAD – 1.3317
USD/CAD – Wave v ended at 0.9407 and a-b-c correction may extend gain to 1.4700
Despite last week’s anticipated decline to 1.3165, the subsequent rebound suggests 1-2 weeks of consolidation above this level would be seen and recovery to 1.3387 (previous support) cannot be ruled out, however, reckon upside would be limited to 1.3470-75 and price should falter below resistance at 1.3547, bring another decline later. Below 1.3260-65 would bring test of 1.3190-95 but break there is needed to signal the rebound from 1.3165 has ended, bring retest of this level. A drop below there would add credence to our view that top has been formed at 1.3794, bring further weakness to 1.3150 and then 1.3100, however, oversold condition should limit downside and reckon previous support at 1.3056 would hold, price should stay above psychological support at 1.3000.
We are keeping our view that the wave b from 1.0657 (a leg top) has possibly ended at 0.9633 with (a): 0.9800, wave (b): 1.0447 and wave c at 0.9633, the subsequent rise from there is now treated as wave c exceeded indicated upside target at 1.3770-80 and 1.4000 and wave (3) has possibly ended at 1.4690 and wave (4) correction has commenced for retracement back to 1.2832 support, then 1.2410-20.
On the daily chart, our latest preferred count remains that the A of (B) rally from 0.9059 low (7 Nov 2007) unfolded into an impulsive wave with i: 0.9059-1.0380, ii ended at 0.9819, iii at 1.3019 followed by triangle wave iv at 1.2026 , then wave v formed a top at 1.3066 and also ended the wave A. The wave B is unfolding as an double three a-b-c-x-a-b-c and is sub-divided as a: 1.2192, b: 1.2716 and wave c at 1.0784, followed by wave x at 1.1725, another set of a-b-c unfolded with 2nd a at 0.9931, 2nd b at 1.0674. the 2nd c has possibly ended at 0.9407, therefore, consolidation with upside bias is seen for major correction, indicated target at 1.3900 had been met and gain to 1.4700 would follow.
On the upside, whilst initial recovery to 1.3350 cannot be ruled out, reckon upside would be limited to previous support at 1.3387 (now resistance) and bring another decline later. A daily close above 1.3387 would suggest low is possibly formed, bring a stronger rebound to 1.3425-30, break there would add credence to this view, then further gain to 1.3490-00 would follow but resistance at 1.3547 should remain intact.
Recommendation: Stand aside for this week.

Longer term - The selloff from 1.6194 (21 Jan 2002) to 0.9059 (07 Nov 2007) is viewed as (A) wave which is a 5-waver as labeled on the monthly chart as below, the subsequently rally is labeled as (B) with impulsive A leg of (B) ended at 1.3066, wave B of (B) is unfolding which has either ended at 0.9407 or would extend one more fall but downside should be limited to 0.9200 and 0.9000 should hold.
Swiss Trade Data Jumps, Oil Sell-Off Continues
Switzerland's trade activity picked up in May
After the usual March-April contraction, Switzerland's trade surplus bounced back in May amid a sharp recovery in exports. The trade surplus rose to CHF 3.4 billion in May from CHF 1.96 a month earlier. Exports - in real terms - increased 2.9% m/m while imports eased to 2% m/m.
Exports to China passed the CHF 1bn threshold to print at 1.16bn while imports reached 1.02bn, leaving a trade surplus of CHF 139 million. Trade activity with the European Union also accelerated substantially with exports and imports rising 1.47bn and 2.12bn respectively, adding evidence that the European economy is on the right track.
It was quite a pleasant surprise for the Swiss watch industry as exports rose 9% last month compared to a contraction of 5.7% in the previous month. The sharp recovery was mostly driven by a surge in exports to Hong Kong, China and Italy, while Gulf countries reduced sharply their imports amid falling oil revenue and geopolitical uncertainties.
All in all, the report showed that the Swiss economy is still right on track but continues to suffer from the strong CHF. The recovery pace is solid especially given the slower than expected recovery in Europe and the United States. Swiss companies already optimised their functioning and no more gains can be expected on this side. Investments have been reduced to the minimum, costs have been cut. Economic improvement of Switzerland's main trading partner is more necessary to see a substantial growth acceleration.
Load up on EM risk
Time to make hay while the sun is shining. We are highly constructive on EM FX risk given the current environment. The summer doldrums have hit but conditions are ideal for carry trading. EM economic outlook remains positive, spearheaded by improving trade data (US and EU economic momentum is more balanced). While in the G10 a soft inflation backdrop will keep monetary policy supportive, driving yields seekers in to EM, finally political noise such as President Trump's pro-growth agenda and rising protections threat has subsided.
Idiosyncratic domestic risks in Romania, Venezuela and Brazil to name a few have shown no hint of sparking broader contagion. We are focused on the growth differentials rather than just interest rates differential for FX carry selection. Depreciation of oil prices and negative price outlook has us avoiding crude-linked currencies like RUB, COP and MXN. In addition we have shifted away from USD as the primary funding currency due to the expectation of higher rates and political uncertainty driving rogue volatility, preferring JPY, CHF and even CAD due to bearish outlook for oil.
Looking forward there is scant scheduled events in July and August that could likely derail the EM carry trade. Political developments in UK-EU Brexit discussions are likely to slow while there are not enough US data points to decisively determine a recovery in 2H and firm repricing of the Fed interest rate path. Time to load up on EM carry risk.
Probability of November BoE hike increases
We continue to suspect that markets are underpricing the probability of a BoE policy adjustment. We suspect that as with the Fed, the threshold of removal of emergency measures is significantly lower than standard interest rate hikes. While interest rates in the UK never went negative, it's difficult for MPC members to justify ultra-easy policy given the economic momentum. BoE Governor Carney's Mansion House speech dented our expectations of a 2017 rate hike.
However, BoE chief economist Haldanes indicated that marginal data would suggest hikes in 2H (most likely November). This is not the first time Haldane's view diverged from the MPC, but it will put the markets on alert for shifts in doves Broadbent and Vlieghe and improving data. Markets are now pricing in 12bp of hikes by end of 2017. To materialise our constructive GBP view, we see long GBPCHF as the ideal position.
Oil prices continue to slide; back below $40 within a few weeks?
Since May 23, oil has been in short-term decline. Crude oil is now testing its 1-year low mark around $42. We believe that the decline is set to continue. Since the Qatar diplomatic issue, there are growing concerns that other OPEC members will not respect the production cut and therefore oversupply.
Will the decline continue? When looking specifically to Saudi Arabia, the largest oil exporter in the world, we may believe this bearish trend should continue. The Arabic country really needs to have higher oil prices. Fundamentally speaking, its FX reserves have declined 27% from its 2014 peak. Just in 2017, it has diminished by $36 billion.
Current oil prices seem way too low for Saudi Arabia, which is in return obliged to liquidate its FX reserves to assume its running costs. On top of that, Saudi Arabia is willing to let investors buy 5% of its oil reserves. Yet, at the current oil price, this seems like a deal for bullish buyers. In our view, that means Saudi Arabia is concerned about future oil prices. In addition, the US shale gas industry is booming back and is putting deeper downside pressures on oil. We believe that the oil price should go back below $40 within the next few weeks.
Crude Oil Inventories Drop For Second Straight Week
'US crude and gasoline stockpiles are significantly higher compared with their five-year averages, which will weigh on prices.' — Abhishek Kumar, Energy's Global Gas Analytics
US oil inventories fell for the second consecutive time last week, official data showed on Wednesday. As reported by the Energy Information Administration, the number of barrels of crude oil dropped 2.5M in the week ended June 16, compared to the preceding week's decline of 1.7M barrels, while analysts predicted a much lower drop of 1.2M barrels. US crude oil production climbed to 9.35M barrels per day, 20K higher than in the prior week, the EIA reported. Gasoline stockpiles plunged 578K, whereas analysts anticipated a gain of 444K barrels. In the meantime, distillate stocks advanced 1.1M barrels, surpassing expectations for a 465K-barrel increase. US refinery runs fell 104K bpd as the utilisation rate dropped 0.4% to 94%. The number of barrels of crude oil held in storage at the Cushing, Oklahoma, plunged 1.08M barrels during the reported week. Oil prices rose shortly after the report was published but failed to sustain those gains. Thus, soon after the release, West Texas Intermediate futures fell to $43.41 per barrel, whereas Brent futures declined to $45.79 per barrel.

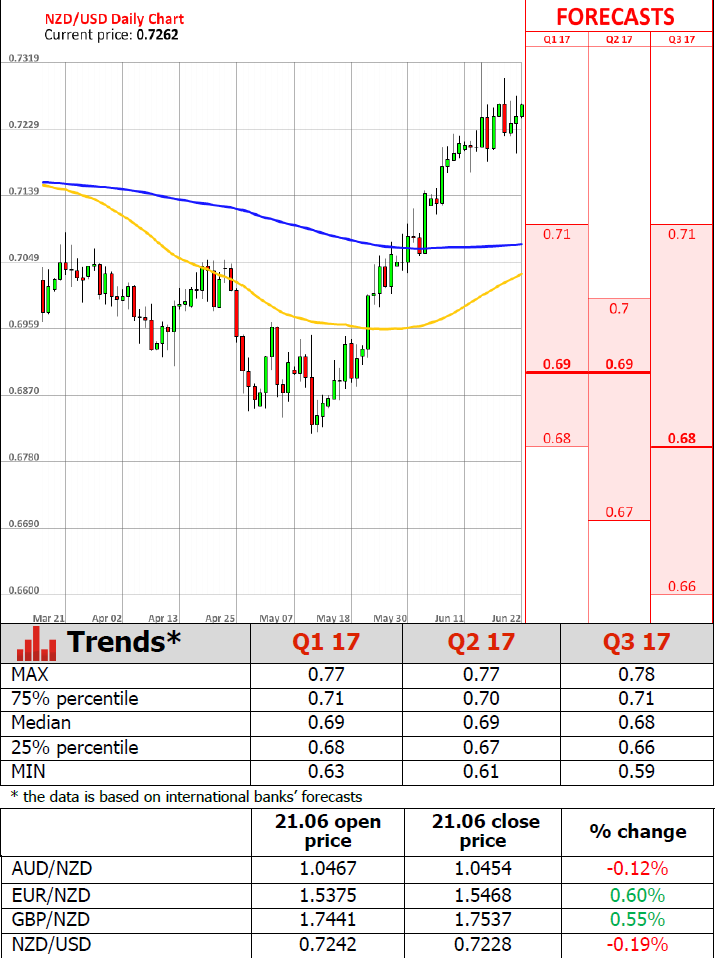
Reserve Bank Of New Zealand Remains On Hold
'It appears that the bank isn't too perturbed by the rally in the currency given that export prices have also risen.' — Zoe Wallis, Kiwibank
The Reserve Bank of New Zealand held its policy and interest rates unchanged at its meeting on Thursday, stating it would unlikely change its stance in the near future. Policymakers voted to leave the benchmark rate at a record low of 1.75% and keep the Bank's monetary policy accommodative for 'a considerable period' amid high uncertainties. According to the RBNZ, interest rates are set to remain unchanged until late 2019 despite the fact that inflation returned to its 1-3% target range. Even though inflation hit 2.2% in the three-month period to March, policymakers said that the following inflation pickup was triggered by temporary factors. However, the Bank suggested that pay and non-tradables inflation would likely improve in the upcoming months. The RBNZ Governor Graeme Wheeler said that the Kiwi's recent gains were driven mainly by higher export prices. Nevertheless, the Governor noted that the weaker New Zealand Dollar would help to rebalance the growth outlook towards the tradable sector. Despite the weak March quarter performance, the Bank expressed optimism over the economic outlook for New Zealand.