Sample Category Title
USD/JPY Analysis: Continues To Edge Lower
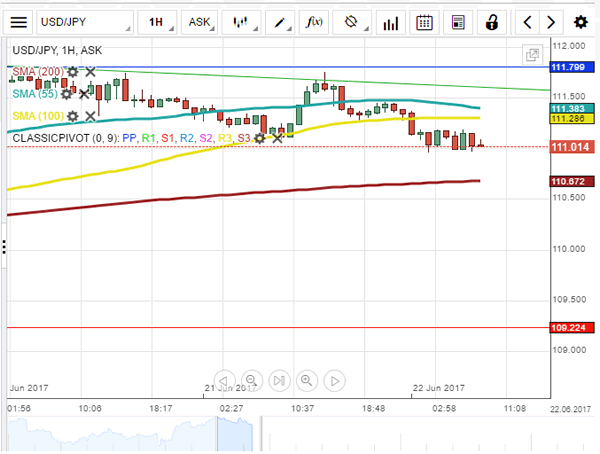
The USD/JPY pair's attempts to recover were limited by the descending channel's resistance line. The exchange rate bounced back from this down-trend and is now expected to keep moving lower. The channel's lower boundary is located only near 108.00, meaning that the Greenback has a lot of room to keep declining. Furthermore, the monthly S1 at 109.22 is a strong support, which could prevent the given pair from falling deeper down. Technical indicators, however, are unable to confirm the possibility of the negative outcome today, as they are giving mixed signals in all timeframes. No significant drops are likely to occur by the end of the week, as there are no scheduled fundamental events that could have such a bearish impact on the US Dollar. Price is expected to close near 110.65 today.
Gold Analysis: Trades Above 1,250 Mark
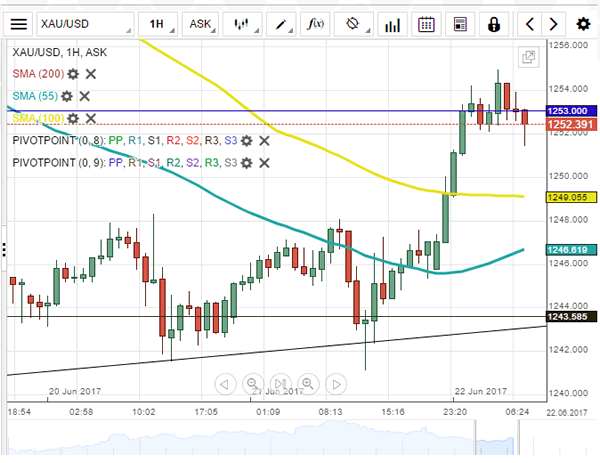
On Thursday morning the yellow metal traded above the monthly pivot point, which is located at the 1,253 mark. The bullion managed to surge during the early hours of June 22 due to the fundamental events in the US. Due to the fact that the commodity price was located above the notable level of significance, it can be expected that the surge of the metal's price will continue. The next level of resistance, that gold faces it the 200-hour SMA, which during the early hours of the day's trading was located at the 1,257.20 mark. However, it could be observed that the pivot point was not clearly left behind, as the yellow metal's price had fluctuated in limbo around it for six consecutive hours.
Technical Outlook: EURUSD – Lift Above 10/20SMA’s Needed For Stronger Bullish Signal
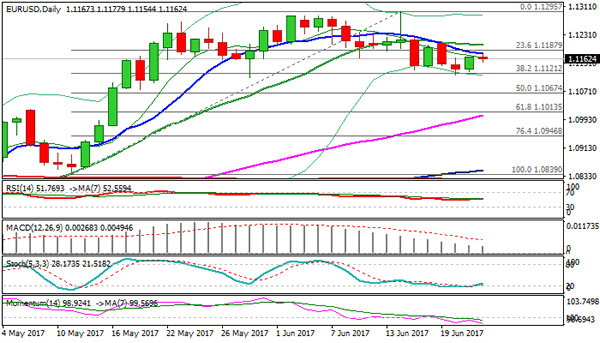
The Euro ticked higher in Asia and posted new high at 1.1177 where gains were so far capped by falling 10SMA, but near-term outlook remains positive following strong rally on Wednesday. Bounce from correction low at 1.1118, generates initial signal of base formation. Broader bull-trend remains intact and supports scenario of further upside which needs to clear strong barriers provided by 10SMA (1.1177) and 20SMA (1.1201) to confirm reversal and higher low at 1.1118. Slow stochastic is reversing from oversold territory on daily chart and supports the notion. Meantime, dips should hold above 1.1152 (hourly Kijun-sen) to keep bullish near-term structure intact. Alternatively, return below thick hourly cloud (cloud base lies at 1.1140) would generate bearish signal and re-expose downside pivots at 1.1121/09.
Res: 1.1165, 1.1177, 1.1201, 1.1228
Sup: 1.1152, 1.1140, 1.1121, 1.1109
NZDUSD In Consolidation Phase, Recent Uptrend Remains In Place
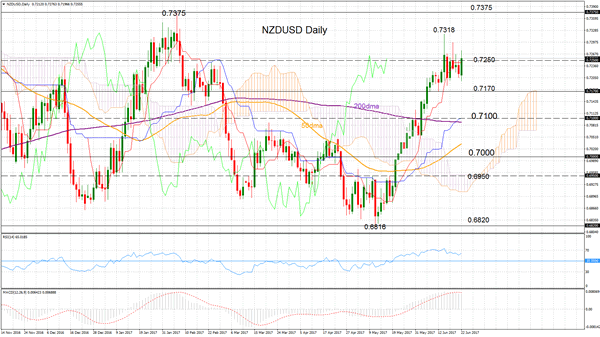
NZDUSD maintains the uptrend that started from the May 11 low of 0.6816 to the June 14 high of 0.7318. The bias turned bullish after prices rose above the 200-day moving average at the key psychological level of 0.7100 in early June.
However, after RSI reached overbought levels above 70, the oscillator slipped back down and NZDUSD is now consolidating just above the 0.7200 handle since peaking at 0.7318.
A decline in prices would find support at 0.7170 before approaching the key 0.7100 level. From here, the next big figure at 0.7000 comes into view. Breaking below 0.6950 (an important resistance level in May), would negate the current short-term bullish bias and would open the way for a deeper decline towards 0.6816 (May 11 low).
A bounce in prices from current levels would see a re-test of 0.7318 with scope to resume the uptrend towards 0.7375 (February high). The market would need to remain above 0.7100 in order to maintain upside momentum.
The short-term trend is neutral, as a consolidation phase is expected. But the uptrend from 0.6816 still remains intact. Technical indicators are supporting a bullish picture, with the positive alignment of the tenkan-sen and kijun-sen lines as well as RSI and MACD in bullish territory. The market is above the 200-day moving average and above the Ichimoku cloud.
Looking at the bigger picture, the trend is neutral, as NZDUSD has been trading between 0.6820 and 0.7375 for the past six months since December 2016.
Kiwi Lifted By Positive RBNZ Growth Outlook, Oil Prices Deteriorate On Supply Glut Concerns
The New Zealand dollar jumped after the Reserve Bank of New Zealand said the country’s growth outlook remained positive. Sterling held onto gains after the Bank of England’s Andrew Haldane’s hawkish comments. Oil prices hovered near 10-month lows on over-supply concerns.
The RBNZ held a policy meeting today and announced its decision to keep its benchmark interest rate at record lows of 1.75%. The central bank maintained its neutral policy stance and had an overall positive tone and indicated it was confident that it has the right policy stance to fulfill its mandate. This was supportive for the kiwi, which rose against the greenback to as high as $0.7276 in early Asian session trading before steadying around $0.7255.
The British pound was one of the top performing major currencies yesterday after the BoE’s policy member and chief economist Andrew Haldane made comments that contrasted the Bank’s Governor, Mark Carney’s dovishness. Haldane said the risks of leaving policy tightening too late are rising. This boosted sterling to rise above the key $1.2700 level on Wednesday, before steadying to trade around $1.2670.
The greenback fell against the yen for a third straight day. After briefly dropping to 110.94 in Asia today, the pair traded to around 111.15 yen. The narrowing yield differential between US and Japanese bond yields and falling oil prices are weighing on the US currency. The dollar index was down to last trade at 97.49, moving off a 1-month high of 97.87 hit on Tuesday.
Oil prices wallow in a bear market on concerns that the recent OPEC deal to cut production has not been effective in dealing with the supply glut. WTI oil fell by over $1.00 to touch a low of $42.05 a barrel on Wednesday while Brent crude entered a bear market as well yesterday after falling below $45 a barrel for the first time since November. Both benchmarks consolidated losses in Asia today.
Gold benefitted from a weaker dollar and rose to as high as $1254.65 an ounce, moving off a 5-week low of $1240.79 touched yesterday.
Looking ahead to the rest of the day, a speech by FOMC member Jerome Powell would be important to watch. In terms of economic data, US jobless claims and Canadian retail sales will be released during the US session. Ahead of these reports, the CBI industrial order expectations are due out of the UK.
RBNZ Maintains Accommodative Stance, Kiwi Jumps
As widely expected the Reserve Bank of New Zealand decided to maintain its accommodative stance by keeping its benchmark interest rate at record low levels, adding that it would continue doing so for a “considerable period”.
Specifically, the central bank's official cash rate was held at 1.75%. It has been at this level since November 2016, the last time the Bank engaged in a quarter percentage point rate cut.
The RBNZ Governor Graeme Wheeler said that “policy may need to adjust accordingly” as “numerous uncertainties” remain in place. He added that the recent appreciation in the New Zealand dollar was partially attributed to higher export prices and that a weaker currency would help rebalance growth.
Economic growth standing at the weak 0.4% quarter-on-quarter in the first quarter of the year was seen as transitory by the central bank, which expressed the view that prospects for the economy were “positive” due to, among others, low interest rates, strong population growth and changes in the country's Budget that would enhance family income and infrastructure spending.
Forex market participants reacted positively to the news, pushing the New Zealand dollar to the highest level it has reached so far during the day at $0.7276. Before the news, kiwi/dollar was trading at 0.7215. In morning European trading hours, the New Zealand dollar was up six-tenths of a percent relative to its US counterpart, with kiwi/dollar at 0.7255.
Analysts expect the RBNZ to keep rates at their current level for at least the remainder of the year.
Technical Outlook: WTI Oil – Strong Bearish Sentiment Offsets Positive Signals
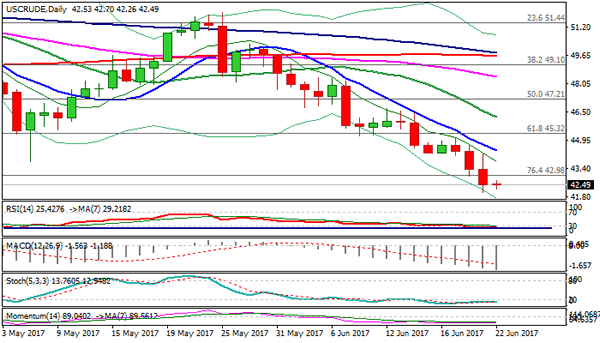
WTI oil is consolidating above fresh multi-month low at $42.04, (the lowest since Aug 2016) posted on Wednesday. The price remains firmly in red, following limited upside overnight that was capped at $42.70. Strong bearish pressure on global oversupply fears offset the impact of better than expected US Crude Stocks data, released on Wednesday, which showed crude inventories falling more than expected (2.5 million barrels draw vs forecast for 1.2 million barrels draw). Oil price met its target at $42.19 (14 Nov 2016 low) and focus is turning towards $41.09 (11 Aug 2016 low) and $40.63 (50% retracement of larger $26.04/$55.22, Feb 2016/Jan 2017) rally). Oil may extend consolidation above new low, as daily studies are oversold, but so far without reversal signal that limits recovery attempts. Session high at $42.70 marks initial resistance, followed by $43.00 and first pivot at $43.74 (former low of 05 May / Fibo 38.2% of $46.46/$42.04). Sustained break here is needed to trigger stronger correction which is also signaled by daily RSI bullish divergence.
Res: 42.70, 43.00, 43.74, 44.40
Sup: 42.26, 42.04, 41.09, 40.63
EUR/GBP Daily Outlook
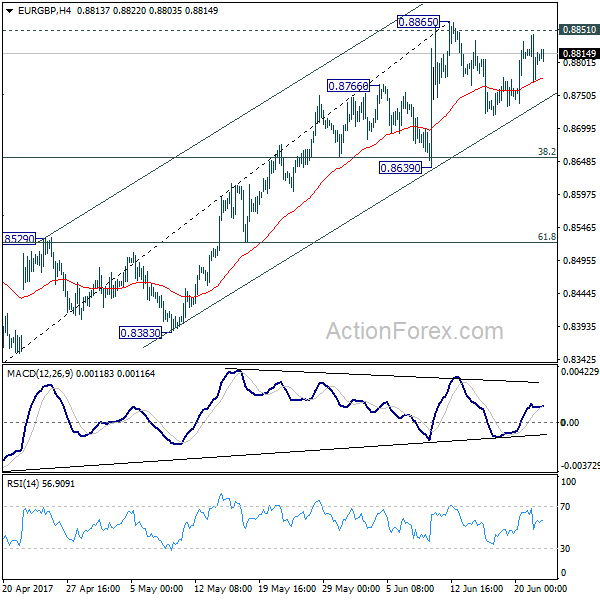
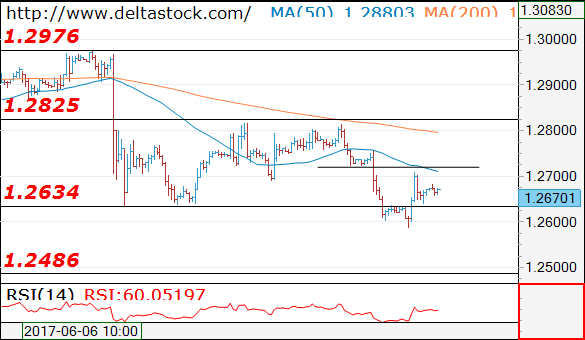
Daily Pivots: (S1) 0.8774; (P) 0.8810; (R1) 0.8848; More...
EUR/GBP is staying in consolidation from 0.8865 and intraday bias remains neutral at this point. In case of another fall, we'd expect strong support from 0.8639 to contain downside and bring rise resumption. Decisive break of 0.8851 resistance will pave the way to retest 0.9304 high. However, break of 0.8639 support will now indicate near term topping and bring deeper pull back 0.8529 resistance turned support and below.
In the bigger picture, price actions from 0.9304 are viewed as a medium term corrective pattern. The leg from 0.9304 should have completed after testing 0.8332 structural support. But it's too early to say that larger rise from 0.6935 is resuming. Rejection from 0.9304 will extend the consolidation with another falling leg. Meanwhile, firm break of 0.9304 will target 0.9799 (2008 high). In case of another decline, we'd expect strong support from 0.8116 cluster support (50% retracement of 0.6935 to 0.9304 at 0.8120) to contain downside and bring rebound.
Forex Technical Analysis: EUR/USD, USD/JPY, GBP/USD
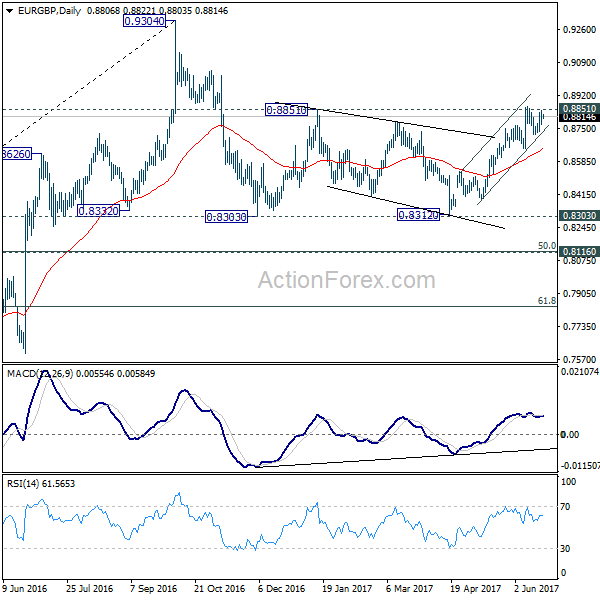
EUR/USD
Current level - 1.1169
The rebound above 1.1110 seems corrective in nature, so the overall bias remains bearish, for a slide towards 1.1020 area. Crucial on the upside is 1.1210.
| Resistance | Support | ||
| intraday | intraweek | intraday | intraweek |
|
1.1180 |
1.1360 |
1.1108 |
1.1020 |
|
1.1210 |
1.1610 |
1.1020 |
1.0838 |
USD/JPY
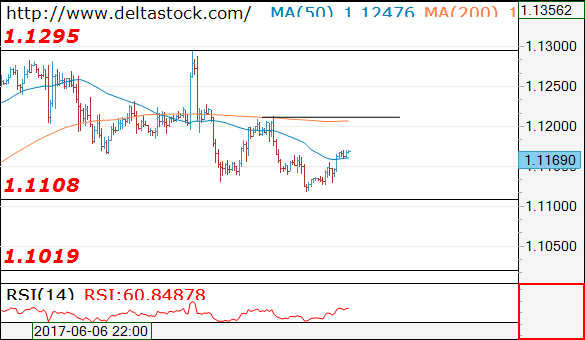
Current level - 111.10
Yesterday's second test of 111.80 failed as well and the outlook is bearish, for a dip towards 110.30 area. Minor intraday resistance lies at 111.20.
| Resistance | Support | ||
| intraday | intraweek | intraday | intraweek |
|
111.80 |
112.10 |
110.30 |
109.08 |
|
112.10 |
114.30 |
110.30 |
108.12 |
GBP/USD
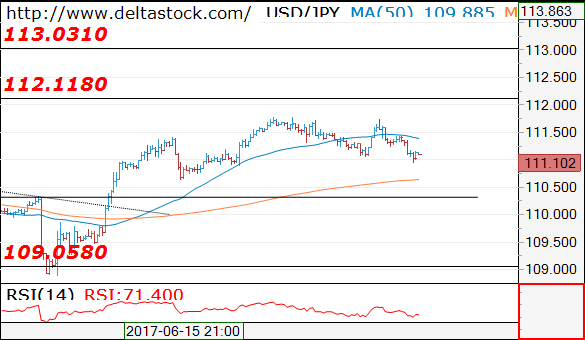
Current level - 1.2670
The reversal at 1.2580 signals a finale of the downtrend from 1.2810, but the slide on the senior frames is still intact, so my outlook is bearish, for a slide towards 1.2480 area. Initial intraday resistance lies at 1.2720, followed by the crucial 1.2825.
| Resistance | Support | ||
| intraday | intraweek | intraday | intraweek |
|
1.2720 |
1.2970 |
1.2634 |
1.2480 |
|
1.2825 |
1.3050 |
1.2580 |
1.2480 |
EUR/AUD Daily Outlook
Daily Pivots: (S1) 1.4709; (P) 1.4747; (R1) 1.4822; More...
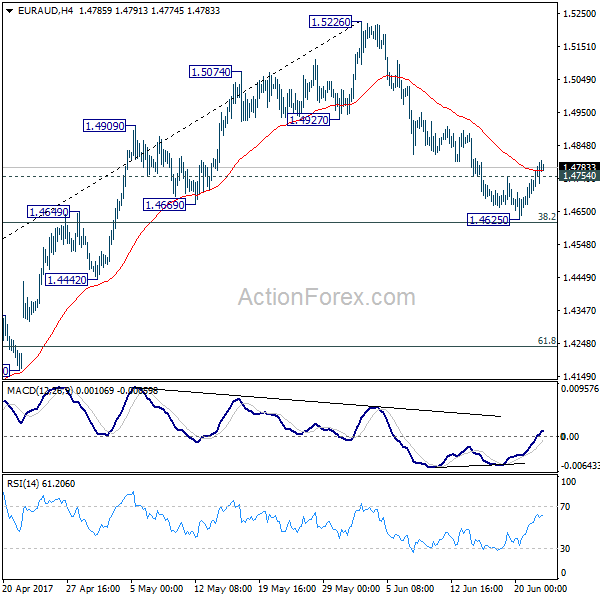
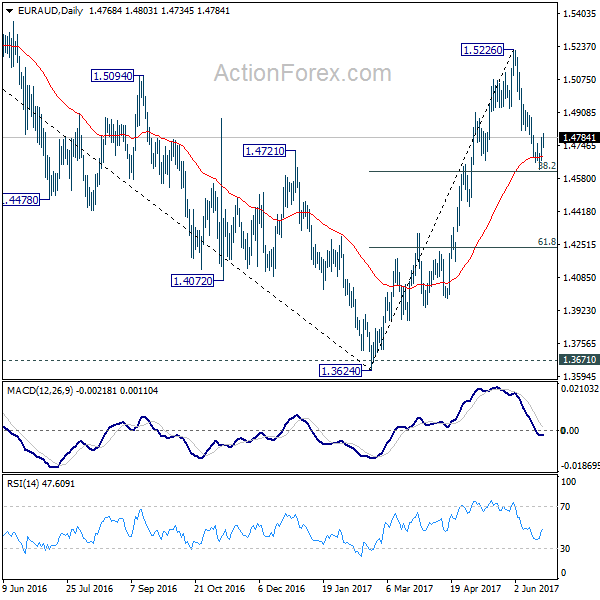
EUR/AUD's recovery argues that pull back from 1.5226 might be completed after drawing support from 38.2% retracement of 1.3624 to 1.5226 at 1.4614. Intraday bias is turned back to the upside for retesting 1.5226 high. However, sustained break of 1.4614 fibonacci level will pave the way to 61.8% retracement at 1.4236 and possibly below.
In the bigger picture, price actions from 1.6587 medium term top are viewed as a corrective pattern. Such correction should be completed at 1.3624 after defending 1.3671 key support. Rise from 1.3642 would extend to 61.8% retracement of 1.6587 to 1.3624 at 1.5455. Sustained break there will pave the way to retest 1.6587. However, sustained break of 1.4669 support will dampen this bullish view. We'll assess the outlook later after looking at the structure and depth of the pull back.