Sample Category Title
Australia’s Growth Prospects Remain Solid: RBA Minutes
For the 24 hours to 23:00 GMT, the AUD declined 0.38% against the USD and closed at 0.7597.
LME Copper prices rose 0.6% or $31.5/MT to $5687.0/MT. Aluminium prices rose 0.03% or $0.5/MT to $1861.5/MT.
In the Asian session, at GMT0300, the pair is trading at 0.7590, with the AUD trading 0.09% lower against the USD from yesterday's close.
Earlier today, minutes of the Reserve Bank of Australia's (RBA) June meeting revealed that committee members were concerned about household debt and wage growth, while policy makers expect a broad slowdown in the nation's first quarter growth, weighed by weaker consumption. Nevertheless, the central bank expressed confidence that growth in the resource-rich economy will accelerate over coming years.
On the data front, Australia's house price index advanced 2.2% on a quarterly basis in 1Q 2017, meeting market expectations and compared to a gain of 4.1% in the previous quarter.
The pair is expected to find support at 0.7574, and a fall through could take it to the next support level of 0.7557. The pair is expected to find its first resistance at 0.7618, and a rise through could take it to the next resistance level of 0.7645.
The currency pair is trading below its 20 Hr and 50 Hr moving averages.

Euro-Zone’s Construction Output Rebounded In April
For the 24 hours to 23:00 GMT, the EUR declined 0.43% against the USD and closed at 1.1150.
On the macro front, the Euro-zone's seasonally adjusted construction output rebounded 0.3% on a monthly basis in April, following a drop of 1.1% in the previous month.
The US Dollar advanced against its key peers, after a key Federal Reserve (Fed) policymaker indicated that a third interest rate hike this year remains on the table.
The New York Federal Reserve (Fed) President, William Dudley, offered an upbeat assessment of the US economy, stating that tightening in the labour market will push wages higher and will eventually help drive up inflation. However, the Chicago Fed President, Charles Evans, noted that the Fed should move slowly to raise rates and shrink its portfolio, as inflation is stubbornly soft.
In the Asian session, at GMT0300, the pair is trading at 1.1156, with the EUR trading slightly higher against the USD from yesterday's close.
The pair is expected to find support at 1.1127, and a fall through could take it to the next support level of 1.1098. The pair is expected to find its first resistance at 1.1199, and a rise through could take it to the next resistance level of 1.1242.
Moving ahead, investors will look forward to the Euro-zone's current account data for April, slated to release in a few hours. Additionally, market participants would eye comments from a few Fed officials as they are scheduled to speak later in the day.
The currency pair is trading below its 20 Hr and 50 Hr moving averages.

Britain Began Formal Brexit Negotiations With EU
For the 24 hours to 23:00 GMT, the GBP declined 0.28% against the USD and closed at 1.2733, amid increased anxiety amongst investors as formal talks on Britain’s exit from the European Union (EU) got under way.
The Brexit Minister, David Davis, started talks with the EU officials in Brussels to work out a deal on Britain’s exit from the EU and its future relationship with the common currency bloc.
In the Asian session, at GMT0300, the pair is trading at 1.2733, with the GBP trading flat against the USD from yesterday’s close.
The pair is expected to find support at 1.2700, and a fall through could take it to the next support level of 1.2666. The pair is expected to find its first resistance at 1.2791, and a rise through could take it to the next resistance level of 1.2848.
Trading trends in the GBP today is expected to be determined by comments from the Bank of England (BoE) Governor, Mark Carney, as he is due to speak in a few hours.
The currency pair is trading below its 20 Hr and 50 Hr moving averages.

Japanese Yen Trading A Tad Lower This Morning
For the 24 hours to 23:00 GMT, the USD rose 0.61% against the JPY and closed at 111.63.
In the Asian session, at GMT0300, the pair is trading at 111.66, with the USD trading slightly higher against the JPY from yesterday’s close.
The pair is expected to find support at 111.12, and a fall through could take it to the next support level of 110.58. The pair is expected to find its first resistance at 111.99, and a rise through could take it to the next resistance level of 112.32.
Looking ahead, the Bank of Japan’s (BoJ) latest meeting minutes, scheduled to release overnight, will be on investors’ radar.
The currency pair is trading above its 20 Hr and 50 Hr moving averages.

Swiss Franc Trading Marginally Higher In The Morning Session
For the 24 hours to 23:00 GMT, the USD rose 0.21% against the CHF and closed at 0.9755.
On the economic front, Switzerland's total sight deposits rose to a level of CHF577.4 billion in the week ended 16 June, from CHF576.4 billion registered in the previous week.
In the Asian session, at GMT0300, the pair is trading at 0.9751, with the USD trading a tad lower against the CHF from yesterday's close.
The pair is expected to find support at 0.9710, and a fall through could take it to the next support level of 0.9670. The pair is expected to find its first resistance at 0.9777, and a rise through could take it to the next resistance level of 0.9804.
Looking ahead, investors will closely monitor Switzerland's SECO economic forecast report and a speech by the Swiss National Bank Chairman, Thomas Jordan, slated to release in a while.
The currency pair is trading above its 20 Hr and 50 Hr moving averages.

Loonie Trading Slightly Higher This Morning
For the 24 hours to 23:00 GMT, the USD marginally rose against the CAD and closed at 1.3225.
In the Asian session, at GMT0300, the pair is trading at 1.3222, with the USD trading a tad lower against the CAD from yesterday’s close.
The pair is expected to find support at 1.3189, and a fall through could take it to the next support level of 1.3157. The pair is expected to find its first resistance at 1.3256, and a rise through could take it to the next resistance level of 1.3291.
Amid no economic releases in Canada today, investors will look forward to global events for further direction.
The currency pair is showing convergence with its 20 Hr and 50 Hr moving averages.

European Open Briefing: USD/JPY Extended Gains In Asia
Global Markets:
- Asian stock markets: Nikkei up 1.10 %, Shanghai Composite gained 0.05 %, Hang Seng fell 0.15 %, ASX 200 lost 0.50 %
- Commodities: Gold at $1246 (+0.05 %), Silver at $16.50 (+0.10 %), WTI Oil at $44.50 (+0.15 %), Brent Oil at $47.00 (+0.20 %)
- Rates: US 10-year yield at 2.19, UK 10-year yield at 1.03, German 10-year yield at 0.29
News & Data
- Australia House Price Index q/q 2.2 % vs 2.2 % expected
- Australia ANZ-Roy Morgan Weekly Consumer Confidence: 112.4 (prior 112.9)
- Japan Tankan Manufacturers Index +26 (prior +24)
- New Zealand ANZ Roy Morgan Consumer Confidence +3.1% m/m (prior +1.8%)
- Fed's Evans says worth waiting until year-end to assess next rate hike – RTRS
- Asia shares near two-year high as U.S. hi-tech rebound boosts mood – RTRS
- Oil prices hold near seven-month lows, glut keeps dragging – RTRS
RBA Meeting Minutes:
- Appropriate to keep accommodative stance of policy unchanged
- Watching labour and housing markets carefully
- House prices rising briskly in some markets, tentative signs pressure starting to ease
- Wage growth to remain low for some time, noted isolated reports of higher pay deals
- Recent faster pace of jobs growth to continue, but underemployment still high
- GDP growth to accelerate to 3 % over time, despite soft Q1
- Repeats a rising A$ would complicate economic adjustment
Markets Update:
USD/JPY extended gains in Asia, as the rally in stock markets continued. The pair reached a high of 111.78 so far, and is likely to test 112 resistance soon. Should price break above that level, there is little resistance until 113.
The US Dollar regained some strength against the other major currencies as well. EUR/USD is under pressure after another failure at 1.12, although losses have been limited to 1.1140 so far. Overall, more consolidation seems likely.
The Pound is likely to remain weak, as the Brexit negotiations will weigh on the currency. Key support is noted at 1.2640, followed by 1.25. To the topside, resistance is seen at 1.2780 and 1.2820.
AUD/USD is consolidating, but not showing any signs of weakness yet. As long as the pair can hold above 0.7520 support, the outlook is mildly positive.
Upcoming Events:
- 09:00 BST – Euro Zone Current Account
- 13:00 BST – FOMC Member Fischer speaks
- 13:30 BST – US Current Account
- 20:00 BST – FOMC Member Kaplan speaks
Daily Technical Outlook And Review: EUR/USD, GBP/USD, AUD/USD, USD/JPY, USD/CAD, USD/CHF, DOW 30, GOLD
A note on lower timeframe confirming price action...
Waiting for lower timeframe confirmation is our main tool to confirm strength within higher timeframe zones, and has really been the key to our trading success. It takes a little time to understand the subtle nuances, however, as each trade is never the same, but once you master the rhythm so to speak, you will be saved from countless unnecessary losing trades. The following is a list of what we look for:
- A break/retest of supply or demand dependent on which way you're trading.
- A trendline break/retest.
- Buying/selling tails ... essentially we look for a cluster of very obvious spikes off of lower timeframe support and resistance levels within the higher timeframe zone.
- Candlestick patterns. We tend to only stick with pin bars and engulfing bars as these have proven to be the most effective.
We typically search for lower-timeframe confirmation between the M15 and H1 timeframes, since most of our higher-timeframe areas begin with the H4. Stops are usually placed 1-3 pips beyond confirming structures.
EUR/USD
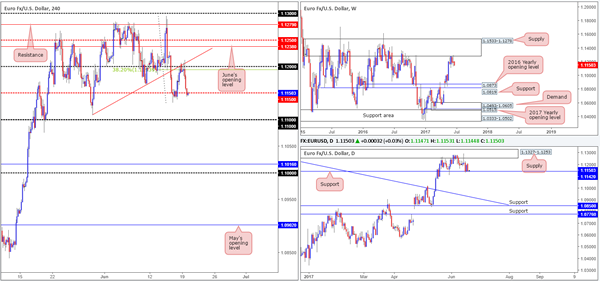
In Monday's report, the team highlighted the 1.12 region as a potential sell zone. This was mainly due to the psychological band intersecting nicely with a H4 trendline resistance extended from the low 1.1109 and a H4 38.2% Fib resistance at 1.1193 taken from the high 1.1295. In addition to this, weekly price was (and still is) seen respecting a major supply coming in at 1.1533-1.1278.
As you can see, price responded well to the 1.12 neighborhood, and even printed a reasonably sized H4 bearish candle before dropping down to challenge the H4 mid-level support at 1.1150. So, well done to any of our readers who managed to jump aboard here!
Going forward, we're looking for price to continue driving lower. Still, before this is possible, the daily support at 1.1142 will have to be consumed. Once this level is out of the picture, this will likely place the daily trendline support etched from the high 1.1616 in the firing range, followed closely by daily support at 1.0850.
Our suggestions: Before shorts are considered, we would want to see the 1.11 handle consumed. This would, in our view, clear the runway south down to H4 support at 1.1016, followed closely by the 1.10 handle.
Data points to consider: FOMC member Fischer speaks at 1pm, FOMC member Kaplan speaks at 8pm GMT+1.
Levels to watch/live orders:
- Buys: Flat (stop loss: N/A).
- Sells: Watching for the 1.11 handle to be consumed before shorts are considered.
GBP/USD
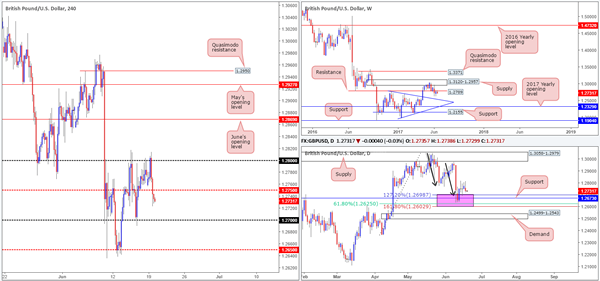
Once again, H4 bulls failed to muster enough strength to sustain gains beyond the 1.28 handle. This saw the candles turn red as the market entered London's lunchtime, and consequently closed below the H4 mid-level support 1.2750 during the early hours of the US segment. This leaves the 1.27 boundary open for a possible test today.
Turning our attention over to the bigger picture, weekly price currently shows price respecting 1.2789 as resistance. Assuming that this level continues to hold ground, we could witness price selloff down to a trendline support taken from the high 1.2774. On the flip side, daily action is seen trading within striking distance of 1.2602/1.2698 (an area marked in pink). This zone is comprised of a support level coming in at 1.2673, a 61.8% Fib support at 1.2625 (taken from the low 1.2365) and an AB=CD (black arrows) 127.2/161.8% ext. completion point seen at 1.2602/1.2698 (drawn from the high 1.3047).
Our suggestions: While the H4 bears emphasize strength at the moment; this may not be the correct time to sell. Not only do we have 1.27 lurking just below, let's not forget that there's also a rather large daily zone hovering just beneath this. Similarly, buying from the 1.27 is just as risky we believe, since weekly price is trading from resistance!
Therefore, no matter which direction you take this week, you'll be trading against higher-timeframe flow! With that being the case, our team has decided to remain on the sidelines for the time being until we have more of a defined direction in this market.
Data points to consider: BoE Gov. Carney speaks at 8.30am. FOMC member Fischer speaks at 1pm, FOMC member Kaplan speaks at 8pm GMT+1.
Levels to watch/live orders:
- Buys: Flat (stop loss: N/A).
- Sells: Flat (stop loss: N/A).
AUD/USD
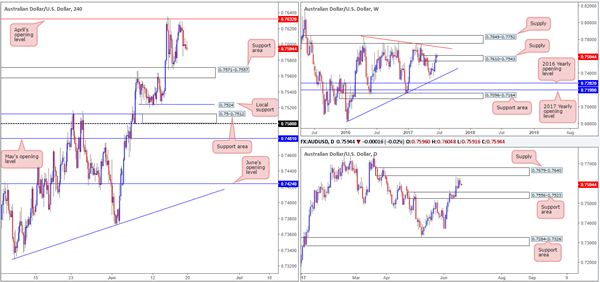
As can be seen on the H4 timeframe this morning, price remains consolidating between April's opening level at 0.7632 and the support area coming in at 0.7571-0.7557. Of particular interest here is April's opening level being sited just 8 pips below the lower edge of a daily supply at 0.7679-0.7640. Scrolling up to the weekly timeframe, we can see that the unit marginally closed above supply at 0.7610-0.7543. However, as we mentioned in Monday's report, it may be worth waiting for this week's candle to close before presuming that the said weekly supply is consumed, since it could just as well be a fakeout.
Our suggestions: Although weekly price printed a minor close above supply, both the H4 and daily charts indicate that the bears have a fighting chance! To our way of seeing things, an ideal scenario would be for H4 price to chalk up a bearish selling wick that whipsaws through 0.7632, connects with the daily supply and then closes back below 0.7632. This would, in our humble opinion, be enough evidence to validate a sell, with an initial target objective set at the said H4 support area.
Data points to consider: Australian Monetary policy meeting minutes at 2.30am. FOMC member Fischer speaks at 1pm, FOMC member Kaplan speaks at 8pm GMT+1.
Levels to watch/live orders:
- Buys: Flat (stop loss: N/A).
- Sells: Look for H4 price to chalk up a bearish selling wick that whipsaws through 0.7632 and connects with daily supply (stop loss: ideally beyond the candle's wick).
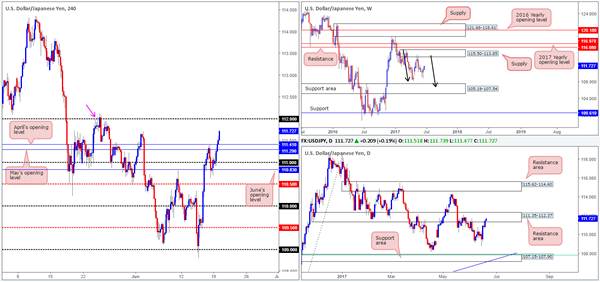
USD/JPY
USD/JPY bulls went on the offensive during the course of yesterday's trading, breaching multiple H4 tech resistances. As we write, H4 price looks poised to attack the 112 handle, which happens to intersect with a H4 left shoulder (Quasimodo formation) marked with a pink arrow. 112 is of interest to our desk today. Not only because of the Quasimodo convergence, but also because 112 is positioned within a daily resistance area drawn from 111.35-112.37 (been in play since the end of November 2016).
Also, despite recent gains, we still feel that weekly bears remain in a relatively strong position after pushing aggressively lower from supply registered at 115.50-113.85. We know there's a lot of ground to cover here, but this move could possibly result in further downside taking shape in the form of a weekly AB=CD correction (see black arrows) that terminates within a weekly support area marked at 105.19-107.54 (stretches all the way back to early 2014).
Our suggestions: In light of the above notes, 112 is a reasonably nice-looking sell zone. To be on the safe side, however, we will wait for additional confirmation in the form of a H4 bear candle (preferably a full-bodied candle) before pulling the trigger from here. Although this will not guarantee a winning trade, it will show seller intent, and, in our opinion, that's the best we can hope for.
Data points to consider: FOMC member Fischer speaks at 1pm, FOMC member Kaplan speaks at 8pm GMT+1.
Levels to watch/live orders:
- Buys: Flat (stop loss: N/A).
- Sells: 112 region ([waiting for a reasonably sized H4 bear candle – preferably a full-bodied candle – to form before pulling the trigger is advised] stop loss: ideally beyond the candle's wick).
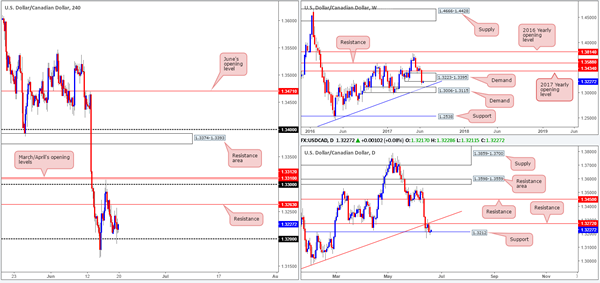
USD/CAD
For those who read Monday's report on the USD/CAD you may recall that our desk underscored the possibility of a long trade from the 1.32 handle. As you can see, in recent hours 1.32 was challenged and has held firm. But why did we select this level? For anyone who missed Monday's report, here's why:
1.32 could be an option today. A break below the daily support level at 1.3212 would likely trigger stops positioned beneath this barrier, thus providing liquidity to buy into. Furthermore, let's also bear in mind that beneath the weekly demand at 1.3223-1.3395, stops have also likely been activated thus providing additional liquidity.
Well done to any of our readers who have managed to jump aboard here, as we expect price to at least reach the H4 resistance pegged at 1.3263.
Our suggestions: Other than our recent call to buy 1.32, we do not see much else to hang our hat on at the moment.
Data points to consider: FOMC member Fischer speaks at 1pm, FOMC member Kaplan speaks at 8pm GMT+1.
Levels to watch/live orders:
- Buys: Flat (Stop loss: N/A).
- Sells: Flat (Stop loss: N/A).
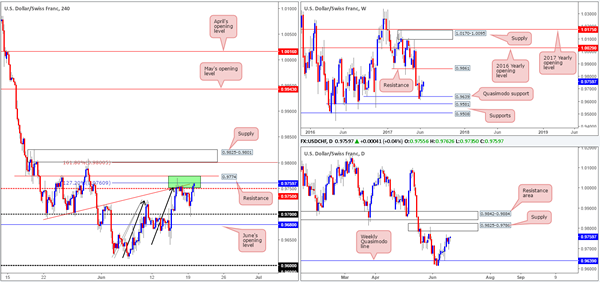
USD/CHF
In recent trading, H4 price extended lower and connected with the 0.97 handle, which, as you can see, held firm and lifted the unit back up to where it held on Friday: the green H4 area at 0.9774/0.9750. This zone is comprised of a H4 resistance level at 0.9774, a H4 AB=CD 127.2% ext. at 0.9760 taken from the low 0.9613, a H4 trendline resistance etched from the low 0.9691 and a H4 mid-level resistance drawn from 0.9750. Whilst the confluence is attractive and a second bounce lower may be seen from here, we have our eyeballs on the H4 supply seen overhead at 0.9825-0.9801. Apart from converging with a H4 AB=CD 161.8% ext. at 0.98 taken from the low 0.9613 and the round number 0.98, this area is also positioned around the upper edge of daily supply marked at 0.9825-0.9786.
Our suggestions: Should price strike the H4 supply area mentioned above at 0.9825-0.9801 today/this week, we would, dependent on the time of day, look to sell from here at market, with stops sited at 0.9827, targeting 0.9750 as an initial take-profit zone.
Data points to consider: FOMC member Fischer speaks at 1pm, FOMC member Kaplan speaks at 8pm. SNB Chairman Jordan speaks at 7.30am and at 9.45am GMT+1.
Levels to watch/live orders:
- Buys: Flat (stop loss: N/A).
- Sells: 0.98 (stop loss: 0.9827).
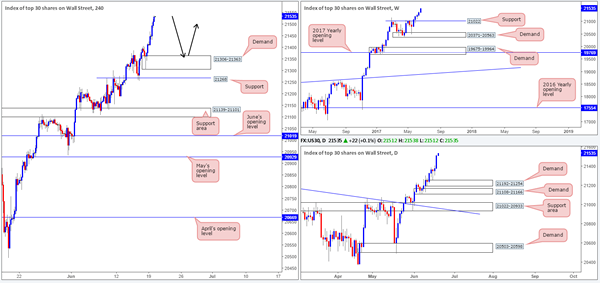
DOW 30
US stocks continued to climb higher on Monday, consequently recording a fresh record high of 21522. For those who have been following our reports over the past few days you may recall that our desk recently took a small long position at 21164 and initially placed stops below the H4 support area (21139-21101) at 21097. The position is still active, but we have liquidated 50% of the trade around the 21234 neighborhood.
Fortunately, as mentioned above, the index has continued to push higher and we are now trailing this market with the remainder of our position. The stop-loss order has been moved to just below the H4 demand drawn from 21306-21363 at 21298.
Now, apart from our current position in this market, the only area we would be looking to buy from would be the said H4 demand. Ultimately though, we do not want price to pullback this far as it then puts out stop-loss order in jeopardy.
Our suggestions: Personally, we are looking for price to continue rallying, as we intend on trailing this trend long term. Should price challenge 21306-21363 this week, however, and is bolstered by a full or near-full-bodied bullish candle, we may look to add to our current position (as per the black arrows) and trail accordingly.
Data points to consider: FOMC member Fischer speaks at 1pm, FOMC member Kaplan speaks at 8pm GMT+1.
Levels to watch/live orders:
- Buys: 21164 ([live] stop loss: 21298). 21306-21363 ([waiting for a reasonably sized H4 bull candle – preferably a full-bodied candle – to form before pulling the trigger is advised] stop loss: ideally beyond the candle's tail).
- Sells: Flat (stop loss: N/A).
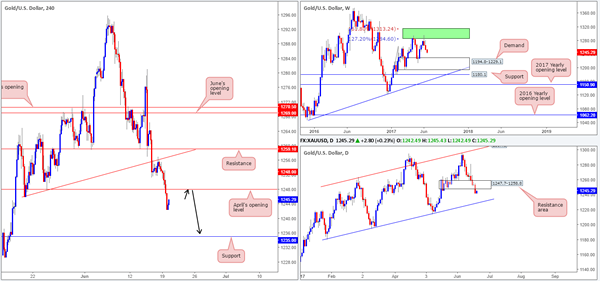
GOLD
Following Friday's retest at the underside of the recently broken H4 trendline support taken from the low 1249.3, the price of gold weakened on Monday. Not only did this clear bids out from April's opening line at 1248.0, it potentially opened the trapdoor south down to the H4 support level penciled in at 1235.0.
It may also be worth noting that below the said H4 support is a weekly demand base coming in at 1194.8-1229.1 that intersects with a daily channel support line taken from the low 1180.4.
Our suggestions: Based on the above points our team is biased to the downside for the time being. A retest of April's opening level at 1248.0 as resistance would, if it's accompanied by a reasonably sized H4 bearish candle (preferable a full-bodied candle), be an ideal zone to sell from, targeting the aforementioned H4 support level, followed closely by the top edge of weekly demand at 1229.1.
Levels to watch/live orders:
- Buys: Flat (stop loss: N/A).
- Sells: 1248.0 region ([waiting for a reasonably sized H4 bear candle – preferably a full-bodied candle – to form before pulling the trigger is advised] stop loss: ideally beyond the candle's wick).
Daily Technical Analysis: EUR/USD Bearish Reversal Challenges Long-Term Support Trend Line
Currency pair EUR/USD
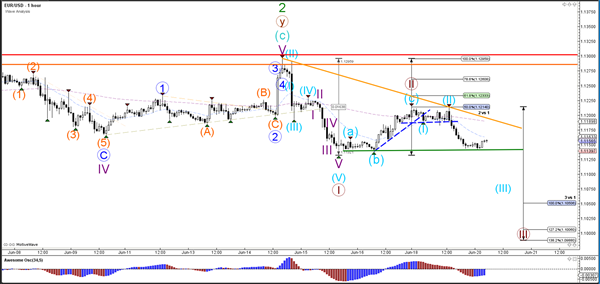
The EUR/USD is testing the long-term support trend line (dark blue). Price will need to break below that support trend line before a potential new downtrend within wave 3 (brown) is possible.
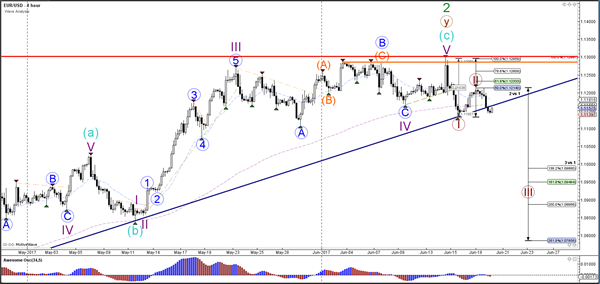
The EUR/USD invalidates wave 2 (brown) if price manages to break above the 100% Fibonacci level. A break below support (green) could potentially start bearish waves 3.
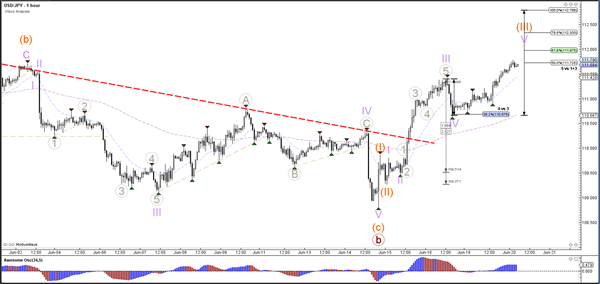
Currency pair USD/JPY
The USD/JPY continued with the bullish momentum (orange 3) within wave C (brown) yesterday.
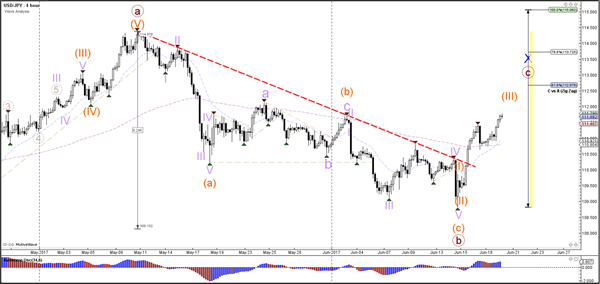
The USD/JPY completed a wave 4 (purple) at the 38.2% Fibonacci level and is now moving higher towards the Fibonacci targets of wave 5 (purple).
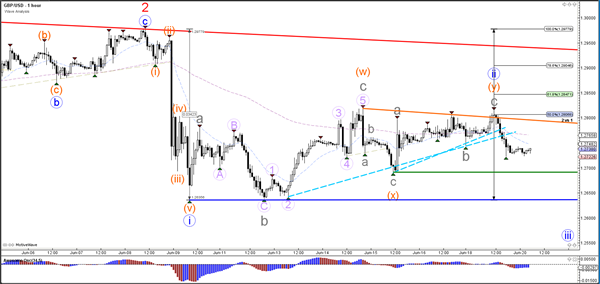
Currency pair GBP/USD
The GBP/USD could be building a correction within wave 2 (blue). A bearish breakout below support (green/blue) could see a bearish breakout but a break above the 100% Fib level invalidates wave 2 (blue).
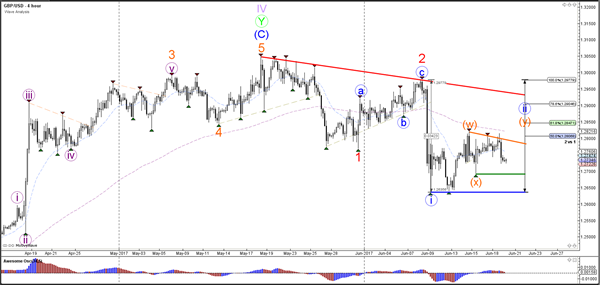
The GBP/USD needs to break below support (blue/green) to confirm a potential wave 3 (blue). The Fibonacci levels of wave 2 (blue) could act as resistance.
Elliott Wave View: DAX More Upside
Short term DAX Elliott Wave view suggests the decline to 12491.5 on 5/18 ended Intermediate wave (2). Up from there, the rally is unfolding as a double three Elliott Wave structure. Minute wave ((w)) ended at 12879.5 and Minute wave ((x)) pullback ended at 12616.44. Internal of Minute wave ((x)) is subdivided as an expanded flat Elliott Wave structure where Minutte wave (a) ended at 12633.5 and Minutte wave (b) ended at 12922.5.
A break above Minutte wave ((b)) on 6/14 is necessary to add validity that the next leg higher has started. Up from 12616.44, the rally is unfolding as a zigzag Elliott Wave structure where Minute wave (a) is in progress as 5 waves. Expect a pullback in Minute wave (b) soon to correct cycle from 6/15 low (12616.44). While dips stay above 12616.44, expect Index to extend higher. We do not like selling the proposed pullback and buyers should appear once Minute wave (b) pullback is complete in 3, 7, or 11 swing.
DAX 1 Hour Elliott Wave Chart