Sample Category Title
GBP/USD Daily Outlook
Daily Pivots: (S1) 1.2700; (P) 1.2757; (R1) 1.2792; More...
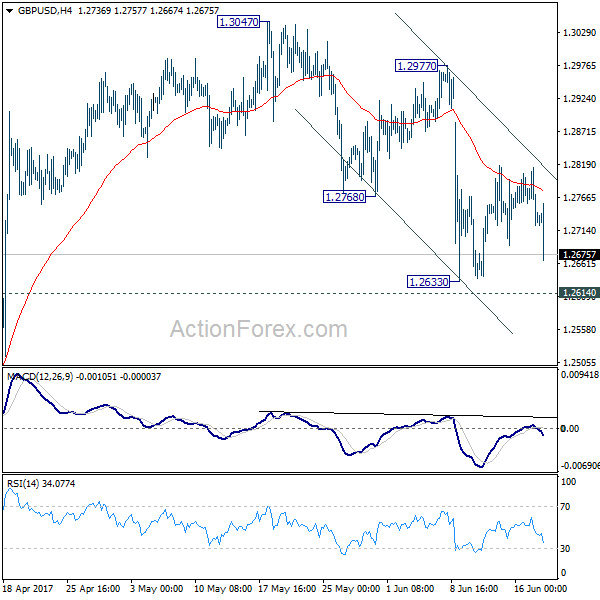
GBP/USD drops sharply today but it's staying above 1.2633. Intraday bias remains neutral first. With 1.2977 resistance intact, we're still favoring the bearish case. That is, consolidation pattern from 1.1946 has completed at 1.3047 already. Break of 1.2614 resistance turned support should confirm our bearish view and target a test on 1.1946 low next. However, break of 1.2977 will dampen our view and turn bias back to the upside for 1.3047 and above.
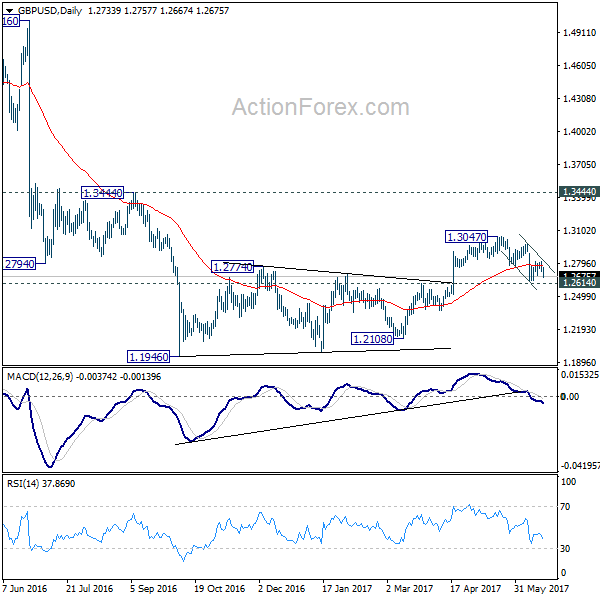
In the bigger picture, fall from 1.7190 is seen as part of the down trend from 2.1161. Price actions from 1.1946 medium term low are seen as a consolidation pattern, which could have completed after hitting 55 week EMA. Break of 1.1946 low will target 61.8% projection of 1.5016 to 1.1946 from 1.3047 at 1.1150 next. In case the consolidation from 1.1946 extends, outlook will stay remain bearish as long as 1.3444 resistance holds.
GBP/USD Candlesticks and Ichimoku Analysis
Weekly
• Last Candlesticks pattern: Long white candlestick
• Time of formation: 16 Jan 2017
• Trend bias: Down
Daily
• Last Candlesticks pattern: Long white candlestick
• Time of formation: 18 Apr 2017
• Trend bias: Near term up
GBP/USD – 1.2655
Although cable did recover after falling to 1.2635 earlier this month and consolidation above this level would be seen, still reckon upside would be limited to the Kijun-Sen (now at 1.2842) and bearishness remains of the fall from 1.3048 top to bring retracement of recent upmove, below 1.2635 support would add credence to this near term bearish view, bring correction of recent upmove to previous resistance at 1.2616, a daily close below this level would encourage for further weakness to 1.2550, then 1.2500 support but oversold condition should limit downside to 1.2440-50 and price should stay well above key support at 1.2365, bring rebound later.
On the upside, expect recovery to be limited to 1.2818 resistance and the Kijun-Sen (now at 1.2842) should hold, bring another decline. A daily close above the Kijun-Sen (now at 1.2842) would defer and risk a stronger rebound to 1.2885-90 but price should falter well below said resistance at 1.2978 and bring another decline later. Only a sustained breach above this level would suggest the correction from 1.3048 top has ended and bring further gain towards this level, a break of this level would revive bullishness and extend recent upmove from 1.1986 low (Jan low) for retracement of early downtrend to 1.3050-60, then 1.3100. having said that, loss of near term upward momentum should prevent sharp move beyond 1.3140-50 (38.2% Fibonacci retracement of 1.5018-1.1986) and reckon 1.3200 would hold.
Recommendation: Hold short entered at 1.2800 for 1.2600 with stop above 1.2900.

On the weekly chart, as cable has continued trading within near term established range, suggesting further sideways trading would be seen, however, if our view that a temporary top possibly formed at 1.3048 is correct, upside would be limited to the Tenkan-Sen (now at 1.2842) and bring another test of 1.2635 support, below there would bring further fall to previous resistance at 1.2616, a sustained breach below this level would add credence to this view and signal correction of recent upmove has commenced for subsequent weakness to 1.2550-60, however, still reckon downside would be limited and previous support at 1.2515 should remain intact, bring rebound later.
On the upside, expect recovery to be limited to 1.2818 and the Tenkan-Sen (now at 1.2842) should hold, bring another decline. Above 1.2900 would defer but only break of resistance at 1.2978 would signal the retreat from 1.3048 has ended, bring retest of this level first, once this recent high is penetrated, this would signal the erratic upmove from 1.1986 low (2017 low) has resumed, bring retracement of early decline to 1.3090-00, then towards 1.3140-50 (38.2% Fibonacci retracement of 1.5018-1.1986) but price should falter well below 1.3200-10, risk from there is seen for a retreat to take place later.

USD/CHF Daily Outlook
Daily Pivots: (S1) 0.9714; (P) 0.9737; (R1) 0.9778; More.....
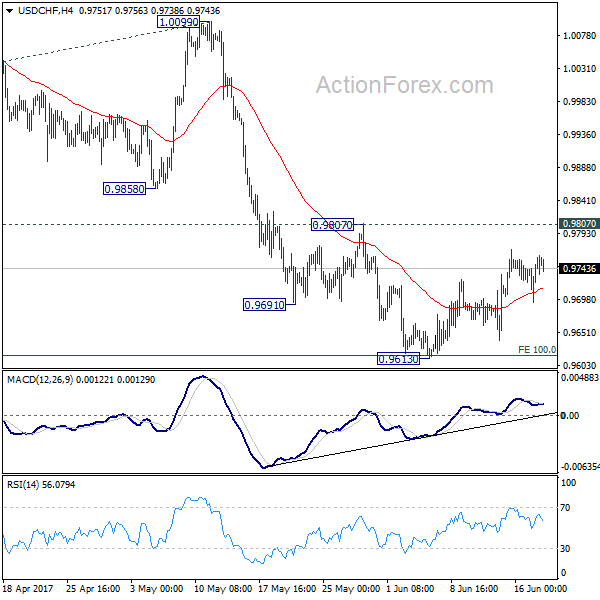
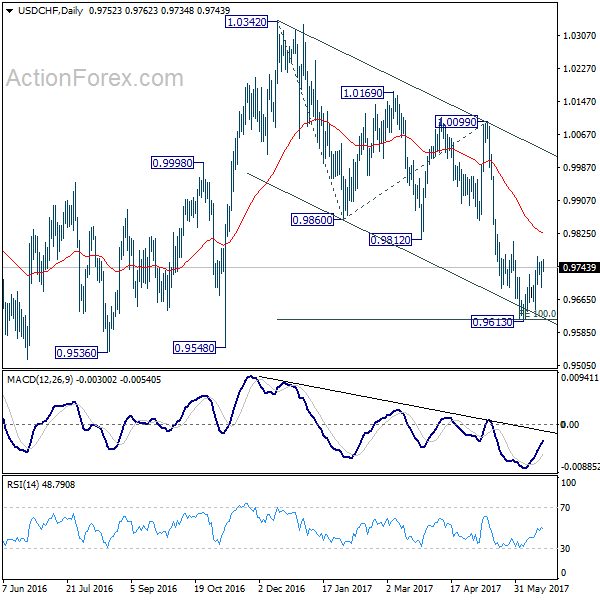
No change in USD/CHF's outlook as the consolidation from 0.9613 continues. Intraday bias stays neutral for the moment. As long as 0.9807 resistance holds, near term outlook remains bearish and deeper fall is expected. Below 0.9613 will extend the whole decline from 1.0342 to 0.9548 support and below. We'd start to look for bottoming signal again as it approaches 0.9443 key support level. However, considering bullish convergence condition in 4 hour MACD, break of 0.9807 will indicate near term reversal and turn outlook bullish for 1.0099 resistance next.
In the bigger picture, USD/CHF is still bounded in medium term range of 0.9443/1.0342 for the moment. Consolidative trading would likely continue and medium term outlook remains neutral. Break of 1.0342 key resistance is needed to confirm underlying bullish momentum in the pair. Meanwhile, downside attempts should be contained by 0.9443 key support level. However, sustained break of 0.9443 will carry larger bearish implication and target 0.9 handle.
USD/CHF Candlesticks and Ichimoku Analysis
Weekly
• Last Candlesticks pattern: Shooting star
• Time of formation: 7 Mar 2017
• Trend bias: Sideways
Daily
• Last Candlesticks pattern: Morning star
• Time of formation: 9 May 2017
• Trend bias: Near term up
USD/CHF – 0.9745
Dollar’s rebound after finding good support at 0.9613 earlier this month has retained our view that further consolidation above this level would be seen and another bounce to 0.9770-75 is likely, however, reckon upside would be limited to resistance at 0.9808 and bring another decline later, below 0.9640-45 would bring retest of said support at 0.9613 but break there is needed to extend recent decline from 1.0344 top (2016 high) towards support at 0.9550, then towards psychological support at 0.9500, having said that, near term oversold condition should prevent sharp fall below latter level and risk from there has increased for a rebound later.
On the upside, whilst initial recovery to 0.9770-75 is likely, reckon upside would be limited to said resistance at 0.9808, bring another decline. A daily close above 0.9859 (previous support now resistance) would defer and suggest a temporary low has been formed instead, bring a stronger rebound to the lower Kumo (now at 0.9982) but price should falter below 1.0000 and bring another selloff.
Recommendation: Sell at 0.9805 for 0.9605 with stop above 0.9905

On the weekly chart, last week’s recovery formed another white candlestick, suggesting minor consolidation above recent low at 0.9613 would be seen and recovery towards resistance at 0.9808 cannot be ruled out, however, price should falter well below the Tenkan-Sen (now at 0.9857) and bring another decline later, below 0.9640-45 would bring retest of 0.9613, break there would confirm early erratic fall from 1.0344 top is still in progress for retracement of early upmove towards previous support at 0.9550 but reckon downside would be limited to 0.9500 and another previous support at 0.9444 should remain intact, risk from there has increased for a strong rebound later.
On the upside, although initial recovery to 0.9770-75 cannot be ruled out, reckon said resistance at 0.9808 would limit upside and bring another decline. A weekly close above the Tenkan-Sen (now at 0.9857) would defer and risk a stronger rebound to 0.9940-50 but 1.0007 (previous resistance) should limit upside and price should falter well below 1.0100, bring another selloff later. Above 1.0100 would signal low is formed instead and suggest the aforesaid decline from 1.0344 has ended, bring test of 1.0171 resistance next.

Foreign Exchange Market Commentary: EUR/USD, USD/JPY, GBP/USD, GOLD, WTI CRUDE, DJIA, FTSE100, DAX
EUR/USD
The American dollar edged higher this Monday, favored by hawkish comments from Fed´s Dudley towards normalization of monetary policies and a scarce macroeconomic calendar. The EUR/USD failed to regain the 1.1200 level, peaking at 1.1212 before turning south, to settle around its daily low 1.1150. The EU released its construction output figures for April, up in the month by 0.3% after falling 1.1% in March, with the YoY reading coming in at 3.2%, down from previous 3.6%. The common currency was unable to attract buyers, despite in the political front, relief news kept coming. After Greece reached an agreement with its creditors last week, French President Emmanuel Macon's party and his allies secured an absolute majority in the National Assembly, with over 300 of the total of 577 seats. In the US, Fed's Dudley spoke at the North Country Chamber of Commerce, in Plattsburgh, offering a confidence stance over inflation and employment, aligned with latest FOMC's Minutes. Dudley said inflation should pick up as wages rise along with continuing improvement in the labor market.
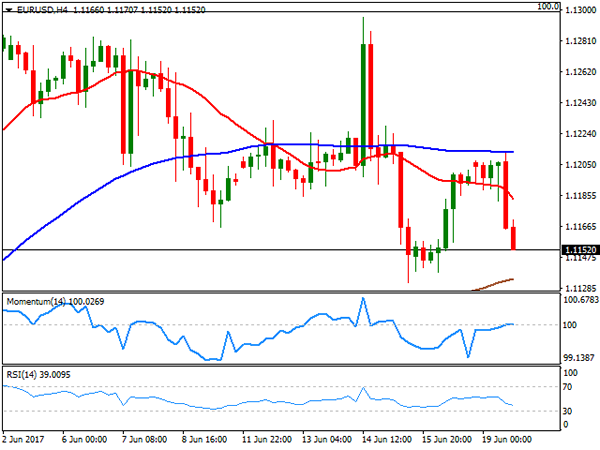
The EUR/USD pair heads into the Asian session with a neutral-to-bearish stance in the short term, having remained contained by its 100 SMA in the 4 hours chart, flat around 1.1220. In the same chart, the price extended below a now bearish 20 SMA, whilst the Momentum indicator stands pat around its 100 level as the RSI heads modestly lower in the 40 region, this last anticipating some additional declines ahead. Still buying interest may surge on an approach to 1.1110, May 30th low and the immediate support, with a critical one standing at 1.1075, the low set on May 18th.
Support levels: 1.1110 1.1075 1.1030
Resistance levels: 1.1220 1.1260 1.1300
USD/JPY
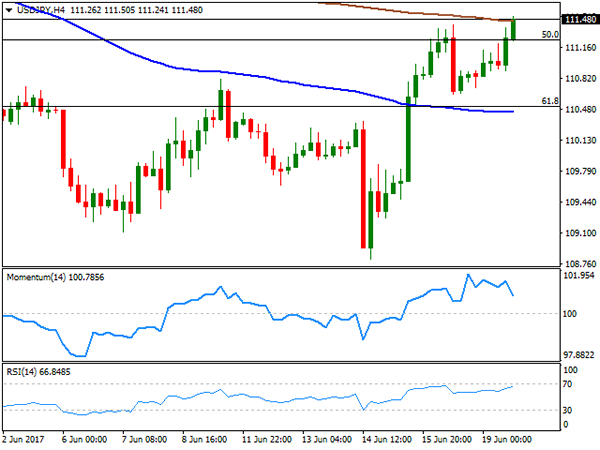
The USD/JPY pair advanced steadily all through this Monday, ending the day not far below a daily high of 111.52. Disappointing Japanese trade balance figures, a confident Fed's Dudley and rising yields backed the advance. The May Japanese trade balance, released at the beginning of the week, came well below expected, posting a deficit of ¥203.4 billion, missing an expected surplus of ¥76.0B. Imports, however, increased by 17.8% when compared to a year earlier, while exports rose by 14.9%, doubling previous month's gain but slightly below expected. US Treasury yields advanced during the American session, with the 10-year note benchmark up to 2.19% from previous 2.16%, backing the pair's recovery. The intraday advance could extend over the next few sessions, as the price recovered above the next Fibonacci level, now the immediate support at 111.25, the 50% retracement of its latest weekly advance. In the 4 hours chart, the Momentum indicator eases within positive territory, rather reflecting the slow advance than suggesting easing upward strength, whilst the RSI indicator advances, currently at 67. In the same chart, the price is trying to advance beyond its 200 SMA also indicating additional gains ahead, initially towards 112.00, the 38.2% retracement of the same rally.
Support levels: 111.25 110.80 110.50
Resistance levels: 111.60 112.00 112.45
GBP/USD
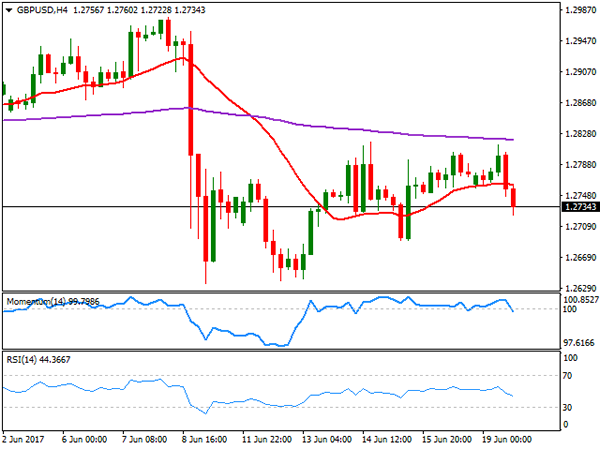
The GBP/USD pair started the day with a strong footing, reaching a daily high of 1.2814 after London's opening, but fading gains with early Fed's Dudley speech, later sliding after the official start of Brexit negotiations in Brussels. UK's David Davis and the EU's Michel Barnier hold a joint press conference, full of good intentions, but just an introduction to what's expected to be a long, rough path. Davis highlighted that settling priority issues will build trust on which to negotiate new relationship, while Barnier foreground the constructive approach, saying their off to a promising start. The pair fell down to 1.2722 in the US afternoon, ending the day some pips above the level, still within familiar ranges, but gaining bearish traction short term. In the 4 hours chart, the early advance stalled a few pips below last week's high and the 200 EMA, this last around 1.2820, while technical indicators turned south, and particularly the RSI stands at 44, anticipating some further slides ahead on a break below 1.2705, February's monthly high and the immediate support.
Support levels: 1.2705 1.2665 1.2630
Resistance levels: 1.2760 1.2795 1.2830
GOLD
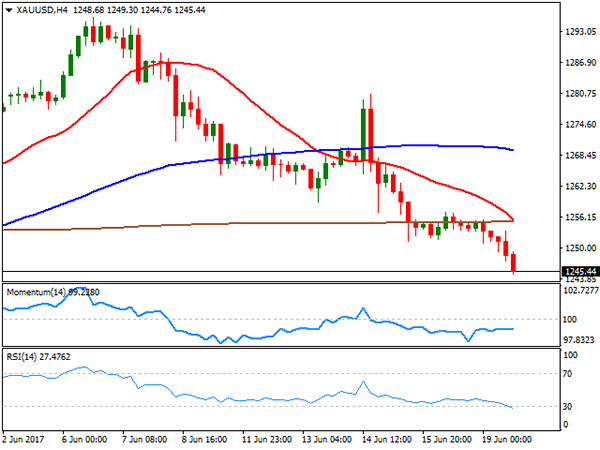
Gold prices continued resumed their decline this Monday, with spot settling at $1.245.50 a troy ounce, its lowest in over a month, on a firmer dollar. Comments from Fed's Dudley, pretty much repeating Yellen's statement heard last week, weighed on the bright metal, further dented by a sharp rally in worldwide equities with Wall Street hitting record highs. Sluggish demand from Asian physical buyers at the beginning of the day, also affected gold priced. The daily chart for spot shows that the price has broken below its 100 DMA, extending its decline further below the 20 DMA and with technical indicators accelerating their declines within negative territory, in line with further declines ahead. In the shorter term, and according to the 4 hours chart, the price has settled above all of its moving averages, with the 20 SMA about to cross below the 200 SMA after already breaking through the 100 SMA above the current level, whilst the RSI indicator accelerated its decline, now entering oversold territory and with no sign of changing course.
Support levels: 1,251.10 1,242.50 1,230.90
Resistance levels: 1,257.20 1,265.90 1,271.40
WTI CRUDE OIL
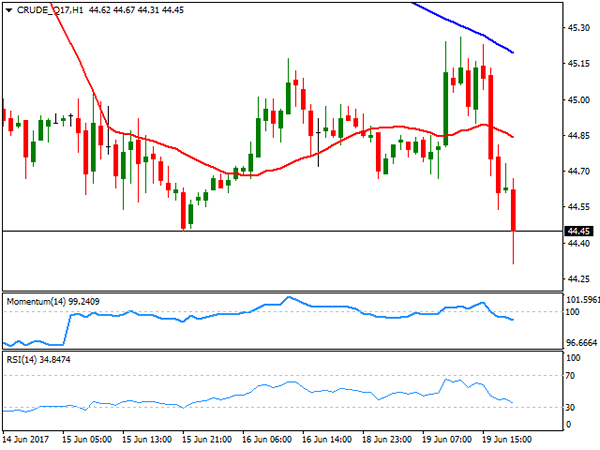
After a positive start of the day, crude oil prices changed course and closed in the red, after falling down to fresh one-month low. Natural gas prices tumbled, as weather forecasts anticipate some cooler conditions ahead, dragging oil prices lower, already sensitive amid increasing US production fueling fears of a worldwide glut. West Texas Intermediate crude futures traded as high as $45.26 a barrel, but closed the day at 44.44, maintaining the bearish technical stance, given that in the daily chart, technical indicators resumed their declines within bearish territory and after a modest upward correction from oversold readings, whilst the 20 DMA continues heading south well above the current level. Shorter term, the 4 hours chart shows that the price settled below a bearish 20 SMA after advancing above it earlier on the day, whilst technical indicators turned south, with the RSI indicator currently at 33, anticipating some further declines on a break below 43.75, the low set on May 5th.
Support levels: 43.75 42.90 42.40
Resistance levels: 45.00 45.65 46.10
DJIA
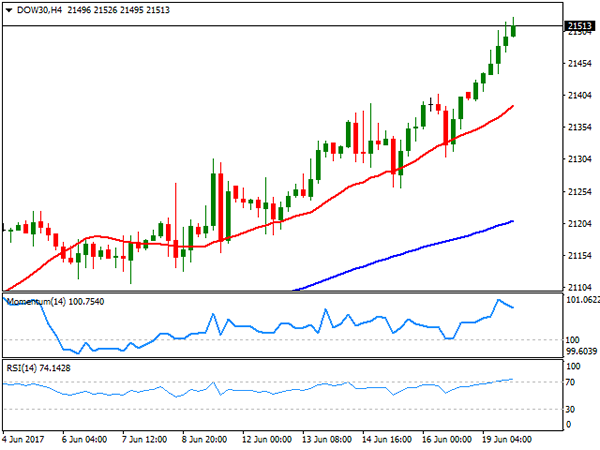
US indexes advanced strongly this Monday, with the Dow Jones Industrial Average and the S&P both closing at record highs. The first added 144 points, and ended at 21,528.99, while the second advanced 20 points, to 2,453.46. The Nasdaq Composite also advanced, settling at 6,239.01, up by 87 points. Stocks rallied on upbeat comments from Fed's Dudley, also backed by a recovery in the tech sector. Within the DJIA, Apple led advancers with a 2.86% gain, followed by JP Morgan, up 2.19% and Goldman Sachs that added 1.95%. Travelers led decliners, closing down 0.90%, followed by Exxon Mobil that shed 0.87%, down alongside with oil prices. Holding at record highs, the daily chart for the index maintains the positive tone seen on previous updates with the index far above bullish moving averages and the RSI indicator extending its advance within overbought levels, now at 78. In the shorter term, and according to the 4 hours chart, technical readings also favor the upside, with the RSI indicator also heading north within overbought levels, and the benchmark holding far above all of its moving averages.
Support levels: 21,374 21,332 21,282
Resistance levels: 21,410 21,450 21,490
FTSE100
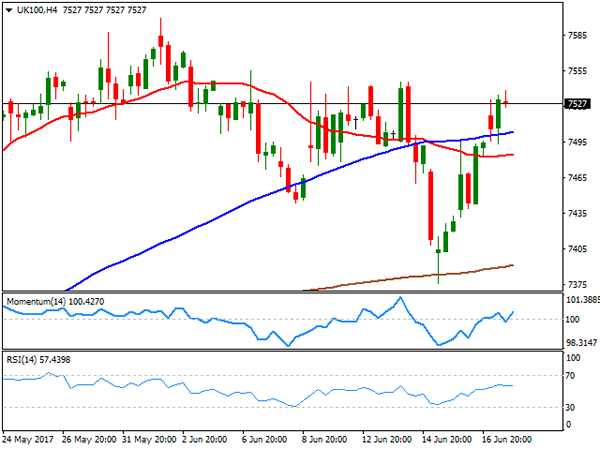
The FTSE 100 advanced 60 points to settle at 7,523.81, boosted by a recovery in the retail sector and the positive tone of equities worldwide. Political relief in Europe, after Greece reached an agreement with its creditors and French Macron locked a parliamentary majority, boosted UK stocks, later supported by a weakening Pound. Within retailers, Sainsbury was the best performer, adding 2.26%, but the winners' list was led by G4S PLC, up 4.58%. Hammerson, on the other hand, led decliners with a 1.33% loss, followed by Paddy Power Belfair that shed 1.10%. The daily chart shows that the index settled above its 20 DMA, while technical indicators turned higher around, with the Momentum still around its mid-line and the RSI anticipating some further advances, currently at 56. In the 4 hours chart, the Momentum indicator bounced from its mid-line, gaining bullish traction, whilst the RSI indicator stands flat around 57, as the index holds well above its moving averages, all of which maintains the risk towards the upside.
Support levels: 7,510 7,478 7,432
Resistance levels: 7,541 7,584 7,620
DAX
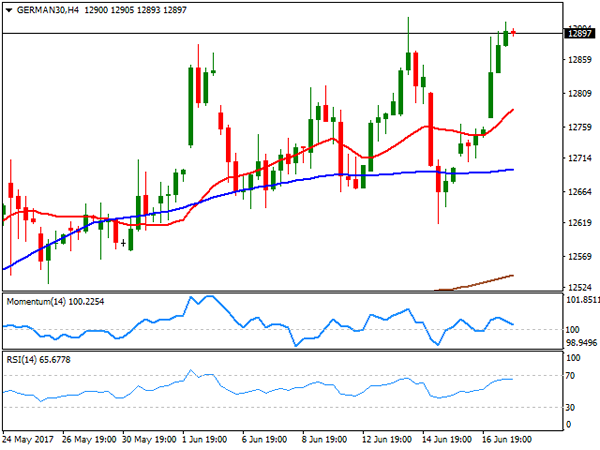
The German DAX advanced 137 points or 1.07% to end at 12,888.95 this Monday, with all major European indexes closing sharply higher, initially fueled by Macron's party parliamentary victory, and later backed by Wall Street's solid performance. Within the German benchmark, only three members closed down, with ProSiebenSat.1 Media being the worst performer, down by 0.39%. Leading winners' list was ThyssenKrupp, up by 2.67%, followed by Deutsche Bank that gained 2.59%. The DAX heads into the Asian opening at 12,906, a record high, maintaining the positive tone seen on previous updates, given that in the daily chart, the 20 DMA slowly turns higher below the current level, whilst technical indicators keep advancing within positive territory. In the shorter term, and according to the 4 hours chart, the Momentum indicator remains stuck around its 100 level, as the advance stalled barely below last week intraday peak of 12,921, while the RSI continues advancing, currently around 66, as the 20 SMA heads north below the current level, all of which supports an upward extension on a break above the mentioned high.
Support levels: 12,871 12,829 12,774
Resistance levels: 12,931 12,960 13,000
Trade Idea : USD/CHF – Hold long entered at 0.9705
USD/CHF - 0.9743
Most recent candlesticks pattern : N/A
Trend : Near term up
Tenkan-Sen level : 0.9751
Kijun-Sen level : 0.9729
Ichimoku cloud top : 0.9739
Ichimoku cloud bottom : 0.9736
Original strategy :
Bought at 0.9705, Target: 0.9805, Stop: 0.9690
Position : - Long at 0.9705
Target : - 0.9805
Stop : - 0.9690
New strategy :
Hold long entered at 0.9705, Target: 0.9805, Stop: 0.9690
Position : - Long at 0.9705
Target : - 0.9805
Stop : - 0.9690
As the greenback found renewed buying interest at 0.9695 and staged a strong rebound, retaining our bullishness and suggesting the pullback from 0.9771 has ended there, hence upside bias remains for a retest of said resistance, break there would extend recent rise from 0.9613 low to resistance at 0.9808 but reckon previous resistance at 0.9825 would hold from here due to near term overbought condition, bring retreat later.
In view of this, we are holding on to our long position entered at 0.9705. Below said support at 0.9695 would defer and risk weakness towards said support at 0.9641 but only break there would abort and revive bearishness, this would also suggest the rebound from 0.9613 has ended instead, bring retest of this level later.

Russia Warning Ignored By Commodities Markets
Russia has warned that U.S. Warplanes over Syria will be considered hostile and is completely ignored by the precious metal and energy markets, which could be bad news for both.
Crude Oil
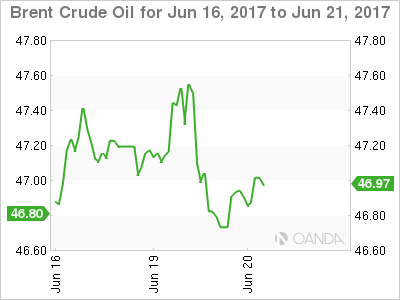
Brent and WTI were back to business as normal overnight, both falling 1.0% in the New York session as the world's supply glut continues to weigh on the front end of the futures curve. A hawkish Fed. Governor Dudley didn't help, his comments sending the U.S. Dollar higher across asset classes leaving crude oil with few friends overnight. Russia's Middle East sabre rattling also failed to boost oil, in itself a surprising development which may come back to haunt markets.
Oil must not negotiate tonight's American Petroleum Institutes (API) Crude Inventories and Gasoline Distillates before we run into tomorrow's main event, the U.S. DOE Crude and Gasoline Inventories. Trades will be approaching these with some trepidation, with a blowout in inventories most likely inducing more pain for producers.
Brent spot trades near its New York low at 46.90 this morning with nearby support at 46.60 and just above the May lows at 46.30. A break of the latter is signalling a potential move to the 43.00 regions. Resistance lies at 47.70 and then 49.00, with both starting to look like distant memories.
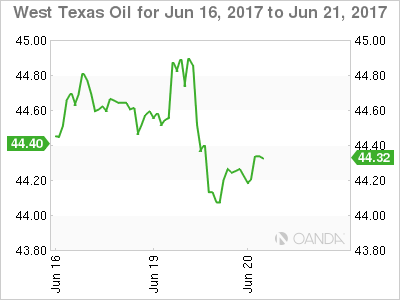
WTI spot trades at 44.20 this morning, again very near the bottom of its recent range. Initial support lies at 44.00 and then the May low at 43.55 followed by 42.00. Resistance is perched at 45.00 and then 46.50.
Gold
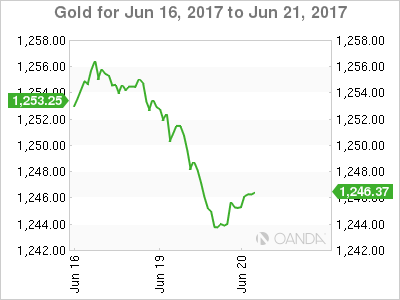
Gold fell another 0.80% overnight continuing gold bulls woes as physical demand from India and China remain on the sidelines. Federal Reserve Governor Dudley started the rot with hawkish comments that saw the U.S. Dollar in general, rally against most asset classes. Much more concerning for Gold bulls should be the ignoring of the market of Russia's threat to treat U.S. military aircraft over Syrian airspace as hostile. It should have been geopolitical risk bread and butter for gold, but instead, it continued dropping.
Gold is currently trading at 1246.60 on the back of low volume Asian physical buying. The 200-day moving average at 1238.50 the next significant support. A daily close below here suggests we could target the May lows around 1214.35.
Gold broke its 100-day moving average at 1246.50. Today this is at 1247.60 which is initial resistance followed by the 1251.50 regions.
Trade Idea : GBP/USD – Sell at 1.2780
GBP/USD - 1.2743
Most recent candlesticks pattern : N/A
Trend : Near term down
Tenkan-Sen level : 1.2741
Kijun-Sen level : 1.2769
Ichimoku cloud top : 1.2776
Ichimoku cloud bottom : 1.2748
Original strategy :
Sell at 1.2780, Target: 1.2680, Stop: 1.2815
Position : -
Target : -
Stop : -
New strategy :
Sell at 1.2780, Target: 1.2680, Stop: 1.2815
Position : -
Target : -
Stop : -
Cable’s retreat after faltering below indicated resistance at 1.2818 suggests consolidation with downside bias would be seen, a sustained breach below 1.2690 support would retain bearishness and add credence to our view that the rebound from last week’s low at 1.2635 has ended, bring further fall to 1.2650, then towards this support later.
In view of this, we are looking to sell cable on recovery as 1.2780-90 should limit upside. Only break of said resistance at 1.2818 would abort and signal the erratic rise from 1.2635 low is still in progress for gain to 1.2845-50 (61.8% Fibonacci retracement of 1.2978-1.2635) but upside should be limited to 1.2870-80 and price should falter below 1.2900, bring another decline later.

Currencies: Dollar Extends Cautious Rebound
Sunrise Market Commentary
- Rates: Fed speakers wildcard, but neutral trading expected
Today's eco calendar is empty suggesting more low volume trading in tight ranges. Speeches by Fed governors are wildcards for trading. Chicago Fed Evans stroke a dovish note overnight, but the US Treasury market didn't reverse losses after 'hawkish comments' by influential NY Fed Dudley yesterday - Currencies: dollar extends cautious rebound
Yesterday, the dollar gained more ground on hawkish Fed comments and on a forceful equity rebound. Central bankers comments and equities will remain the drivers for USD trading today. The USD rebound may slow if Fed governors bring no additional supportive news.
The Sunrise Headlines
- Asian stocks trade mixed with Japan outperforming on weaker yen & strong tech stocks. Other Asian bourses are narrowly mixed and ignore WS strong run yesterday (S&P/Dow fresh record highs).
- China's economic growth is expected to fall below the government's 6 per cent target in 2018 and 2019, according to Fitch, reflecting the increasing challenge of supporting growth given a higher level of indebtedness.
- Oil is little changed at $44.2 a barrel. Crude has now fallen for four weeks straight as U.S. drillers continue to add rigs, blunting OPEC-led efforts to rebalance an oversupplied market.
- Chicago Fed Evans said that the low-inflation environment supports very gradual hikes and slow, pre-set reductions in the BS. He stressed downside risks to the inflation outlook and that the inflation target is not a ceiling.
- Germany PPI was a tad below consensus in March at -0.2% M/M and 2.8% Y/Y, down from 3.4% Y/Y in April. It confirms the general move that inflation is currently rolling over after the sharp rise some months ago.
- Michel Barnier warned Britain that the EU would not make concessions after the first day of Brexit negotiations. EU's chief negotiator replied: 'I am not in a frame of mind to make concessions, or ask for concessions. We are implementing the decision taken by the UK to leave the EU'
- Eco-calendar is again dominated by Fed-speakers (Fischer, Rosengren and Kaplan). There are no other market-important moving data coming out
Currencies: Dollar Extends Cautious Rebound
USD rises on Fed-comments and equity rebound
Trading in the major FX cross rates took a very slow start to the new week. The swings of EUR/USD and USD/JPY were negligible in the morning session. In the US session, the dollar received support from positive comments of Fed's Dudley and from further equity gains. EUR/USD drifted to the mid 1.11 area and closed the session at 1.1149 (from 1.1198). USD/JPY finished the day at 111.53 (from 110.88).
Overnight, Asian equities traded mixed. Japanese stocks outperform supported by an ongoing positive sentiment in the tech sector, nearing the highest level in almost two years. Fed's Evens spoke more cautious than Dudley, but the dollar maintains yesterday's gains against the euro (EUR/USD 1.1155 area) and even gained slightly against the yen (111.70 area). According to the June Minutes, the RBA expects continued growth in employment to reduce spare capacity, but the RBA also monitors risks of rising indebtedness. The Aussie dollar trades with a slightly negative bias, but this is probably still due to yesterday's Moody's downgrade of the banking sector. AUD/USD struggles not to fall below 0.76.
Today, there are again only second tier eco data in the US and Europe (current account). Currency traders will again look for clues from equities and from central bank speakers, including Fed's Fisher, Fed's Rosengren and Fed's Kaplan. Some Fed members turned more cautious, but we expect Fisher to support Yellen's normalisation approach. If so, it might be slightly USD supportive. Asian equities and the US futures indicate an ongoing constructive risk sentiment, but the pace of the rally might slow. The Macron victory is probably fully discounted and we'll have to see how far the tech rebound still has to go.
After last week's relatively hawkish Fed statement, the topside in EUR/USD looked better protected and a cautious sell-on upticks approach was advised. We hold on to that view. However, sustained USD gains need better US eco data, supportive Fed comments and/or higher US yields. The dollar received that support yesterday to some extent. However, there are few high profile data in the US this week. If the equity rally slows, so might the USD rebound. To monitor the USD momentum, we especially keep an eye at USD/JPY. Recently the USD/JPY performance was mediocre even as several equity indices are trading near record levels. The post-Fed performance was a bit more solid but the pair wasn't able to regain any important resistance yet.
Technical picture
The USD/JPY rally ran into resistance in early May. A mini sell-off mid-May made the short-term picture negative, driving the pair further down in the 108.13/114.37 range. The post-Fed USD rebound pushed the pair beyond a first minor resistance at 110.81. A break beyond the 112.13 correction top would improve the ST-picture. The day-to-day sentiment improved of late, but we remain cautious to forecast a U-turn.
Early May, EUR/USD failed to break below the 1.0821/1.0778 support (gap). Poor US data and US political upheaval propelled EUR/USD north of the 1.1023 range top to a corrective top. The pair tested the 1.1300 area going into the FOMC decision, but the test is rejected. So the Trump top/correction top at 1.1300/1.1366 proved to be a solid resistance. USD sentiment will have to become really negative to clear this hurdle. EUR/USD 1.1110 is a first minor support. A return below 1.1023 would indicate that the upside momentum has eased.
EUR/USD: test off 1.1300/66 resistance rejected, but correction remains limited for now
EUR/GBP
Sterling rebound slows
Yesterday, UK's Brexit Minister Davis and EU's Barnier started the formal Brexit negotiations,. The impact on sterling trading was limited. The first official remarks of UK's Davis were reconciliatory and created the impression that the UK aims a softer Brexit than expected before the UK election. However, The jury is still out as the domestic political situation in the UK remains highly uncertain. Silvana Tenreyro was appointed to the BoE MPC to replace Kristin Forbes. She might be more dovish than Forbes. EUR/GBP closed the session little changed at 0.8752.
There are no eco data in the UK today. Sterling traders will keep an eye at a Speech of BoE governor Carney. After last week's vote split BoE vote, markets will look out how much weight Carney will give to the recent inflation uptick. We expect Carney to be rather balanced. A cautious tone might be slightly negative for sterling. Markets will also keep an eye at the comments commenting for the Brexit negotiations. It looks like Europe is determined to hold on to its agenda. The pressure on sterling eased at the end of last week, but we don't expect a sustained rebound.
From a technical point of view, EUR/GBP extensively tested the 0.8854 area (2017 top), but a real break didn't occur. Some consolidation might be on the cards after last week's post BoE EUR/GBP correction. However, the broader technical picture hasn't changed. A return below the 0.8655 correction low would be an indication that the pressure on sterling is easing. Such a break will be difficult. A EUR/GBP buy-on-dips approach is still favoured.
EUR/GBP stabilizes as Brexit negotiations formally start
Fedspeak Boosts The US Dollar
Amid a slow trading day, the speech from NY Fed President, William Dudley helped the US dollar to maintain its gains. Dudley said that while inflation was lower than what policy makers wanted, he said that the labor market conditions continue to tighten. He was hopeful that wages would pick up which in turn will push inflation higher.
The US dollar index rose nearly 0.4% on the day, rising to 97.54. The UK - EU began the Brexit negotiations yesterday. The British pound was plagued by the latest ongoing incidents in the UK and eventually closed weaker on the day.
Looking ahead, speeches from the FOMC members continue, alongside a scheduled speech from SNB chairman, Thomas Jordan and the BoE Governor, Carney. On the economic front, the markets are looking to another quiet day of trading.
EURUSD intraday analysis
EURUSD (1.1155): EURUSD opened close to 1.1200 yesterday, but price action eventually pushed the currency pair to close weaker on the day. In the near term, EURUSD could be seen testing the resistance level of 1.1171. Establishing resistance at this previous support level could signal further downside in price. EURUSD could be seen testing the lower support at 1.1018 - 1.0995. However, watch for the resistance level at a failure to reverse could signal sideways price action or a potential move to the upside. Above 1.1171, EURUSD could test the previous highs near 1.1300.
GBPUSD intraday analysis
GBPUSD (1.2736): The British pound extended the declines after testing 1.2800 resistance. The resistance level has been formed here with the previous four days unable to break above this level. Further downside is, therefore, expected as we see the 1.2600 support level coming into focus. Below 1.2600, further downside could see price action fall towards 1.2400 where a test of support is pending. On the 4-hour chart, price action continues to remain very volatile with prices trading sideways within 1.2800 and 1.2650 levels.
USDJPY intraday analysis
USDJPY (111.68): USDJPY managed to post gains with a bullish close yesterday. This comes above the doji high and price action is seen currently testing the daily resistance level of 111.61. A breakout above this resistance is required for further upside in price. However, with the resistance level staying strong, there is a potential for USDJPY to possibly consolidate its gains with price action likely to slip back. Support at 110.52 is seen on the 4-hour chart where USDJPY could fall back to. Above 111.61 - 112.00, USDJPY will be seen rising to 113.00.