
Sample Category Title
APAC EM FX
Hard to ignore USD bullish price action overnight after FOMC Vice Chair Dudley cementing Dr Yellen's post-FOMC hawkish retort. Triggering dollar buying as US yields pushed higher.
But on the other hand, it's equally as difficult to ignore the latest trends in US economic data which has been middling at best and present a clear and present danger about Fed policy normalisation running ahead of the curve. However, given the light US economic calendar, the dollar bulls should continue to enjoy the limelight on the hawkish Fed pivot
Locally much of the focus is squarely on China as the market viewed today's CNY fix as the first real policy test for counter cycle fixing mechanism as dollar demand has significantly perked up and the CNH has been trading aggressively weaker this week.
In an attempt to keep investor sentiment buoyant nearing tonight's MSCI decision the Pboc has been providing liquidity injections which have supported risk sentiment.
Given the hawkish Fed pivot, regional currencies weaker breaking above near term ranges reversing yesterday's trend where good buying occurred in INR, KRW and TWD.
Price action, however, has been stable and more consolidative in nature as opposed to a trend reversal. The big picture remains intact with the overnight recovery in the US tech sector setting the stage l for tech exporters such as KRW. And given the Feds are unlikely to move rates aggressively higher, the high yielder like the INR remain favoured. The MYR is trading more USD sensitive this morning while picking up little support from oil prices which continue to struggle. However, the broader more favourable narrative for Bond and Equity inflows to remain intact should ultimately lead the USDMYR lower again
The PHP is trading above the psychological 50.00 level as the market positions for Thursday rate decision , suggesting the BSP may stay the course
Market Morning Briefing: Euro Is Trading Lower
STOCKS
Dow (21528.99, +0.68%) rose with a gap up and has moved up towards our target of 21600 as expected. Near term looks bullish and there could be potential towards 22000 in the longer run.
Dax (12888.95, +1.07%) has also moved up to the upper limit of our range of 12900-12600 mentioned yesterday and in case it breaks above 12900, we may expect the rise to extend towards 13000-13100 levels.
Shanghai (3139.34, -0.16%) is almost stable and is rising gradually with some dips in an overall near term up trend. A rise towards 3175 is still on the cards while above 3120. Near term looks bullish.
Nikkei (20287.67, +1.10%) is also stable and could spend another couple of sessions in the range of 20250-19700 before breaking on either side. We need to wait for confirmation from price movement.
Nifty (9657.55, +0.72%) saw a good bounce yesterday in line with our expectations and while the support at 9550 holds, there is scope of seeing a rise towards 9700-9750 or higher in the near term.
COMMODITIES
Bullion is trading weak against the Dollar just now.Gold (1246) is trading just above immediate support at 1245. A break below 1245 is necessary to turn bearish towards 1231 for the near term else a bounce back could take it higher towards 1262. Gold is oversold in near term time frame thus it could bounce from current levels and remain range bound within 1245-1262 for few days.
Silver (16.54) is almost stable and is trading in the middle of the 16.20-90 channels. A rise towards 16.90 is on the cards in the coming sessions due to oversold condition.
Copper (2.57) may bounce from 2.55 and remain within 2.55-2.67 for couple of days. We wait for further directional clarity on a break on either side of 2.55 and 2.67 levels.
Brent (46.93) and WTI (44.19) are hovering round their respective supports of 46.68 and 44.Markets are oversold in near term time frame and If Brent and WTI manage to close above their supports in the next couple of sessions, an attempt for 50.50 and 46.50 can be seen. Market is waiting for tomorrow’s U.S Weekly crude oil inventory data. Only a higher than expected (-1.2 M B) could be beneficial for Brent and WTI. Otherwise a surplus or a less than expected shortage could bring the bearish possibilities again into consideration.
FOREX
Dollar Index (97.32) is in a range of 96.30-97.80 for the third consecutive week. If the interim support band of 97.10-96.80 holds, then it may rise above 97.80 by the end of the week.
Euro (1.1154) is trading lower as we had mentioned yesterday that "the selling pressure may be back near the resistance of 1.1215-35 and the lower end of the 3-week range of 1.1100-1.1300 may be retested". If it will close below 1.1160 levels today, then we might see 1.1100 levels by end if this week.
Dollar-Yen (111.66) has risen towards 112 in line with what we had mentioned yesterday. Our initial target of 112 and then 113 remains intact for the coming sessions. Near term looks bullish.
Pound (1.27348) is in a corrective phase as mentioned yesterday. While below 1.2850, we are open to a test of 1.26 or lower in the near term before a fresh bounce is seen.
Aussie (0.7590) is trading slightly lower today. Immediate support is seen near 0.7570-0.7560 region which if holds, could take it back towards 0.76 or higher. We could see stable movement in the next 2-3 sessions.
Dollar-Rupee (64.43) has bounced back from levels near 64.30 and the current rise may take the currency pair towards 64.55/60 before again coming off towards 64.30. Ranged movement within the broad 64.60-64.30 region is possible in the near term.
INTEREST RATES
The US yields are rising and looks potentially bullish in the near term the 10YR (2.18%) could rise towards 2.25% in the near term while the 5Yr (1.78%) and the 30Yr (2.78%) can move up to 1.86% and 2.85% respectively.
The US 10-5Yr (0.40%) has fallen sharply in the last couple of sessions and is just above important support levels. While support holds, we could see a bounce back towards 0.42% in the medium term. This could possibly indicate that the 10YR could move up faster compared to the 5Yr in the coming sessions.
The US 30-5Yr (0.99%) seems to have broken the long term support and in case this sustains, the yield differential could fall off towards 0.90% or lower in the near term.
The German-Us 2Yr (-2.01%) is testing the earlier resistance turned support and if that holds, we could see a bounce back towards -1.95% taking the Euro up with itself. We need to see if the yield spread moves back below the support level or bounces back from there.
Aussie Dollar: Central Banks In Focus
Central Banks Remain in Focus
After a somewhat sluggish start to the week, Fed Dudley views on inflation confirm a unified Fed willing to look through the soft Q1 inflation print provided a spark to the dollar bulls. But given that Dudley’s public edict is almost always fully in sync with that of Yellen, anything other would have been the shocker. While the markets remain dollar bid tentatively, there remains an air of uncertainty on this move as the USD reality check is likely only one bad US economic data print away.
What had the makings of a very productive trading week for the Aussie dollar was dealt a blow after Moody’s downgraded a group of the leading Australian banks. Discussion around the downgrade has overshadowed this morning RBA minutes and with the USD trading buoyant on hawkish Fed speak, theses external developments should continue to weigh on near-term sentiment
Nonetheless, the Aussie remains supported on the dips as the downgrade reaction was far from an off the cliff scenario. And while credit rating agency negative downgrades can have a short-term impact, they seldom have a lasting influence on currency markets even more so given the market’s recent pivot to all things central banks which should remain the centre of attention throughout the day
Risk appetite appears to be holding firm after Wall Street’s strong performance overnight in Tech stocks and investors overall enthusiasm over the state of the US economy. This
Nothing too worrisome for Aussie bulls in this morning RBA minutes as the Central Bank’s views remain consistent and steady but worth noting the minutes did not take into consideration their views of the bumper Jobs report last week
USDJPY – Extends Upside Pressure On Bullish Bias
USDJPY - The pair continues to face upside pressure as it closed higher on Monday. On the downside, support comes in at the 111.00 level where a break if seen will aim at the 110.50 level. A cut through here will turn focus to the 110.00 level and possibly lower towards the 109.50 level. On the upside, resistance resides at the 112.00 level. Further out, we envisage a possible move towards the 112.50 level. Further out, resistance resides at the 113.00 level with a turn above here aiming at the 113.50 level. On the whole, USDJPY looks vulnerable to the downside.
GBP/USD Support/Resistance Level Holding
After having watched GBP/USD retest this support/resistance level for a week now, price action is looking like giving us the bearish confirmation we have been looking for.
Bringing up a Cable daily chart on your MT4 platform, you can see that price has failed to make any significant break higher and after printing a couple of indecision candles within the resistance zone, we have most recently closed with both a long wick and bearish body:
GBP/USD Daily:
From here, I want you to zoom into an intraday chart and start to think about the trading opportunity that this higher time frame resistance level has presented us.
Can you see any pull backs into short term support turned resistance? How are you looking to trade this level and is it even from the short side?
Posting intraday levels on this blog starts to flirt within the domain of trade recommendations, which obviously is NOT what this blog is all about. I want to help identify the major levels to look out for and then open up the intraday levels to discussion on social media.
These intraday levels have to come from you!
Dudley Do-Right For The Dollar Bulls
Dudley Do-Right for the dollar bulls
In the absence of any meaningful economic data overnight, the market’s focus was on Fed member Dudley who bolstered the case for Fed policy normalisation. Hitting the right chords and sounding dismissive about the recent slowdown in inflation, an unrepentantly hawkish Dudley provided the USD bulls with enough fodder to re-engage dollar longs tentatively. DXY moved back towards last week’s highs as US 10y yields based and pivoted higher throughout the NY session, and Gold predictably pointed lower on the stronger USD
Risk sentiment held well as NDX was the big gainer closing at +1.6 % as buyers resurfaced after selling dominated for the expiry on Friday.
US Dollar
After a somewhat sluggish start to the week, Fed Dudley views on inflation confirmed a unified Fed willing to look through the soft Q1 inflation print, provided a spark to the dollar bulls. But given that Dudley’s public edict is almost always fully in sync with that of Yellen, anything other would have been the shocker. While the markets remain dollar bid tentatively, there remains an air of uncertainty on this move as the USD reality check is likely only one bad US economic data print away.
Japanese Yen
USDJPY continues rallying in early APAC trade after Fed member Dudley comments struck a chord with investors Even Russia’s threat to target US warplanes in Syrian airspace failed to ruffle sentiment or cause any risk averse demand for JPY. Given the markets are still short USD, the headlines are likely to create a bit of discomfort as the short term momentum is tentatively USD bullish as a unified Fed is steers the policy ship
British Pound
The market remains wrapped around the on-going Brexit negotiations. There remain many obstacles and hurdles for the UK economy, and the initiation of the negotiations will be substantial, but the general tone at this stage is what’s key.
USD/CAD Canadian Dollar Flat As USD Surges And Oil Falls
The Canadian dollar traded in a tight range on Monday. Last week the loonie touched 18 month highs after Bank of Canada (BoC) Deputy Governor Carolyn Wilkins and Governor Stephen Poloz made comments suggesting the central bank could be ready to hike interest rates sooner than the market was anticipating. The statements were made one day apart in usually non-eventful business school setting and a radio interview. The CAD ended the week on a positive note, despite the U.S. Federal Reserve raising the benchmark rate for the second time this year. Political uncertainty offset the gains even though Fed Chair Janet Yellen was hawkish on growth.
Fed members will be one of the market highlights during a week that features few major economic releases. New York Fed President Dudley supported the decision from the US central bank and expects further rate hikes, despite the softening of inflation.
Oil is trading lower ahead of Wednesday’s US crude inventories report. The rise of US production has all but cancelled the benefits to the price of crude that the Organization of the Petroleum Exporting Countries (OPEC) and other producers wished to achieve with their historic production cut agreement.
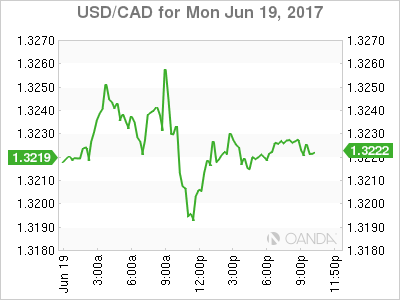
The USD/CAD gained 0.054 percent on Monday. The currency pair is trading at 1.3220 as the USD is showing signs of life after a difficult week where despite the Fed hiking rates the uncertainty surrounding the Trump Administration made it impossible for the greenback to capitalize on the hawkish rhetoric.
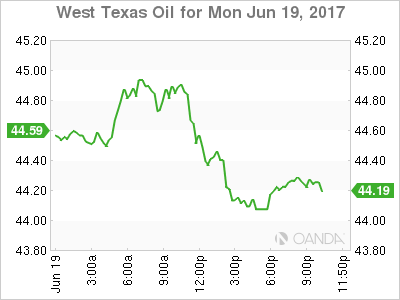
Oil prices fell by 0.701 percent in the last 24 hours. The price of West Texas Intermediate is trading at $44.33 after news that Nigeria and Libya are soon to come back to full production following several disruptions in supply. The two OPEC members were not part of the production cut agreement given the problems they had with their production pipeline. The return of the two producers to full force could be temporary given the fragile stability in both nations, but in the short term could hurt crude prices driving them even lower.
Last week the weekly inventories of crude in the US fell by 1.7 million when a 2.3 million drawdown had been expected. The biggest surprise came in a large buildup of gasoline when a contraction was expected. The oil market has been guided by the weekly inventory numbers as the best efforts of the OPEC to reduce supply appear to have reached their limit as the US has ramped up production and keeps investing in new technology.
Market events to watch this week:
Tuesday, June 20
2:30 am CHF SNB Chairman Jordan Speaks
4:45 am CHF SNB Chairman Jordan Speaks
Wednesday, June 21
10:30 am USD Crude Oil Inventories
4:00 pm NZD RBNZ Rate Statement
5:00 pm NZD Official Cash Rate
Thursday, June 22
8:30 am CAD Core Retail Sales m/m
8:30 am USD Unemployment Claims
Friday, June 23
8:30 am CAD CPI m/m
Gold Drops To 5-Week Low As Dudley Sends Hawkish Message
Gold has started the new trading week with losses. In North American trade, XAU/USD is down 0.49%, with spot gold trading at $1248.74 per ounce. On the release front, there are no economic indicators. The sole events on the schedule are comments from FOMC members William Dudley and Charles Evans.
Gold prices dipped last week after the Fed's hawkish rate statement, and the metal has started the week with losses, again courtesy of the FOMC. Earlier in the day, Federal Reserve of New York President Charles Dudley cautioned the Fed against halting its current tightening cycle. Dudley said that the economy was performing well, and reiterating the sentiment expressed in the rate statement, Dudley said that he was not concerned with inflation levels, which are at 1.5 percent (well below the Fed's target of 2.0%). Dudley's upbeat remarks have boosted the dollar and have pushed gold prices to their lowest level since May 15.
Friday's US releases were a disappointment, as construction and consumer confidence reports missed expectations. Building Permits dropped to 1.17 million, its lowest level since August 2016. Housing Starts were also week, as the reading of 1.09 million marked the lowest since November 2016. There is concern that the soft construction numbers could weigh on second-quarter growth. There was more bad news from UoM Consumer Sentiment, which dipped to 94.7 in May, marking a 7-month low. This is significant, as it is the indicator's lowest reading since President Trump took office, and points to consumer unease with how the US economy is being handled. There are troubling signs that the June UoM report could be even lower, coming after the Comey testimony which has damaged Trump's credibility even further.
Dollar Slow To Warm To Hawks
The market is seemingly saying, 'we've been burned by this before' as the dollar reluctantly rises on optimism from the Fed. USD led the way on Monday while the yen lagged. The central bank calendar is busy in the day ahead. CADJPY Premium trade will be kept as is but members are free to adjust the stop.
The Fed's Dudley took center stage on Monday as the market struggles to anticipate what's next from the FOMC. The market is pricing in just a 21% chance of a hike in Sept and 43.5% in December. According to the NY Fed chief, the outlook is far rosier than that. He said he was 'very confident' in the economic expansion forecast wage growth would quicken. He showed none of the caution we heard from Kaplan Friday.
The dollar initially climbed 15 pips on his comments but a steady bid continued through the day that pushed USD/JPY up 66 pips and EUR/USD down to 1.1150. Both moves were enough to erase Friday's action.
The slow grind underscores the acrimonious history the market has with Fed hawks. The Fed has overestimated growth and inflation every year since the crisis. To start the year, the in-vogue trade was reflation but it's been a dud.
So the question is to bet on recent history and or bet on the Fed getting it right this time. The lack of conviction in both camps is going to make it a back-and-forth battle as the data rolls in.
What's especially interesting is that other central banks have increasingly similar views as the Fed. The minutes of the June RBA meeting are due at 0130 GMT and are likely to highlight a similar stance. At that meeting, Lowe brushed aside a weak Q1 and forecast better growth ahead. AUD has been a strong performer since.
The minutes are part of a day with a heavy central bank focus. The PBOC's Zhou will speak 30 minutes earlier and later highlights include Carney's Mansion House speech along with the Fed's Fischer and Rosengren.
Elliott Wave Trade Ideas Performance Update
2 positions were entered last week with total profit of 200 points and the positions are listed below.
9 Jun : USD/CAD - Short at 1.3500, exited at 1.3300 (+ 200 points)
16 Jun : GBP/USD - Short at 1.2750,
| AUD EUR/JPY EUR/GBP CAD GBP GBPJPY
Jan - 15 -275 - 35 -120
Feb + 140 -17 - 40 +11
Mar - 20 +115 +132 - 19
Apr + 30 - 40 +120 + 45
May - 55 +100 - 60 -65 -60
Jun + 1 + 10 +20 +200
Jul
Aug
Sep
Oct
Nov
Dec
Y-T-D + 136 - 232 +127 +298 -65 +185