
Sample Category Title
Trade Idea Update: GBP/USD – Stand aside
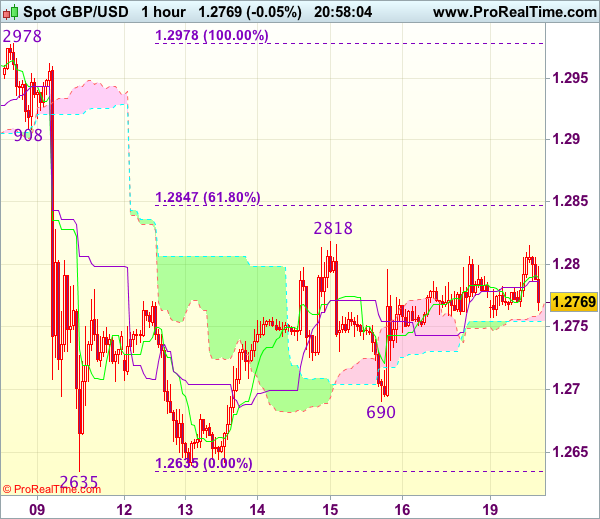
GBP/USD - 1.2770
New strategy :
Stand aside
Position : -
Target : -
Stop : -
The British pound has traded narrowly after faltering below resistance at 1.2818, retaining our view that further sideways trading would be seen and cable needs to penetrate said resistance at 1.2818 to signal the erratic rise from 1.2635 low is still in progress and may extend gain to 1.2845-50 (61.8% Fibonacci retracement of 1.2978-1.2635) but upside should be limited to 1.2870-80 and price should falter below 1.2900, bring another decline later.
In view of this, would not chase this rise here and would be prudent to sell cable on further subsequent recovery, Below 1.2720-25 would suggest an intra-day top is formed, bring test of indicated support at 1.2690 but break there is needed to revive bearishness and signal the rebound from 1.2635 has ended, bring further fall to 1.2650, then towards said support at 1.2635.
Trade Idea Update: EUR/USD – Sell at 1.1235
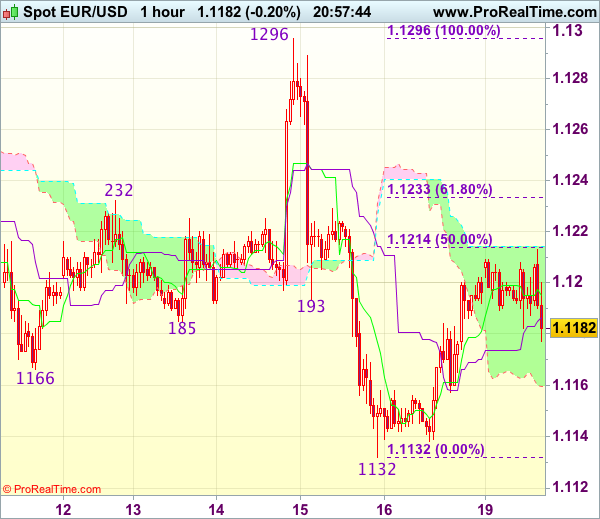
EUR/USD - 1.1185
Original strategy :
Sell at 1.1235, Target: 1.1135, Stop: 1.1270
Position : -
Target : -
Stop : -
New strategy :
Sell at 1.1235, Target: 1.1135, Stop: 1.1270
Position : -
Target : -
Stop : -
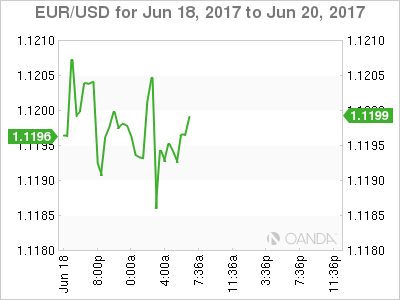
As the single currency has continued trading with a firm undertone and near term upside risk remains for the rebound from 1.1132 (last week’s low) to extend gain towards 1.1230-35 (61.8% Fibonacci retracement of 1.1296-1.1132), however, if our view that top has been formed at 1.1296 is correct, upside should be limited and bring retreat later, below 1.1155-60 would bring retest of 1.1132, break there would extend recent decline from 1.1296 top to previous support at 1.1109.
In view of this, we are looking to sell euro on further recovery as 1.1230-35 (61.8% Fibonacci retracement of 1.1296-1.1132) should limit upside and bring another decline. Above 1.1260-70 would defer and risk a stronger rebound but price should falter well below said resistance at 1.1296, bring another decline later.
Trade Idea Update: USD/JPY – Buy at 110.35
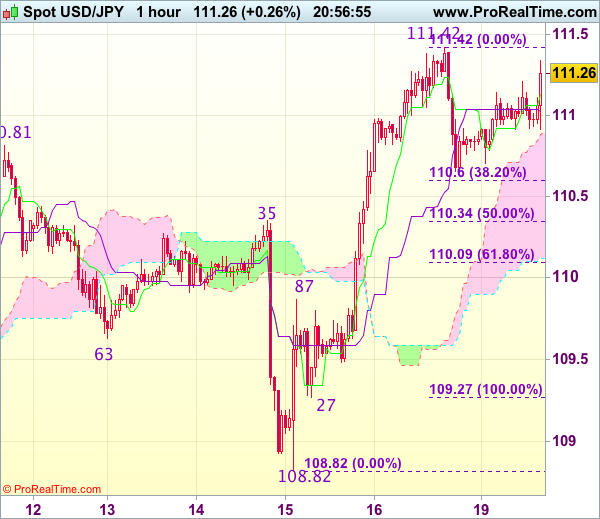
USD/JPY - 111.20
Original strategy :
Buy at 110.35, Target: 111.35, Stop: 110.00
Position : -
Target : -
Stop : -
New strategy :
Buy at 110.35, Target: 111.35, Stop: 110.00
Position : -
Target : -
Stop : -
Dollar’s retreat after meeting resistance at 111.42 has retained our view that consolidation below this level would be seen and pullback to 110.30-35 (50% Fibonacci retracement of 109.27-111.42) cannot be ruled out, however, renewed buying interest should emerge there and bring rebound later, above 111.25-30 would bring retest of 111.42 but break there is needed to confirm the rise from 108.82 low has resumed for retracement of recent decline from 114.37 to 111.60 (50% Fibonacci retracement of 114.37-108.82) and then test of previous resistance at 111.71 but price should falter well below another resistance at 112.13.
In view of this, we are looking to buy dollar on pullback but one should exit on next rise. Below 110.05-10 (61.8% Fibonacci retracement of 109.27-111.42) would abort and signal top has been formed, bring further fall to 109.85-90 and possibly towards 109.50 but support at 109.27 should remain intact.
DAX Gains Ground as Macron Sweeps to Majority
The DAX index has started the week with gains, as the index is up 0.86 percent. The index is currently at 12,856.28 points. There are no economic indicators out of the eurozone or Germany. The sole event is a speech from Jens Weidmann, head of the German central bank. On Tuesday, Germany releases PPI and the eurozone publishes Current Account.
The political landscape has finally settled in France, after two months of elections. On Sunday, President Emmanuel Macron easily won a majority in presidential elections. Macron's En March party won about 61% of the vote, somewhat lower than recent polls, which had predicted that Macron would win as much as 80% of the seats in the National Assembly. Still, it's an impressive victory for the young and charismatic Macron, whose party is barely a year old. Macron ran on a pro-business agenda, promising to relax regulations and reform labor laws in order to make the French economy more competitive, but France's powerful trade unions are sure to push back against any legislation that will take away rights or benefits from workers. The unions have not shied away from going on strike or organizing mass protests in past conflicts with the government, so Macron will be hard-pressed to implement reforms while keeping peace on the labor front.
A full year after the Brexit referendum, which stunned Britain and the continent, British negotiators meet with their European counterparts on Monday. A month ago, Prime Minister Theresa May was confidently peddling a hard Brexit, putting Europe on notice that if she didn't like what the Europeans were offering, the UK would leave without a deal. However, May was humiliated in the UK election, and will be forced to govern with a minority government that is dependent on the support of a small Irish party. May's defiant tone has been replaced by a more conciliatory Philip Hammond, the British finance minister. Hammond has said that he wants a business-friendly and pragmatic Brexit and that no deal would be bad for the UK, although he won't accept an agreement that is aimed at punishing Britain. As for the Europeans, they have insisted that there will be no negotiations about a new trade deal, prior to progress being made on three key issues: (1) the legal status of EU citizens in the UK; (2) the status of the border between Ireland and Northern Ireland; and (3) the financial obligations of the UK to the EU. On the weekend, the EU's Economic and Financial Affairs Commissioner Pierre Moscovici, said that the European position was not 'hard ' or 'soft'. but rather 'amicable and firm'. There is little doubt that the EU will be firm, but given the bad blood between the two sides, it will be a pleasant surprise if the negotiations are indeed 'amicable'.
Brexit Talks Start Today
The Brexit talks officially start today, (June 19 2017) with the UK Brexit Secretary David Davis meeting the chief EU negotiator Michel Barnier at the European Commission's Berlaymont headquarters. These negotiations signal the beginning of the end of the UK's 44 years of EU membership.
The UK and the EU are now starting on the two-year negotiation process during which they will agree the terms on which Britain leaves the European Union and determine its future relationship with the continent.
Negotiations start exactly one year after Britain shocked the world by voting to exit the European Union and nearly three months since Prime Minister Theresa May locked the country into a two-year countdown to Brexit in March 2019. The future remains unclear however, with May's own immediate political survival now in doubt after she lost her majority in a snap election, ten days ago.
The two teams are due to meet for the first time today and the main aim of the meeting is to agree the format of future talks and to build trust. Officials on both sides are playing down expectations of what can be achieved in one day.
EU diplomats hope this first meeting and a summit in Brussels later this week, where May will be present but will not negotiate with EU leaders, can improve the atmosphere after recent spiky comments from both sides.
Davis said that the hard work begins now, adding that he wanted a deal that worked for both sides. The talks will be difficult, but he is expecting that all points will be approached in a constructive way.
Davis's agreement to Monday's agenda has led some EU officials to believe that May's government may at last coming around to Brussels' view of how the negotiations should be run.
Britain's Boris Johnson said that he looked forward to “a happy revolution” in relations that would be good for Britain and the rest of Europe, pointing out that the most important thing for both sides is to think about their new partnership, the deep and special partnership that the UK wants to build with their friends.
While Brexit supporters have strongly backed May's proposed clean break with the single market and customs union, finance minister Philip Hammond and others have this month echoed calls by businesses for less of a “hard Brexit” and retaining closer customs ties.
With discontent in Scotland and a troubled Northern Ireland, which faces a new EU border across the divided island, Brexit now poses a new threat to the integrity of the United Kingdom.
The priorities for Brussels will be the rights of the 3 million EU citizens in Britain as well as the tens of billions of Euros it says London will owe on its departure.
Brussels is also resisting British demands for immediate talks on a future free trade arrangement. The EU insists that trade talks should wait until an outline agreement on divorce terms has been agreed, ideally by the end of this year. In any case, EU officials say, London no longer seems sure of what trade arrangements it will ask for.
On the other side, May says she wants a deal on the rights of the million British expatriates in the EU, and continues to insist that her Brexit plan remains unchanged despite recent events.
The UK Government has announced that due to the amount of legislative work involved in the Brexit preparations, the next parliamentary session will be extended from 1 year to 2 years. The plans for the next 2 years of government are due to be presented to the UK parliament in the Queen's speech on Wednesday and this should make the Government's position clearer, following the recent speculation of a softening in the approach. This will be the next big test for May's Government because if the contents of the Queen's speech are not approved by MP's then a further period of uncertainly and internal negotiations will need to take place with the possibility of another general election if no agreement can be reached.
We will be closely monitoring these important negotiations over the coming months and will bring you updates on all the major events as they unfold.
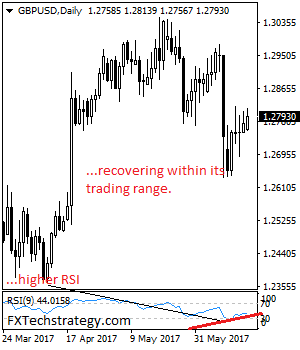
GBPUSD – Recovering Within Its Consolidation Range
GBPUSD - The pair continues to face consolidation short term though recovering with its range. Support lies at the 1.2700 level where a break will turn attention to the 1.2650 level. Further down, support lies at the 1.2600 level. Below here will set the stage for more weakness towards the 1.2550 level. Conversely, resistance stands at the 1.2800 levels with a turn above here allowing more strength to build up towards the 1.2850 level. Further out, resistance resides at the 1.2900 level followed by the 1.2950 level. On the whole, GBPUSD continues to face consolidation threats despite price recovery.
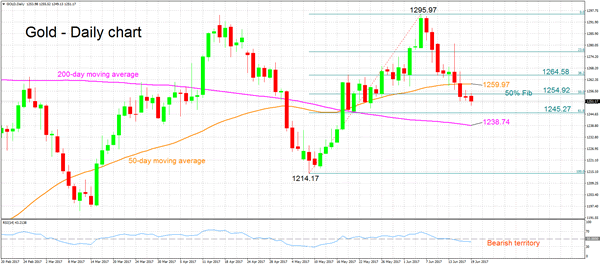
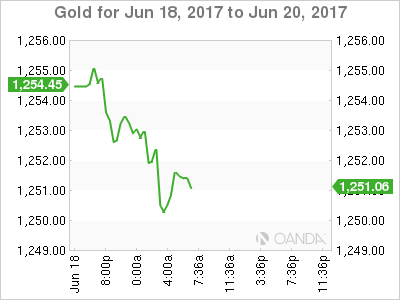
Gold Short-Term Bearish At 3-Week Low
Gold continued declining in today's trading, retracing more than 50% of the May 9 to June 6 upleg while extending the downtrend that started after the first week of June. Today's down movement has led the precious metal to fall to the more than three-week low of 1249.13.
The short-term sentiment as indicated by the RSI is negative as the indicator is in bearish territory below the 50 neutral-perceived threshold at 43. Moreover, RSI is currently downward sloping.
The 50% Fibonacci retracement level (May 9 – June 6 upleg) at 1254.92 comes into focus as an immediate intra-day resistance point. This level was briefly violated earlier in the day. If the price moves higher, the 50-day moving average (MA), currently at 1259.97, is likely to act as a barrier to the upside as well.
On the downside, the 61.8% Fibonacci mark at 1245.27 could offer support. The area around this point has been fairly congested in the recent past and could hold some significance. Should the price head lower, the 200-day MA at 1238.74 might provide additional support.
Despite the recent down movement, the medium-term picture is currently looking neutral to bullish with the precious metal being in an overall uptrend since the start of the year.
Overall, the short-term outlook is bearish and the medium-term is neutral to bullish.
Forex Technical Analysis: EUR/USD, USD/JPY, GBP/USD
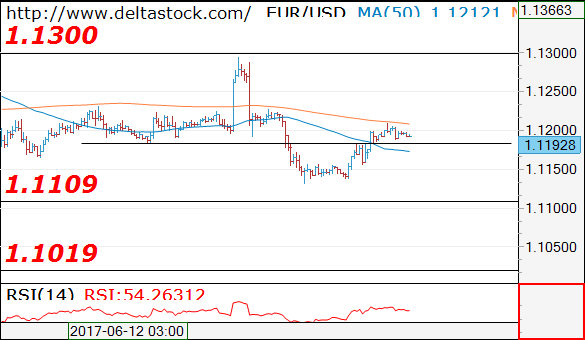
EUR/USD
Current level - 1.1192
Despite today's climb above 1.1180 resistance, the outlook here remains bearish, for a slide towards 1.1109 low, en route to 1.1020 major support area.
| Resistance | Support | ||
| intraday | intraweek | intraday | intraweek |
| 1.1230 | 1.1360 | 1.1108 | 1.1022 |
| 1.1300 | 1.1610 | 1.1020 | 1.0838 |
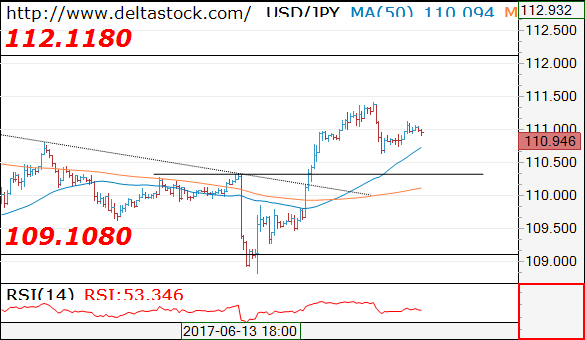
USD/JPY
Current level - 110.94
There is a risk of a second leg downwards, to 110.30, before another bounce towards 112.10 resistance area.
| Resistance | Support | ||
| intraday | intraweek | intraday | intraweek |
| 111.40 | 112.10 | 110.30 | 109.08 |
| 112.10 | 114.30 | 109.10 | 108.12 |
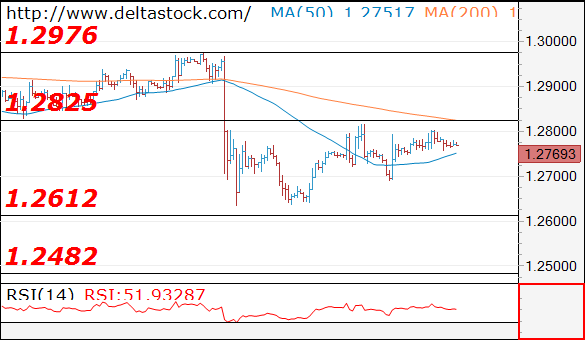
GBP/USD
Current level - 1.2769
The outlook remains bearish below 1.2825 resistance area, for a slide towards 1.2610 zone.
| Resistance | Support | ||
| intraday | intraweek | intraday | intraweek |
| 1.2830 | 1.2970 | 1.2685 | 1.2610 |
| 1.2880 | 1.3050 | 1.2610 | 1.2480 |
Sterling Steady Pre-Brexit Talks
Last week saw a plethora of bad economic news stateside, starting with continued weakness in inflation, consumer confidence, housing and manufacturing. The Fed followed their script and removed the expected amount of stimulus on the assumption that inflation and the U.S economy will improve.
This week should be much quieter on the central bank and economic fundamental front with only the Reserve Bank of New Zealand (RBNZ) announcing its monetary policy decision (June 21) – expected to maintain at +1.75%. In the U.S, flash June PMI surveys will give investors their first look at this month's and Q2 end data. North of the border, Canada releases its May consumer price data and April's retail sales.
Note: With the loonie (C$1.3242) on such a tear of late and with confidence growing in the Canadian economy, the data will be watched carefully for implications to Bank of Canada (BoC) policy.
Among other events, investors will be focused on the start of formal Brexit negotiations.
Note: Chicago Fed President Charles Evans and Fed Bank of New York President William Dudley are both due to speak in New York Monday. They are the first of a slew of Fed appearances scheduled for this week including Vice Chairman Stanley Fischer and Governor Jerome Powell.
1. Global equity markets start the week higher
Financial markets were unshaken on news a vehicle had rammed into a crowd outside a mosque in north London overnight in another suspected terrorist attack.
In Japan, the Nikkei Stock Average closed up +0.6%, with a softer yen (¥111.03) aiding the move and this despite Japan reporting its first trade deficit since January. The broader Topix index jumped +0.6%.
In Hong Kong, the Hang Seng Index gained +1.2% after its first weekly decline in six-weeks. The Shanghai Composite Index rose +0.7%.
Down-under, Australia's S&P/ASX 200 Index rose +0.5%.
Note: MSCI will announce this week whether it will approve Chinese-listed stocks in its global benchmarks. The +$6.8T 'onshore' market is the world's second largest and accounts for +9% of global stock value – the decision is expected Tuesday after the bell.
In Europe, indices are trading sharply higher with the French CAC slightly outperforming after a comprehensive victory for French President Emmanuel Macrons party in the parliamentary elections.
U.S stocks are set to open in the 'black' (+0.3%).
Indices: Stoxx 600 +0.75% at 391.5, FTSE +0.6% at 7510, DAX +1.0% at 12875, CAC-40 +1.0% at 5316, IBEX-35 +0.9% at 10859, FTSE MIB +0.2% at 20989, SMI +0.3% at 8994, S&P 500 Futures +0.3%.
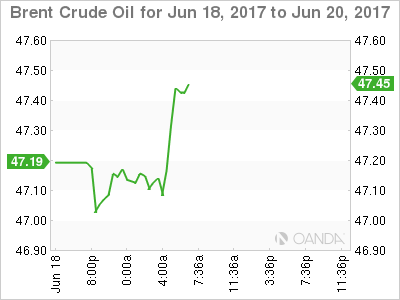
2. Oil slips as U.S rigs rise, gold lower
Oil prices are lower overnight, weighed down by an expansion in U.S drilling that has helped to maintain high global supplies despite OPEC's initiative to tighten the market by cutting production.
Also, signs of faltering demand are also weakening global sentiment.
Brent crude futures are down -16c at +$47.21 per barrel, while U.S West Texas Intermediate (WTI) crude futures are down -19c at +$44.55 per barrel.
Note: Prices for both benchmarks are down -14% since late May, when OPEC formally extended its pledge to cut output by -1.8m bpd for an extra nine months.
Data out Friday afternoon in the U.S showed another week of rising active U.S oil-drilling rigs, bringing the count to +747, the most since April 2015.
Even at such low price levels, questions on the U.S 'shale's' ability to keep profitable are being asked.
Data also shows that supplies from OPEC also jumped last month, driven by recovering output from Libya and Nigeria, which were exempt from cuts due to unrest that had hindered their output.
Gold has hit a four-week low ahead of the U.S open (down -0.2% at +$1,251 an ounce, up from an earlier +$1,248.63, its lowest since May 24) as the dollar held firm and the market waits for comments from a the Fed's Evans and Dudley this morning. Prices are being supported by the start of Brexit talks in Europe.
3. Global yields little changed
Yesterday, France's legislative elections confirmed an outright majority for French President Emmanuel Macron's centrist La République en Marche and its centrist ally.
Note: President Macron's “En Marche” party tool 361 out of the 577 seats in the National Assembly, while Marine Le Pen's National Front party took at least 6-7 seats.
There was little reaction to the election in government bond markets. The spread between France (OAT's) and Germany's 10-year Bund yields tightened slightly, to around +0.35 bps.
Note: The spread had blown out during the country's presidential campaign, becoming a key measure of political risk for investors and rising to as wide as +0.78 bps.
The yield on U.S 10-year notes backed up +1 bps to +2.16%, while Aussie benchmark yields were flat at +2.41%.
Elsewhere, U.K 10-year gilts have rallied +2bps to +1.04%, while those in Germany rose +1 bps.
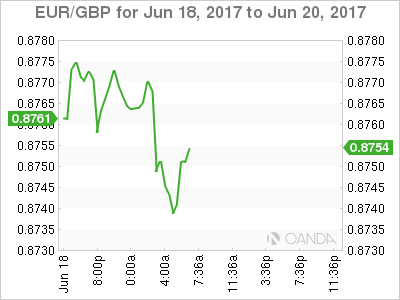
4. Pound steady ahead of Brexit talks
GBP (£1.2805) is firmer across the board as the BoE turned increasingly 'hawkish' last week – less willing to look through rising inflation. The BoE's Financial Policy Committee (FPC) are expected to discuss ending the Term Funding Scheme (TFS) at a meeting this week. Fixed income dealers are speculating that this could pave the way for a rise in interest rates much sooner than had been previously priced in.
USD/JPY is higher and holding atop of the psychological ¥111.00 level. Aside from last week's Fed statement, the yen has come under pressure attributed to some political uncertainty in Japan – PM Abe is expected to change up his cabinet in the next few weeks amid approval rating decline (+49% approval rating).
Late Friday, data from the U.S. Commodity Futures Trading Commission showed investors are taking long positions on the EUR once again (+79,053 more long than short contracts in the week to June 16), the largest long position since 2011. The 'single' unit is little changed, straddling the psychological €1.1200 handle.
Update: Moody's has cuts ratings on Australia's Big Banks on Housing Concerns – A$0.7595
5. Japan's May trade deficit a surprise
Data overnight saw Japan May Trade Balance register its first deficit in four- months – -¥203B vs. + ¥43B e – the components were mixed with exports missed expectations while imports beat.
A Finance Ministry official noted it wasn't uncommon for Japan to post a deficit in May because many manufacturers shut down factories during the “Golden Week” holidays, which limits exports.
The market has shrugged off the report as the exports data in Japan continues to reinforce the growth story for domestic economy.
Note: Japan's exports jumped +15% for May y/y, the biggest rise since January 2015, marking the sixth consecutive month of increases, however, the figure came in lower than an +18% increase expected by the street.
Euro Quiet On Absence Of Fundamentals
The euro is showing little movement in the Monday session, as EUR/USD is trading at the 1.12 level. There are no economic indicators in the eurozone or the US. We'll hear from Jens Weidmann, head of the German central bank, and two FOMC members will also deliver remarks.
In France, President Emmanuel Macron easily won a majority in presidential elections. Macron's En March party won about 61% of the vote, somewhat lower than recent polls, which had predicted that Macron would win as much as 80% of the seats in the National Assembly. Still, it's an impressive victory for the young and charismatic Macron, whose party is barely a year old. Macron has promised to relax regulations and reform labor laws in order to make France more competitive, but France's powerful trade unions are sure to push back against any legislation that will take away rights or benefits from workers. The unions have not hesitated to go on strike or lead mass protests in past conflicts with the government, so it will be a challenge for Macron to implement reforms while keeping the unions onside.
Brexit negotiations officially start on Monday, but the mood is likely to be stiff and subdued as British negotiators meet with their European counterparts. With Theresa May struggling to put together a government, her position is much weaker than before the disastrous British election, and the Europeans are still smarting from the Brexit vote, which stunned the continent. Philip Hammond, the British finance minister, has said that he wants a business-friendly and pragmatic Brexit and that no deal would be bad for the UK. His approach is much more conciliatory than that of May, who had threatened to leave without a deal. As for the Europeans, they have insisted that there will be negotiations about a new trade deal, prior to progress being made on three key issues: (1) the legal status of EU citizens in the UK; (2) the status of the border between Ireland and Northern Ireland; and (3) the financial obligations of the UK to the EU. On the weekend, the EU's Economic and Financial Affairs Commissioner Pierre Moscovici, said that the European position was not ‘hard ‘ or ‘soft'. but rather ‘amicable and firm'. There is little doubt that the EU will be firm, but based on the bad blood between the two sides, ‘amicable' could be a stretch.