Sample Category Title
Brexit Negotiations Kick Off
Today marks the beginning of the Brexit negotiations. Even though there is the likelihood for sterling to be headline-driven, we believe that over the next few days, market attention is likely to remain primarily on UK domestic politics. The deal between the Tories and the DUP is not finalized yet, while it still remains to be seen whether the Queen's speech will pass through Parliament. As such, it is not certain whether Theresa May will even have a seat on the negotiating table in a few weeks, and with what kind of mandate the UK will approach these talks.
On Sunday, Chancellor Philip Hammond noted that he wants to push for a 'jobs first' Brexit, and also rejected the government's previous mantra that 'no deal is better than a bad deal'. We consider these as preliminary indications that the Conservatives' stance to Brexit may have started to soften up. If more government or Tory officials echo similar remarks, then speculation regarding a smoother Brexit could resurface. Combined with a potential Tory-DUP deal that allows May to keep her position, these factors could prove positive for sterling, as political uncertainty dissipates somewhat. The Queen's Speech on Wednesday has the potential to lift some more of this uncertainty (see below). Even though Parliament will not vote on the Speech until next week, we will probably get some fresh indications on what May's government hopes to achieve in the Brexit talks.
GBP/USD traded in a consolidative manner on Friday, staying slightly below the resistance line of 1.2815 (R1). The pair continues to lie above the longer-term upside support line drawn from the low of the 7th of October, and also above the prior downside resistance line taken from the peak of the 6th of December. Nevertheless, it still trades below the key hurdle of 1.2850 (R2) and the short-term downside resistance line taken from the peak of the 18th of May. Therefore, we prefer to wait for a clear break above these key obstacles before we start getting confident that the pair may appreciate in the near term.
RBA June meeting minutes in focus
During the Asian morning Tuesday, the RBA will release the minutes of its June gathering, where it kept its policy unchanged, and maintained a balanced tone overall. Even though policymakers offered very little new information regarding the next move in interest rates, they did appear slightly more upbeat on the labor market, a sector of the economy they had previously expressed concerns about. Market focus may revolve around their views on this topic again, given that the last two employment reports from Australia have been stellar. Even though this may not be reflected in these minutes, as the latest jobs report was released after the June RBA meeting, we think that the Bank is likely to sound more upbeat with regards to the labor market when it meets again, on the 4th of July.
AUD/USD has been trading in a short-term uptrend since the 2nd of June. On Friday, the pair rebounded from near the 0.7565 (S1) support zone and during the early European Monday, it appears ready to challenge the 0.7635 (R1) resistance, marked by the peak of the 14th of June. A decisive break above that hurdle would confirm a forthcoming higher high on the 4-hour chart and is likely to aim for our next resistance of 0.7675 (R2). One the other hand, a rejection from near 0.7635 (R1) and a dip below the uptrend line taken from the low of the 2nd of June could see scope for a test near 0.7565 (S1). A break below that barrier could signal the completion of a double top and perhaps bring a short-term trend reversal.
Today's highlights:
The economic calendar is relatively empty today. We only have two speakers on the agenda: New York Fed President William Dudley and ECB Governing Council member Jens Weidmann.
As for the rest of the week:
On Tuesday, as we outlined above, we get the minutes from the RBA June meeting. On Wednesday, market focus turns back to the UK, where the Queen's Speech takes place. The Queen will outline a list of laws that the government wants to get approved over the coming year and Parliament will spend the next six days debating these plans, before holding a vote. If Theresa May secures the support of the DUP lawmakers, or if other parties support her policies, she keeps her place as PM. On Thursday, during the Asian morning, the RBNZ rate decision will be in the spotlight. We see the case for a more cautious tone by policymakers. During the European day, the Norges Bank will also announce its decision. On Friday, we get preliminary manufacturing and services PMIs for June from several European nations and the Eurozone as a whole. Canada's CPI data for May are also due out.
GBP/USD
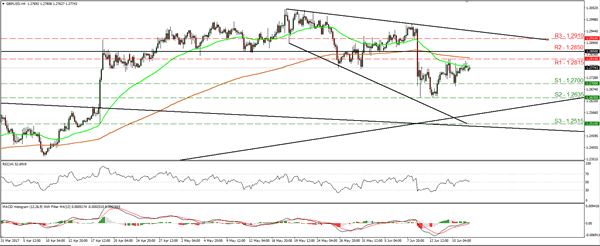
Support: 1.2700 (S1), 1.2635 (S2), 1.2515 (S3)
Resistance: 1.2815 (R1), 1.2850 (R2), 1.2910 (R3)
AUD/USD
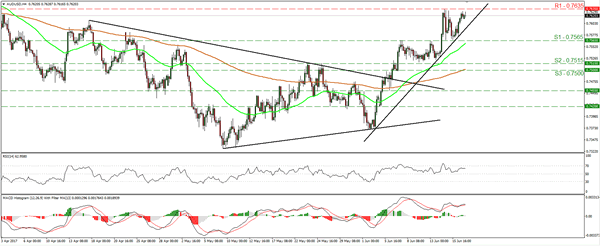
Support: 0.7565 (S1), 0.7515 (S2), 0.7500 (S3)
Resistance: 0.7635 (R1), 0.7675 (R2), 0.7700 (R3)
Gold Analysis: Passes Strong Support Level
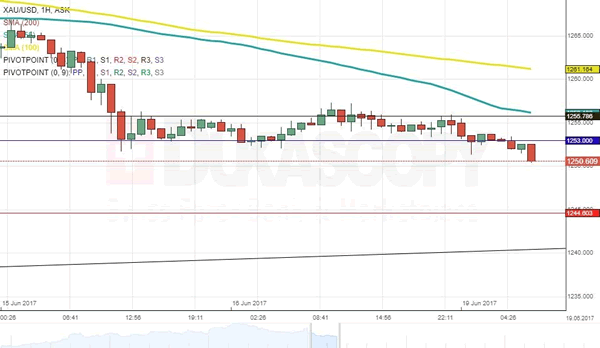
The bullion is set to fall below the 1,245 mark at some time during Monday's trading session. That is being indicated from a technical perspective by the fact that the commodity price has passed the strong support level of the monthly pivot point, which is located at the 1,253 mark. The support of the monthly PP held the bullion from falling below the 1,250 mark more than 40 hours. It is most likely that the commodity price will decline below the 1,245 level, as until that mark there are no notable support levels, which could hinder the fall. Meanwhile, it has to be noted that the commodity price is approaching the support of a long term pattern. The lower trend line of the dominant pattern on Monday morning was located just above the 1,240 mark.
USD/JPY Analysis: To Put 111.80 To The Test
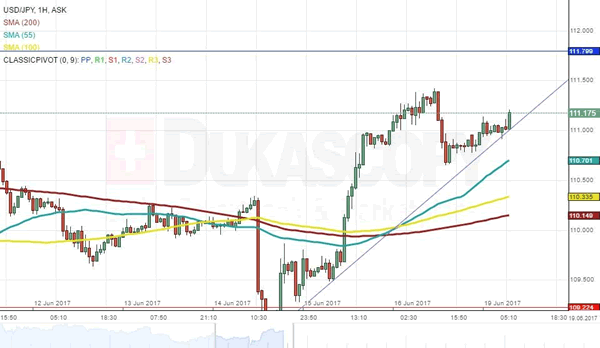
Even though the USD/JPY currency pair remained relatively unchanged on Friday, the bullish momentum seems to be intact. A new trend-line is supporting the pair’s exchange rate, but is unlikely to last long due to its sharp angle. Nevertheless, the Buck is likely to appreciate again today, as there are no significant bearish signals. The recovery could well last until the 111.80 level is reached, where the monthly pivot point rests. Resistance here could be sufficient to reverse momentum, as the Greenback was forced to edge lower in a similar situation in the beginning of the month. A successful breach of the monthly PP, on the other hand, should open the door for a much stronger recovery, with the main target being the 114.40 handle, namely the May’s high.
GBP/USD Analysis: A Recovery Is On The Way
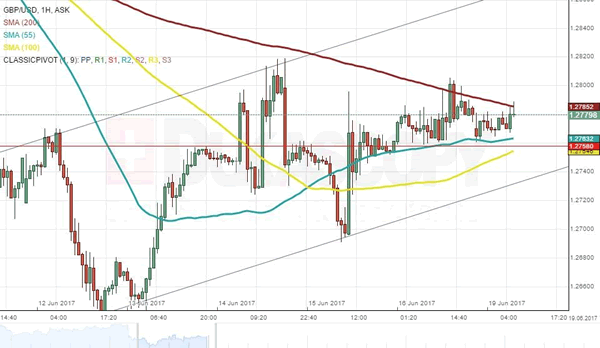
The British currency traded flat against the US Dollar on Friday, due to the absence of market movers. Upside volatility was somewhat limited by the 200-hour SMA, but it is unlikely to prevent the Pound from appreciating further, as the pair is trading within the borders of an ascending channel pattern. Although the channel is not fully confirmed yet, the exchange rate is still expected to rebound within the next two days. Technical indicators are mostly in favour of the given scenario, even though today’s signals are bearish. A successful surge towards the channel’s upper border, however, could only be achieved if the 1.28 major level is retaken this week—a goal the Cable failed to achieve for quite some time now.
EUR/USD Analysis: Encounters Resistance
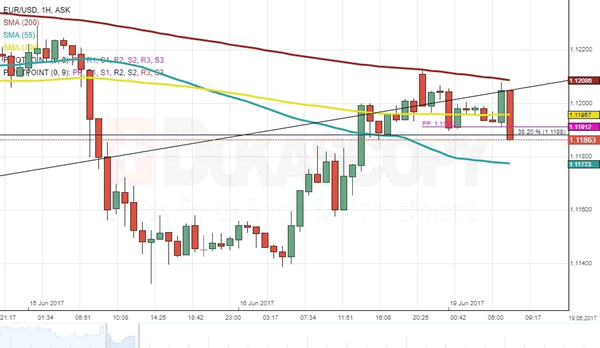
The decline of the common European currency against the US Dollar continued on Monday. Although the currency exchange rate had regained some of its losses in the second half of Friday’s trading session, that surge was short lived, as the currency exchange rate encountered the resistance of the 200-hour SMA, which on Monday morning had forced the Euro below the strong support cluster near the 1.1190 mark. Meanwhile, the rate still had the support of the 55-hour SMA at 1.1177. If that support level gets passed, the currency pair will be set to fall down to the 1.1110 level, where the next notable support cluster begins. However, it is quite possible that the decline will be hindered during today’s trading session.
GBP Higher As Brexit Negotiations Officially Start Today
Official kick-off for the Brexit negotiations
Roughly one year after the British referendum, the Brexit negotiations officially start today in Brussels. This will be a long and winding road for the UK government, particularly since the Conservative party lost its majority in the House of Commons. Against this backdrop, we expect EU negotiators to try to take advantage of the situation as Prime Minister Theresa May finds herself in a potentially weak position.
Last week, the pound sterling recovered from the massive sell-off following the loss of the Tory parliamentary majority. On Monday morning, the pound held steady against most of its peers as GBP/USD was treading water below the 1.28 threshold, while EUR/GBP eased to 0.8740.
For now, market participants have remained remarkably constructive on the pound as they prefer to see the glass as half full. However, the level of uncertainty keeps rising and we expect investors will finally realise how complicated those negotiations will become.
Mexico will follow in Fed's footsteps and raise rates
Banxico is clearly following the Fed rate. The Mexican central bank even changed its agenda in 2015 to carefully follow the Fed meetings and to maintain a rate differential to avoid any capital outflow. Tonight the institution will raise to 7%. Currency-wise, the demand for Mexican peso should continue and we should see USDMXN declining towards 17 peso for one single dollar note. The MXN is one of the best performing currencies of the year at the moment.
On top of this, the now infamous wall is far from being built and will certainly not be erected. Markets are less confident that President Trump could properly deliver his programme and this definitely adds upside pressures on the Mexican peso.
For the time being, despite the strengthening of its currency, one should not forget Mexico is still paying the price of the lack of investments in its industry sector. In particular, this is in its oil industry, which has infrastructure that is very ancient and does not enable Mexico to be competitive. Yet, pipeline constructions are booming. Domestic oil demand is also strengthening so there is room for further oil development but Mexico needs foreign investments which fell 19% in 2016.
Daily Technical Analysis: GBP/USD Bullish Consolidation Shaping Up
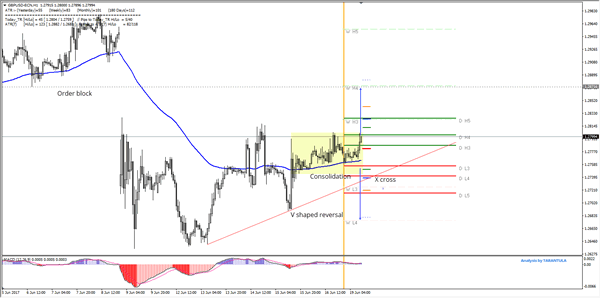
The GBP/USD has been consolidating between W H3 and W L3 Camarilla pivots. The consolidation is looking bullish at this moment as we can see the V shaped reversal pattern that has led to an overall positive momentum with a possible breakout to the upside. 1.2800 is the interim resistance, however 1.2825 needs to break in order for the price to remain bullish. Next targets are 1.2873, the confluence of order block and W H4. Positive momentum might also bring up the gap close within 1.2950 zone. However the price needs to stay above X cross of D L4 and a red trend line 1.2740. If it drops below it there is a scope for 1.2700-1.2680 retest. If that happens, the interim bullish momentum will be negated.
Foreign Exchange Market Commentary: EUR/USD, USD/JPY, GBP/USD, GOLD, WTI CRUDE, DJIA, FTSE100, DAX
EUR/USD
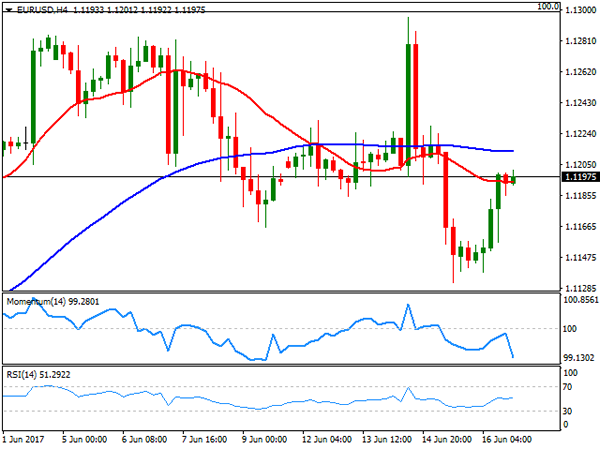
The EUR/USD pair closed the week flat at 1.1197, having surpassed its previous 2017 high, but a few pips by printing 1.1295 on Wednesday, following disappointing US inflation figures. Nevertheless, the US Federal Reserve actually pulled the trigger, rising rates by 25bps and offering a surprise hawkish tone, rather focusing on improving labour market conditions than on recent weak inflation that helped the greenback run on relief temporarily. The positive stance of the Central Bank was not enough to change the negative sentiment towards the greenback, as most of its latest decline came as a result of political disappointment, and as other Central Banks are clearly indicating their will to move towards policy normalization.
Data coming from the US on Friday were generally soft, with housing starts in May down to 1.092M, well below previous an expected, and building permits by just 1.168M. Consumer sentiment as measured by the University of Michigan, posted its biggest drop since last October, down to 94.5 in June from previous 97.1. Aiding partially the common currency, where news that Greece and its creditors reached a deal on the next bailout tranche. As for the US, President Trump announced his government will roll back Obama's deal with Cuba, which only adds to the political jitters weighing on the greenback.
Despite holding within its last 4-week range, the common currency continued losing footing over the past week, with the daily chart showing that the price was unable to extend beyond a horizontal 20 SMA, currently around 1.1220, whilst technical indicators kept retreating, now hovering around their mid-lines and indicating decreasing buying interest. In the shorter term, the 4 hours chart shows that the price develops below its 20 and 100 SMAs, both flat and within a tight range, indicating little directional strength, whilst the Momentum indicator heads lower after failing to surpass its mid-line, and the RSI indicator holds flat within neutral territory, supporting some further range trading for this Monday.
Support levels: 1.1160 1.1110 1.1075
Resistance levels: 1.1220 1.1260 1.1300
USD/JPY
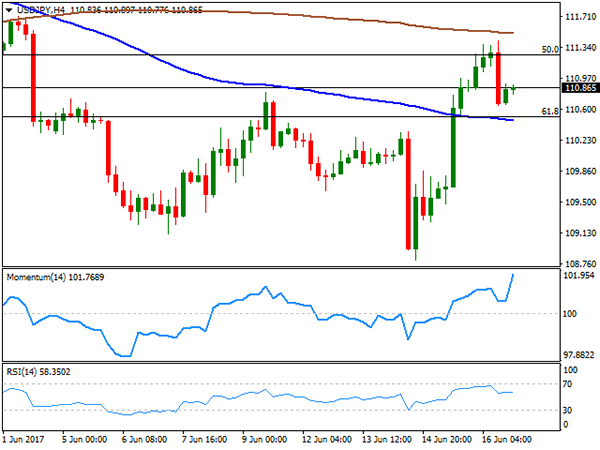
The USD/JPY pair reached a 2-month low this past week at 108.80, led by US yields plunging to fresh 2017 lows ahead of FOMC's monetary policy announcement. The 10-year Treasury note fell down to 2.138% on Wednesday, recovering afterwards to end the week at 2.16%. Helping the pair recovery was BOJ's decision, as the Japanese Central Bank kept rates unchanged at -0.1% as expected and maintained QQE with Yield Curve Control as expected, offering a confident stance an upgrading its consumption outlook. The pair advanced up to 111.41 with the news, but settled some 50 pips lower as US data released on the last day of the week disappointed, curving demand for the USD. The risk for the pair remains towards the downside, given that in the daily chart, the price remains below its 100 and 200 SMAs, with the shortest heading south below the largest, whilst technical indicators lost upward strength and turned flat within neutral territory. Additionally, Friday's advance was rejected around the 50% retracement of the latest bullish run. In the shorter term, and according to the 4 hours chart, the price is trapped between its moving averages, both heading south and with the 100 SMA converging with a Fibonacci support at 110.50, while technical indicators head north within positive territory, limiting chance of a downward move as long as the price holds above the mentioned support. In the case of a move below it, the risk will turn towards the downside for the upcoming sessions.
Support levels: 110.50 110.10 109.70
Resistance levels: 111.30 111.70 112.00
GBP/USD
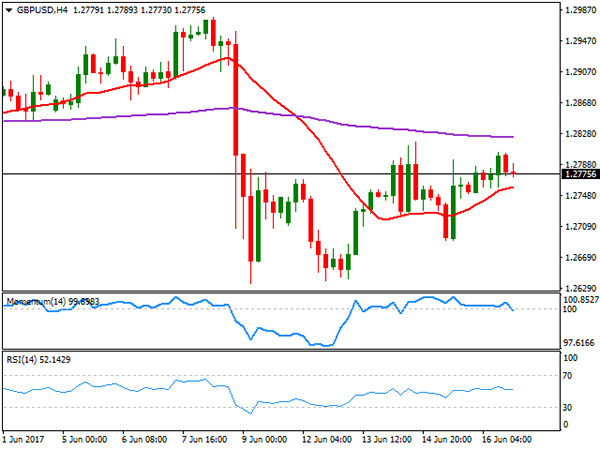
The GBP/USD pair settled at 1.2775 on Friday, barely up weekly basis amid dollar's retreating on Friday on soft local data. The Sterling recovered some ground on hopes for a softer Brexit after the initial post-election slump, but concerns over what's next for the kingdom finally took their toll on the currency, leaving it directionless during the second half of this past week. Brexit negotiations are set to begin this Monday, and with PM Theresa May positioned weakened after the election, it seems the EU will set it terms. The Union has repeatedly stated that there won't be talks over future trade relationships until the terms of the split are agreed, particularly focusing on UK's financial obligations that can account up to €100bn, something that the UK has considered outrageous in the past. The daily char for the pair indicates that the risk is towards the downside, as the price is being capped by a bearish 20 DMA, while technical indicators hover within negative territory, heading marginally lower with limited strength. In the 4 hours chart, the price is above a bullish 20 SMA, this last providing an immediate dynamic support at 1.2760, whilst technical indicators turned south within neutral territory. The key support for this Monday comes at 1.2705, the level to break to confirm a steeper decline.
Support levels: 1.2760 1.2705 1.2660
Resistance levels: 1.2795 1.2830 1.2870
GOLD
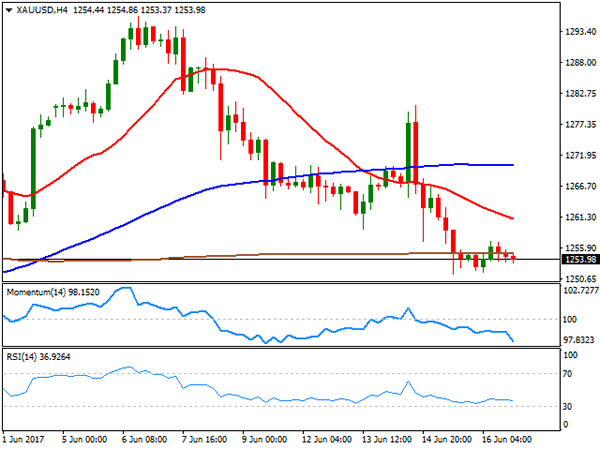
Spot gold closed the week at $1,253.98 a troy ounce, near its weekly low, pressured by a hawkish Fed. Dollar's broad weakness on Friday prevented the commodity from falling further, but overall, the negative tone persists, after the US Federal Reserve confirmed that it's still in the normalization path, with three rate hikes still in the table for this year, while announcing its intention of shrink the balance sheet. Down for a second consecutive week, the daily chart presents a bearish stance giving that technical indicators keep heading south after entering negative territory, whilst the price has broken below it s20 DMA and barely rests above the 100 DMA, this last a critical support at 1,251.10. In the 4 hours chart, the price settled well below its 20 and 100 SMAs, with the shortest gaining downward strength, and around a flat 200 SMA, whilst technical indicators head south near oversold readings, supporting further slides ahead.
Support levels: 1,251.10 1,242.50 1,230.90
Resistance levels: 1,257.20 1,265.90 1,271.40
WTI CRUDE OIL
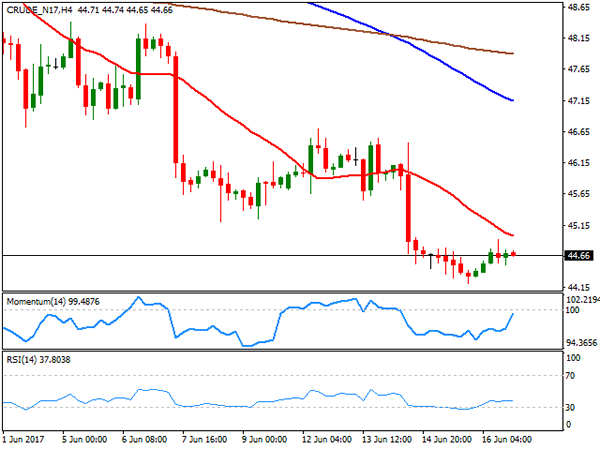
Crude oil prices remained pressured by oversupply concerns, with West Texas Intermediate crude futures settling at $44.66 a barrel on Friday, down for a fourth consecutive week. The commodity bounced modestly on the last day of the week after trading as low as 44.21 on Thursday, holding near its 2017 low of 43.75. Baker Hughes reported that the number of US active rigs drilling for oil rose by 6 to 747, the 22nd consecutive weekly raise. Earlier on the week, US crude stockpiles fell by less than expected, but gasoline inventories saw a large increase. Technically, the risk remains towards the downside, although a break below the mentioned yearly low is required to confirm a new leg south. In the daily chart, the 20 SMA heads sharply lower above the current level, while technical indicators have lost their bearish strength, consolidating within oversold territory, supporting the ongoing bearish trend. In the shorter term, and according to the 4 hours chart, the 20 SMA caps the upside around 45.00, while technical indicators corrected oversold conditions, but remain within negative territory, with the RSI having turned flat around 37, converging with the longer term perspective.
Support levels: 43.75 42.90 42.40
Resistance levels: 45.00 45.65 46.10
DJIA
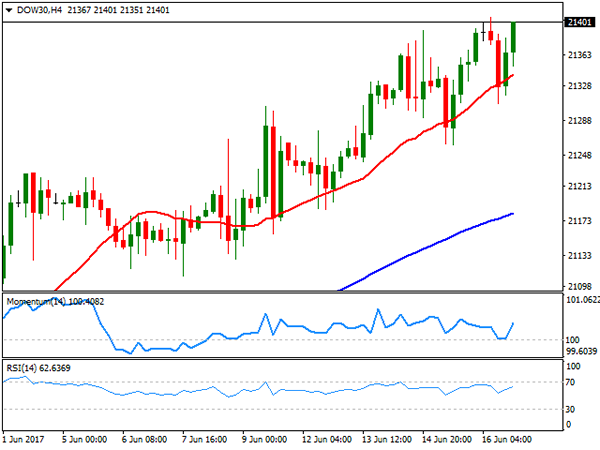
US indexes closed mixed on Friday, with the DJIA up 24 points to 21,384.28 and the S&P adding 0.03% to 2,433.15, but the Nasdaq Composite down 13 points, to 6,151.76. Retailers weighed on equities after Amazon announced the acquisition of Whole Foods, sending its competitors lower, whilst soft US housing and confidence figures also dented investors' mood. The Dow Jones, however, settled at record highs, heading into the new weekly opening around 21,400. Chevron led advancers, up 1.90%, followed by Exxon Mobil that added 1.50% on the back of a recovery in oil prices. Wal-Mart was the worst performer down 4.65%. From a technical point of view, the daily chart shows that the index remains above all of its moving averages, which maintain upward slopes, whilst technical indicators keep advancing, despite being in overbought levels, maintaining the risk towards the upside. In the 4 hours chart, technical indicators bounced from their mid-lines, whilst a bullish 20 SMA provided intraday support, currently at 21,341, also supporting additional gains ahead.
Support levels: 21,374 21,332 21,282
Resistance levels: 21,410 21,450 21,490
FTSE100
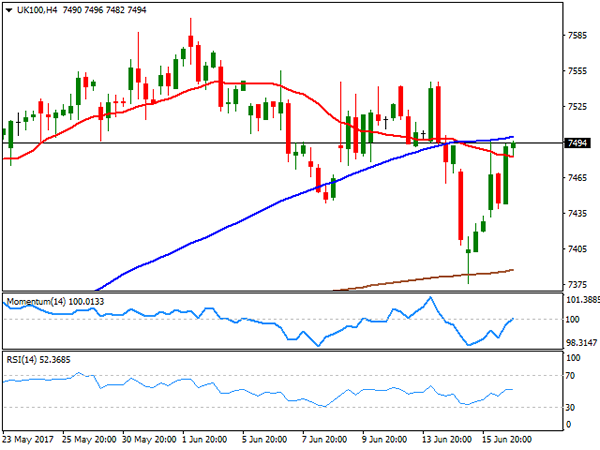
The FTSE 100 closed at 7,463.54, up 44 points of 0.60% on the last day of the week, trimming all of BOE's triggered loses. A recovery in oil prices backed the advance of the Footsie, although plummeting supermarket shares limited the advance. The sector fell after Amazon announced a $13.7 billion takeover of upscale grocery chain Whole Foods. Tesco led decliners with a 4.92% lost, followed by Sainsbury that shed 3.85%. Mining-related equities were also in the red, as gold prices remained under pressure, with Anglo American shedding 2.79%. St. James' Place led advancers, up 4.22%, followed by Mondi that closed 4.13% higher. In the daily chart, the index held below a horizontal 20 DMA, while technical indicators aim marginally higher within neutral territory, indicating a limited upward potential at the time being. In the 4 hours chart, technical indicators have pared their advances around their mid-lines, whilst the index ended a few points below its 100 SMA, this last around 7,500, and offering an immediate short term resistance.
Support levels: 7,478 7,432 7,376
Resistance levels: 7,500 7,541 7,584
DAX
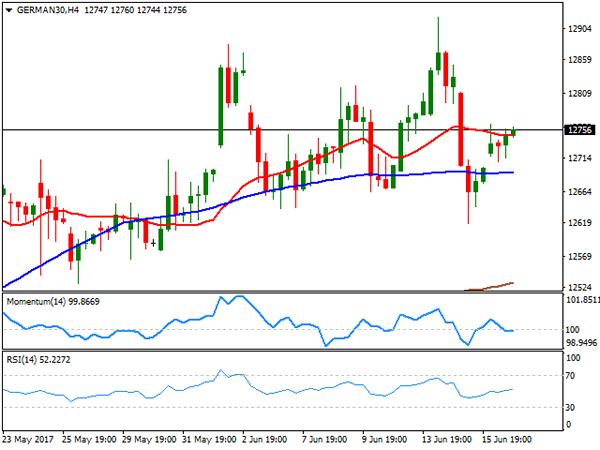
European equities bounced on Friday, recovering alongside with oil prices and with the energy sector leading the advance. The German DAX added 61 points to 12,752.73. News that Greece agreed with its creditors the next tranche of its bailout package brought relief to local investors, supporting stocks' recovery. Within the DAX, RWE AG led the advance, up by 1.96%, followed by Henkel that added 1.88%. Only 7 members closed in the red, with Siemens leading losers' list, down by 1.12%, followed by Deutsche Bank that shed 0.79%. The German benchmark closed unchanged for a second consecutive week, lacking directional strength, but still near record highs. In the daily chart, the index stands a few points above a flat 20 DMA, while far beyond bullish 100 and 200 SMAs, whilst technical indicators bounced modestly from their mid-lines, still presenting a neutral stance. In the 4 hours chart, technical readings also present a neutral stance, with indicators hovering around their mid-lines and the DAX stuck around flat moving averages.
Support levels: 12,708 12,665 12,617
Resistance levels: 12,769 12,800 12,852
Elliott Wave Analysis: EURUSD Found A Top, Weakness Is Already Here
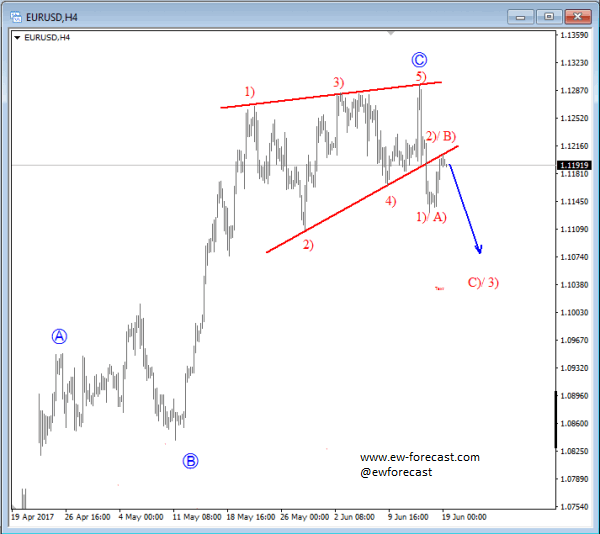
EURUSD touched a new high last week ahead of FOMC press conference, but then it turned sharply lower from 1.1300 area that we highlighted it as an important resistance region. An updated count shows an ending diagonal on 4h chart placed in wave C; a powerful reversal pattern that can cause a strong drop for this month with minimum three waves down. Currently we see price in wave 2)/B) trading at resistance here near 1.1200.
EURUSD, 4H
APAC Commodities – Lend Me Some Sugar?
Crude and precious metals continue to suffer, but maybe it's time for traders to add more sugar to their diets?
Crude Oil
Oil lifted itself off the floor at the end of the week as traders squared up into the weekend, with both Brent and WTI gaining about 1.0%. Crude, however, remains firmly in the naughty corner with both crude contracts merely managing to tread water near their week's lows.
News that Libyan production has surged to 830,000 bpd won't help the mood in OPEC headquarters, and the market seems to be discounting the shooting down of a Syrian warplane by the U.S. this weekend.
In a very light data week globally, traders will focus more on oil's market fundamentals which aren't looking good as the U.S. again added more rigs from Friday night's Baker Hugh's Rig Count. With a steady contango in the futures market, shale producer will also no doubt, be looking to hedge production in the forward contracts on any sniff of a rally.
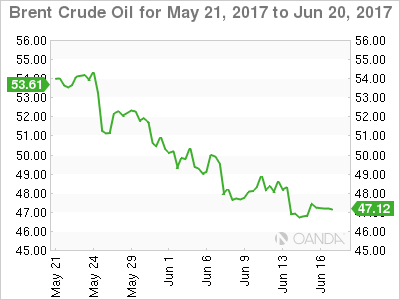
Brent
Brent spot closed at 47.20 on Friday with support at 46.50 and then 46.30. Resistance comes in at 47.50 and then 48.50.
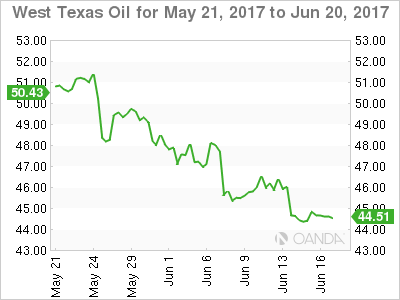
WTI
WTI spot trade sat 44.60, unchanged from its Friday close. Support lies at 44.20 and then the all-important 43.50 level. Resistance is at 45.00 followed by 46.00.
Precious Metals
Precious metals are also desperately looking for friends to start the week as well. A stronger U.S.Dollar and lack of geopolitical risk has seen the washout continue as stale longs put on at unattractive levels above the market continue to be slowly grou7nd out. Over on the physical side, buyers from India have yet to make an appearance on this dip suggesting they think they will get better levels.
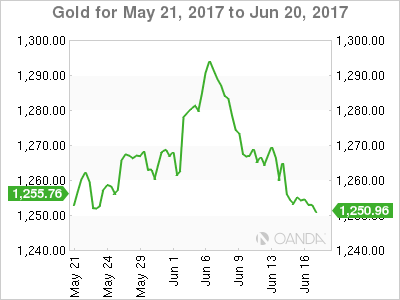
Gold
Gold enters the European session at 1250.70, near its lows for the day and eyeing initial support at 1250.00. Below here lies the 100-day moving average at 1247.15 followed by the 1246.00 double bottom.
Resistance is at 1256.00 first up followed by 1257.50 with a break suggesting any rally could extend to 1267.00.
Silver
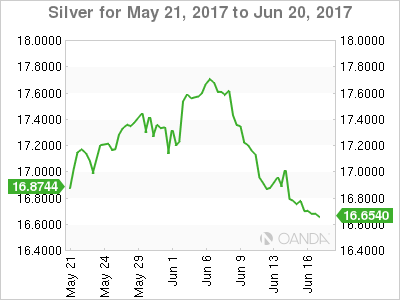
Silver trades in early Europe at 16.6380 with support close by at 16.6150 followed by the 16.4200 regions.
Resistance appears at 16.8500 with a break higher potentially opening a technical retest of the 17.0000 level.
Platinum
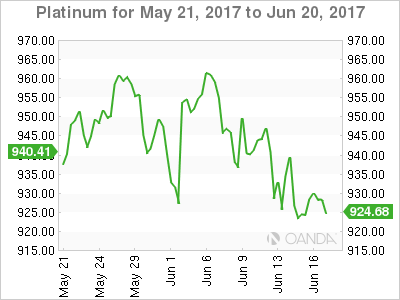
Platinum has been ranging in a 920.00/960.00 consolidation pattern since mid-May and is approaching the bottom of this at 926.20 in early Europe.
Platinum has resistance at 930.00 in the short term with then 942.00. At 962.50 and 64.00 we have the 100 and 200-day moving averages which form a formidable technical resistance in the longer term.
A break below 920.00 suggests a retest of the 900.00 level from a technical perspective. Platinum's long run outlook could darken if the 15-month lows at the 889.00 area break.
Palladium
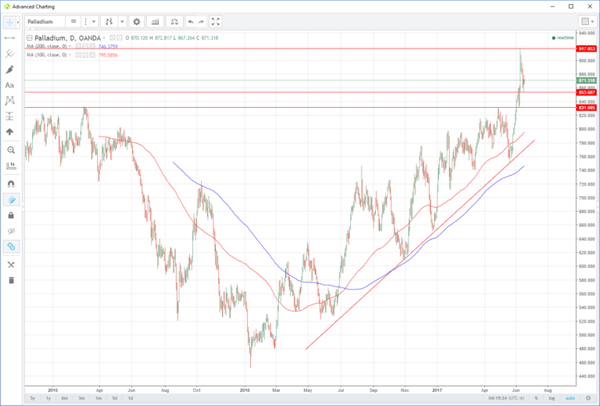
Perhaps the brightest spot in the precious metals complex is Palladium, reflecting its dual precious/industrial use in the world. Having given back nearly all its 10.50% rally in the early part of last week, Palladium remains in a 15-month technical uptrend. In fact, even with Palladium trading at 870.75 presently, it would have to break its long-term trendline support at 770.50 to jeopardise the rally from a chart perspective.
In the nearer term, Palladium has support at 854.00 and then 831.00 with resistance still last week's panic buying high of 918.00.
Softs
Sugar
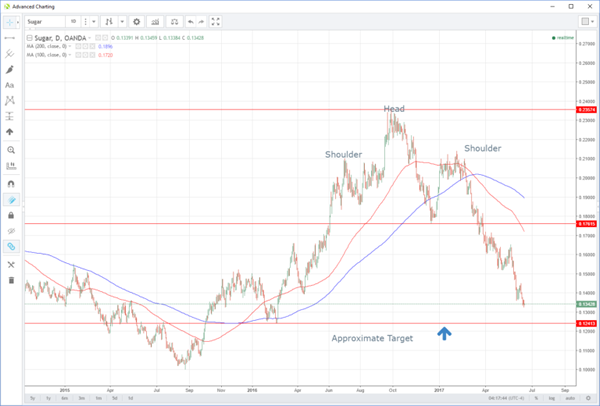
I don't often write about sugar, but the daily chart has my attention. Optimal growing conditions in major sugar producing countries have seen sugar become more unloved by markets faster than it would be at a Weight Watchers convention.
The head and shoulders pattern on the daily chart suggested a break of the neckline, at 0.17615, could target 0.11650.
With the April 2016 low at 0.12450 not too far from this level, the technical picture could suggest it may be time to “borrow some sugar”. At these levels, there is possibly a lot of optimal global harvest conditions built into the price.