Sample Category Title
No Impact from Formal Brexit Start on Sterling
- A rebound in technology shares set US equity indexes on course for fresh records. European equities rose after French president Macron won a free hand to drive through economic reforms. The pound edged higher and the euro was steady as Brexit talks began.
- In Asia, the focus tomorrow will be on the MSCI Inc. decision on whether to include China A-shares in its global indexes. The past three years, the decision was delayed because of regulation and accessibility worries for global investors. For China, acceptance by MSCI marks a key step to open up its financial markets and attract foreign capital.
- The Aussie dollar declined slightly today after Moody's cut the ratings of the Big Four Australian banks. Moody's cited elevated risks in the housing sector that heighten the sensitivity of the banks' credit profiles to an adverse shock. According to the RBA, the nation's household debt-to-income ratio climbed to a peak of 189%.
- NY Fed Dudley said he's confident that the expansion has a long way to go, that confidence is "very, very high" and that the economy is close to full employment. He said inflation was a little lower than the Fed would like but seemed not too concerned. He also sees wage growth quickening in the future as the job market tightens further.
- The Brexit talks finally began today amid confusion on what exactly the U.K. government wants from the divorce.
Rates
Core bonds open the week in slow-motion
Core bonds initially held a sideways trading pattern in a risk-on environment, but some modest, gradual erosion occurred during European afternoon. The calendar was razor-thin, but "hawkish" comments of NY Fed Dudley temporarily accelerated the decline in the US Note future (see graph). The move in the Bund didn't go far. We wouldn't draw conclusions of today's session, given the lightness of the calendar and the low traded volumes.
The US curve bear flattened with yields up to 2.8 bps (2-yr) higher. German yields increased by 0.1 bp (2-yr) and 1.4 bps (5-yr). Intra-EMU spreads versus Germany (10-yr) narrowed again following a one day interruption on Friday. The narrowing amounted 2-to-4 bps for the periphery, with Portugal outperforming (-6bps) after Fitch upgraded its rating outlook to BB+ positive.
NY Fed Dudley, a key member of Fed chairwoman Yellen's inner circle, sounded rather hawkish. Dudley, who has a rather dovish profile, said inflation was a little lower than the Fed would like. That suggests that he isn't overly concerned about it. In the same vein, he said the labour market is doing relatively well and "confidence is very, very high". He sees wage growth quicken as conditions on the job market tighten further and is confident that the expansion has quite a long way to go.
The Belgian debt agency started this week's scheduled EMU bond supply by tapping three on the run OLO's: OLO 82 (€0.93B 0.5% Oct2024), OLO 81 (€1.33B 0.8% Jun2027) and OLO 78 (€0.93B 1.6% Jun2047). The combined amount sold (€3.19B) was near the maximum of the target range (€2.7-3.2B) with an auction bid cover of 1.59, which in line with this year's average. Belgium now raised €24.82B (71%) of this year's €35B OLO funding need.
Currencies
USD gains marginal ground in dull session
Trading in the major FX cross rates took a very slow start to the new week. The swings of EUR/USD and USD/JPY were negligible in the morning session. The dollar was slightly better bid in the US session, but the moves remains technically insignificant. EUR/USD hovers in the 1.1180 and USD/JPY in the 111.25 area.
Overnight, Asian equities eked out moderate gains, without a specific trigger to explain the risk-on sentiment. The correction of tech stocks that spooked markets last week, has apparently run its course. The positive risk sentiment barely helped the dollar. USD/JPY held close to 111 and EUR/USD near 1.12.
European equities were also captured by a strong risk-on sentiment. Positive spill-overs from Asia and, to a lesser extent, the France election outcome, were the drivers of the risk rally. However, the impact on interest and on the major dollar cross rates was minimal. Both EUR/USD and USD/JPY hardly deviated from 1.12 and 111 respectively.
With no eco data on the agenda in the US, there was no meaningful change of the script this afternoon. The US equities joined the broader risk rally. US interest rates and the dollar gained marginal ground after comments from Fed's Dudley. He was positive on US economic growth and expects that the US expansion has a long way to go. USD/JPY trades in the 111.30 area. EUR/USD slipped to the 1.1175/80 area. Even so, the moves remain technically insignificant.
No impact from formal Brexit start on sterling
UK's Brexit Minister Davis and EU's Barnier gave the formal kick-off for the negotiations of the divorce between the EU and the UK. The impact on sterling trading was limited. The UK currency regained slightly ground today. The first official remarks of UK's Davis were reconciliatory. This creates the impression that the UK aims a softer Brexit than expected before the UK election. However, such a conclusion remains premature as the domestic political situation in the UK remains highly uncertain. EUR/GBP trades in the 0.8750 area. Silvana Tenreyro was appointed to the BoE MPC. She will replace Kristin Forbes. For now, we didn't see much info on her potential voting intentions.
GBP/USD Bulls Test 10-day SMA Resistance
GBP/USD has rebounded around 1.15% since June 12th after the general election slump.
On the 4-hourly chart, GBP/USD has been trading above the downside uptrend line support since June 13th.
The Brexit negotiations, between the UK and the EU, is set to start today, June 19th. In the short term, the GBP prospects will likely subject to the progression and situation of the Brexit process.
This morning in early European session, the bulls have been edging up and attempting to breach the short term major resistance level at 1.2800, where the daily 10-day SMA converges. However, it saw a moderate retracement.
The bulls still have momentum, however, be aware that pressure is heavier at the short term major resistance zone between 1.2800 – 1.2850.
The resistance level is at 1.2800, followed by 1.2820.
The support line is at 1.2770, followed by 1.2750.
The UK public sector net borrowing figure for May will be released at 09:30 BST on Wednesday. It will likely affect GBP crosses.
CAC Jumps as Macron Wins Solid Majority
The CAC index has posted strong gains in the Monday session, buoyed by President Emmanuel Macron's decisive electoral win. The index has gained 0.99% and is currently trading at 5316.00 points. On the release front, it's a quiet start to the week, with no economic indicators in France or the eurozone. On Tuesday, the eurozone releases Current Account.
France's long election season is finally over, after the second round of parliamentary elections on Sunday. President Emmanuel Macron's En Marche easily won a majority of seats in the National Assembly, garnering about 61% of the vote. This was somewhat lower than recent polls, which had predicted that Macron would win as much as 80% of the seats in parliament. Still, it's an impressive victory for the young and charismatic Macron, whose party is barely a year old. Macron ran on a pro-business agenda, promising to relax regulations and reform labor laws in order to make the French economy more competitive, but France's powerful trade unions are sure to push back against any legislation that will take away rights or benefits from workers. The unions have not shied away from going on strike or organizing mass protests in past conflicts with the government, so Macron will be hard-pressed to implement reforms while keeping peace on the labor front.
Macron has big plans for France, and not just on the economic front. The French president is a strong supporter of an integrated Europe, and has indicated that he will work closely with Germany in order to strengthen European unity. In a meeting with Theresa May last week, Macron said the "door remained open" for Britain to return to the EU, but as this will not happen, the pro-European Macron can be expected to support a hard line by European negotiators.
A full year after the Brexit referendum, which stunned Britain and the continent, British negotiators meet with their European counterparts on Monday in Brussels. A month ago, Prime Minister Theresa May was confidently peddling a hard Brexit, putting Europe on notice that if she didn't like what the Europeans were offering, the UK would leave without a deal. However, May was humiliated in the UK election, and will be forced to govern with a minority government that is dependent on the support of a small Irish party. May's defiant tone has been replaced by a more conciliatory Philip Hammond, the British finance minister. Hammond has said that he wants a business-friendly and pragmatic Brexit and that no deal would be bad for the UK, although he won't accept an agreement that is aimed at punishing Britain. As for the Europeans, they have insisted that there will be no negotiations about a new trade deal, prior to progress being made on three key issues: (1) the legal status of EU citizens in the UK; (2) the status of the border between Ireland and Northern Ireland; and (3) the financial obligations of the UK to the EU. On the weekend, the EU's Economic and Financial Affairs Commissioner Pierre Moscovici, said that the European position was not 'hard ' or 'soft'. but rather 'amicable and firm'. There is little doubt that the EU will be firm, but given the bad blood between the two sides, it will be a pleasant surprise if the negotiations are indeed 'amicable'.
Is USDJPY Headed Higher?
Good day everyone!
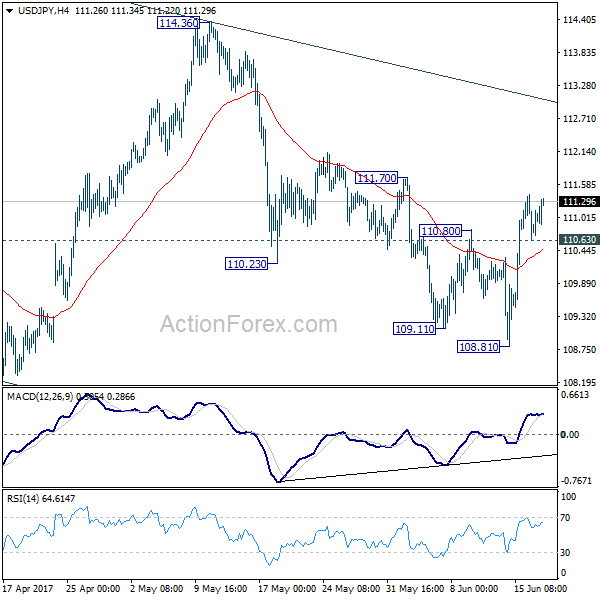
In today's post I want to take a look at USDJPY more closely which I believe has some very interesting pattern unfolding since last week. What really caught my eye is that move up from 108.80 area that occurred for a second time from that important »Gap Zone« made in April. These gaps will normally act like a magnet to be filled, and once they are a new turn may occur. And this is exactly what we see on 4h chart. In fact, bounce occurred very aggressive from 108.80 last week and took out a channel resistance line connected from 114.37. Normally that's indication of a change in trend, so I expect higher USDJPY especially if we consider the Elliott Wave look which shows a potential completion of a corrective set-back from May high. Reason for a bullish view is also an impulsive bounce on hourly chart which shows nice zone of support for this week around 110.00-110.50 zone.
USDJPY, 4H
EUR/USD Mid-Day Outlook
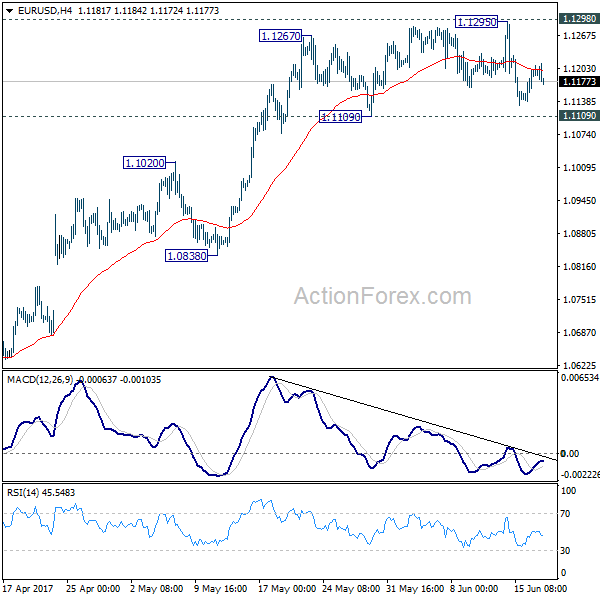
Daily Pivots: (S1) 1.1154; (P) 1.1177 (R1) 1.1217; More....
EUR/USD is still bounded in range of 1.1109/1295 and intraday bias remains neutral first. Focus stays on 1.1298 key resistance. Decisive break there will carry larger bullish implication and target 1.1615 resistance next. On the downside, break of 1.1109 support will indicate short term topping and rejection from 1.1298. In such case, intraday bias will be turned to the downside for 1.0838 support.
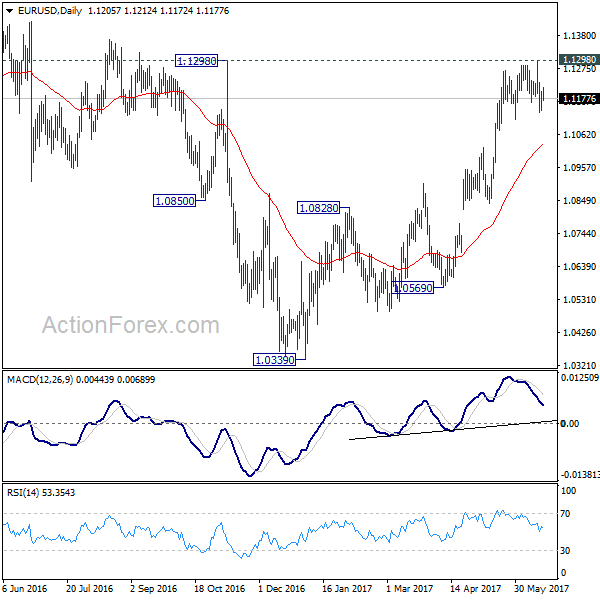
In the bigger picture, the case for medium term reversal continues to build up with EUR/USD staying far above 55 week EMA (now at 1.0932). Also, bullish convergence condition is seen in weekly MACD. Focus will now be on 1.1298 key resistance. Rejection from there will maintain medium term bearishness and would extend the whole down trend from 1.6039 (2008 high). However, firm break of 1.1298 will indicate reversal. In such case, further rally would be seen back to 1.2042 support turned resistance next.
GBP/USD Mid-Day Outlook
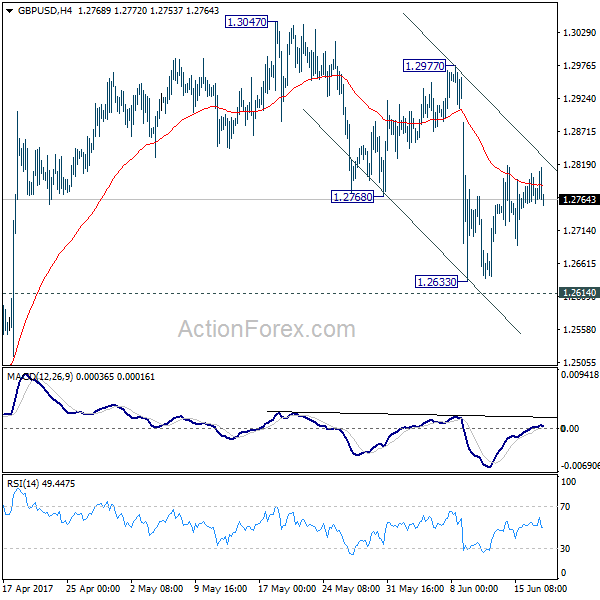
Daily Pivots: (S1) 1.2746; (P) 1.2775; (R1) 1.2801; More...
GBP/USD is staying in consolidation above 1.2633 and intraday bias remains neutral first. With 1.2977 resistance intact, we're still favoring the bearish case. That is, consolidation pattern from 1.1946 has completed at 1.3047 already. Break of 1.2614 resistance turned support should confirm our bearish view and target a test on 1.1946 low next. However, break of 1.2977 will dampen our view and turn bias back to the upside for 1.3047 and above.
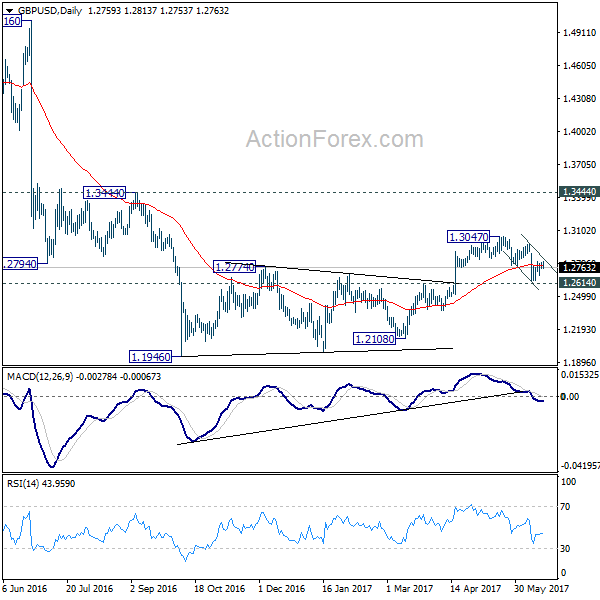
In the bigger picture, fall from 1.7190 is seen as part of the down trend from 2.1161. Price actions from 1.1946 medium term low are seen as a consolidation pattern, which could have completed after hitting 55 week EMA. Break of 1.1946 low will target 61.8% projection of 1.5016 to 1.1946 from 1.3047 at 1.1150 next. In case the consolidation from 1.1946 extends, outlook will stay remain bearish as long as 1.3444 resistance holds.
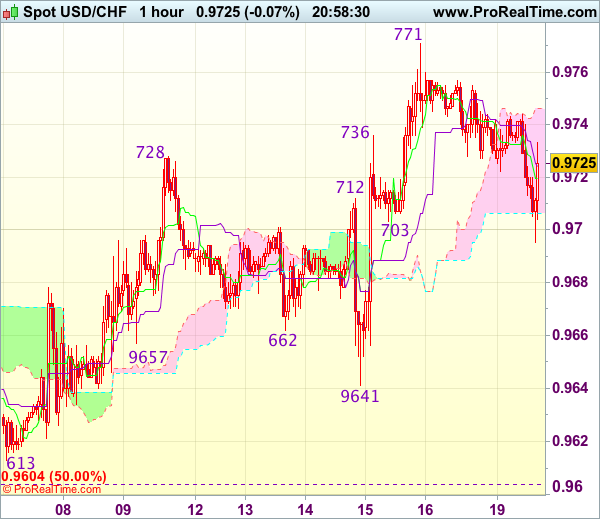
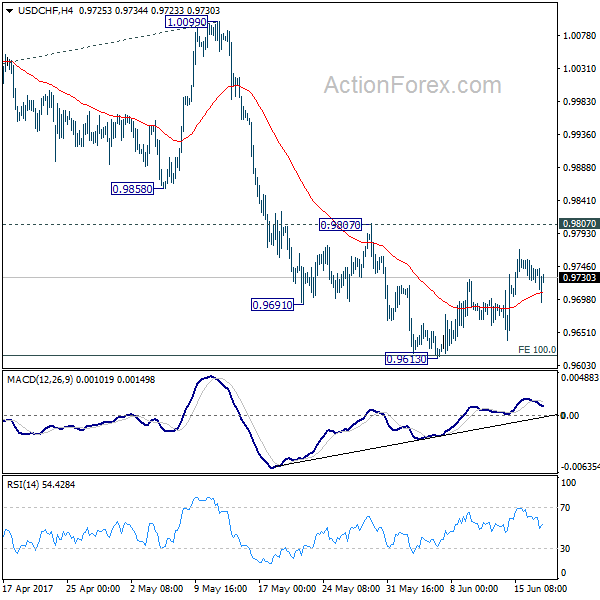
USD/CHF Mid-Day Outlook
Daily Pivots: (S1) 0.9724; (P) 0.9740; (R1) 0.9755; More.....
USD/CHF is still staying in consolidation above 0.9613 and intraday bias remains neutral first. As long as 0.9807 resistance holds, near term outlook remains bearish as deeper fall is expected. Below 0.9613 will extend the whole decline from 1.0342 to 0.9548 support and below. We'd start to look for bottoming signal again as it approaches 0.9443 key support level. However, considering bullish convergence condition in 4 hour MACD, break of 0.9807 will indicate near term reversal and turn outlook bullish for 1.0099 resistance next.
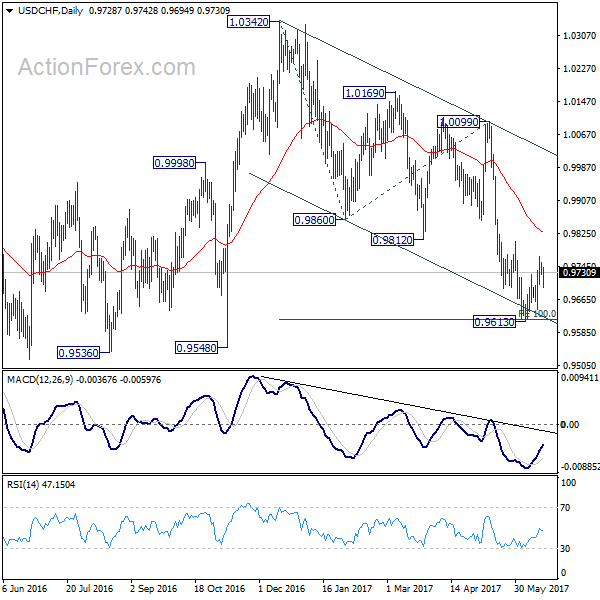
In the bigger picture, USD/CHF is still bounded in medium term range of 0.9443/1.0342 for the moment. Consolidative trading would likely continue and medium term outlook remains neutral. Break of 1.0342 key resistance is needed to confirm underlying bullish momentum in the pair. Meanwhile, downside attempts should be contained by 0.9443 key support level. However, sustained break of 0.9443 will carry larger bearish implication and target 0.9 handle.
USD/JPY Mid-Day Outlook
Daily Pivots: (S1) 110.52; (P) 110.97; (R1) 111.29; More...
Intraday bias in USD/JPY remains on mildly the upside as rise rebound from 108.81 is expected to continue to near term channel resistance (now at 113.05). Sustained break there will suggest that whole pull back from 118.65 has completed at 108.12 already. In such case, further rise should be seen to 114.36 resistance for confirmation. On the downside, below 110.63 minor support will turn intraday bias neutral. Break of 108.81 will extend the fall from 118.65 through 108.12 low before completion.
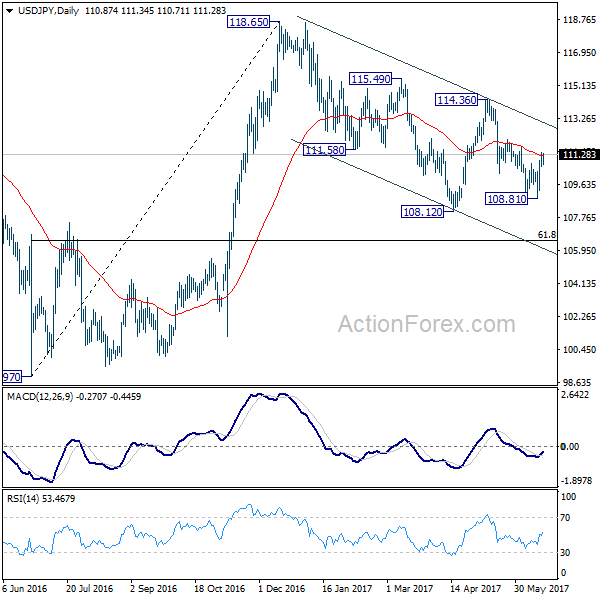
In the bigger picture, price actions from 125.85 high are seen as a corrective pattern. It's uncertain whether it's completed yet. But in case of another fall, downside should be contained by 61.8% retracement of 75.56 to 125.85 at 94.77 to bring rebound. Overall, rise from 75.56 is still expected to resume later after the correction from 125.85 completes.
Dollar Mildly Higher on Optimistic Fed Dudley, Forex Markets Tread Water
Dollar strengthens mildly in early US session after positive comments from New York Fed President William Dudley. He didn't sound much concerned with low inflation. Instead, he noted that the US is "pretty close to full employment. And if labor market continues to tighten further "wages will gradually pick up". And with that "inflation will gradually get back to 2%". Regarding the economy, Dudley also expressed that he is "confident" that the expansion has "quite a long way to go". USD/JPY could be revisiting last week's high at 111.41. But the EUR/USD is holding well above 1.1109 support which keeps it mildly bullish. Overall, the forex markets are staying inside Friday's range.
Leading business groups urged soft Brexit
As the negotiation between UK and EU formally starts today, five leading Business groups sent an open letter to the government urging it to soften the approach. The joint letter came from the British Chambers of Commerce, Confederation of British Industry, EEF, Federation of Small Businesses, and Institute of Directors. The emphasized that the government should "put the economy first" and maintain the "economic benefits" of access to the EU single market. Meanwhile, Chancellor of the Exchequer Philip Hammond said that "no deal would be a very, very bad outcome for Britain". And that's in sharp contrast to Prime Minister Theresa May's no deal is better than a bad deal stance.
The formal Brexit negotiations starts in European Commission buildings in Brussels today. UK's Brexit Secretary David Davis said that there is a "long road ahead" but that will lead to a "deep and special partnership", "a deal like no other in history". He also pledged to approach the difficulties in a "constructive way". The negotiations would start with EU's top priorities including the divorce bill, rights of citizens and border of Ireland. Meanwhile, EU's chief negotiator Michel Barnier would report in October this year on whether there are sufficient progress to move on to phase two of trade agreements. And it's expected that the whole talks would last until October 2018 before making an agreement. Davis and Barnier would be meeting for one week every month and return to their base to develop the positions.
ECB Smets concerned with low inflation expectations
ECB Governing Council member Jan Smets expressed his concerns that "inflation expectations are remaining pretty low" even though core inflation is going up. And he emphasized the need of "solid re-anchoring of these inflation expectations". Wage growth is something that ECB will be looking at closely too. Regarding what to do after the current EUR 60b asset purchase program ends, Smets said that "we'll not wait until New Year's Eve to tell what will happen on Jan.1" And, ECB will look into the matter in the "next months".
IMF Lipton: Not the time for BoJ to discuss exit strategy
IMF first deputy managing director David Lipton said that it's premature for BoJ to discuss exit strategy. He noted that "right now there's a need for continued accommodation because the inflation rate in Japan remains well below target". And, "there's need for the reflation effort to become more advanced." He also hailed that the move from a fixed target of JPY 80T per annum bond purchase to yield curve control is a "useful" switch. He noted that the strategy to "focus on price rather than a focus on quantity" is "likely to be a sustainable one". But he also emphasized the third arrow of Abenomics, structural policies, have to be strengthened.
Japan trade surplus narrowed to JPY 0.13% in May, below expectation of 0.35T. Export growth was flat monthly at 0.0% mom. But annually, exports jumped 14.9% yoy, highest since 2015. Nevertheless, that was below expectation of 18.2% yoy. It's also overshadowed by the 0.3% mom, 17.8% yoy rise in imports.
RBA Lowe expects stronger economy ahead
RBA Governor Philip Lowe said in a speech in Canberra that growth in Australia over the next couple of years will be "a bit stronger than it has been recently". And, the "pick-up in the global economy is helping us". He noted that monetary policy continues to provide support to the economy and "survey-based measures of business conditions have improved noticeably". He also added that "employment growth has also strengthened over recent months." But he also warned that wage growth is "unusually low" and averages hours worked have "declined". Also, the "nature of employment is changing" while there are higher debt levels for households. He emphasized the need to watch these issues carefully.
USD/JPY Mid-Day Outlook
Daily Pivots: (S1) 110.52; (P) 110.97; (R1) 111.29; More...
Intraday bias in USD/JPY remains on mildly the upside as rise rebound from 108.81 is expected to continue to near term channel resistance (now at 113.05). Sustained break there will suggest that whole pull back from 118.65 has completed at 108.12 already. In such case, further rise should be seen to 114.36 resistance for confirmation. On the downside, below 110.63 minor support will turn intraday bias neutral. Break of 108.81 will extend the fall from 118.65 through 108.12 low before completion.
In the bigger picture, price actions from 125.85 high are seen as a corrective pattern. It's uncertain whether it's completed yet. But in case of another fall, downside should be contained by 61.8% retracement of 75.56 to 125.85 at 94.77 to bring rebound. Overall, rise from 75.56 is still expected to resume later after the correction from 125.85 completes.
Economic Indicators Update
| GMT | Ccy | Events | Actual | Forecast | Previous | Revised |
|---|---|---|---|---|---|---|
| 23:01 | GBP | Rightmove House Prices M/M Jun | -0.40% | 1.20% | ||
| 23:50 | JPY | Trade Balance (JPY) May | 0.13T | 0.35T | 0.10T | 0.16T |
| 1:30 | AUD | New Motor Vehicle Sales M/M May | 2.90% | 0.30% | ||
| 23:00 | USD | Fed's Evans Speaks in New York |
Trade Idea Update: USD/CHF – Hold long entered at 0.9705
USD/CHF - 0.9731
Original strategy :
Bought at 0.9705, Target: 0.9805, Stop: 0.9670
Position : - Long at 0.9705
Target : - 0.9805
Stop : - 0.9670
New strategy :
Hold long entered at 0.9705, Target: 0.9805, Stop: 0.9690
Position : - Long at 0.9705
Target : - 0.9805
Stop : - 0.9690
As the greenback has retreated after rising to 0.9771 late last week, retaining our view that minor consolidation below this level would be seen, however, reckon 0.9690-95 would contain downside and bring another rise later, above said resistance at 0.9771 would extend recent rise from 0.9613 low to resistance at 0.9808 but reckon previous resistance at 0.9825 would hold from here due to near term overbought condition, bring retreat later.
In view of this, we are holding on to our long position entered at 0.9705. Below 0.9680-90 would defer and risk weakness towards said support at 0.9641 but only break there would abort and revive bearishness, this would also suggest the rebound from 0.9613 has ended instead, bring retest of this level later.