Sample Category Title
EUR/USD Elliott Wave Analysis
EUR/USD – 1.1195
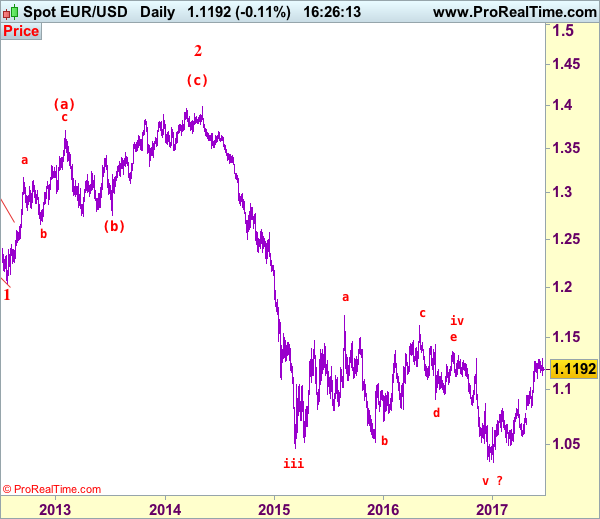
EUR/USD: Wave (c) of 2 ended at 1.3993 and wave 3 of III has commenced for weakness to 1.0411 (1.236 of wave 1), then 1.0000.
Although the single currency rose marginally to 1.1296, lack of follow through buying on break of previous resistance at 1.1285 and the subsequent retreat from 1.1296 suggest consolidation below this level would be seen and test of 1.1109 support cannot be ruled out, however, a daily close below there is needed to signal a temporary top has been formed, bring retracement of recent upmove to previous resistance at 1.1025 but a daily close below there is needed to provide confirmation, bring retracement of recent rise to 1.0975-80, having said that, downside should be limited to 1.0900 and support at 1.0839 should remain intact, bring rebound later.
Our preferred count on the daily chart remains that a wave (II) from 1.2329 ended at 1.5145 with A-leg ended at 1.4720, followed by wave B at 1.2457, the wave C from there was also a 3 legged move and is labeled as (a): 1.3739, (b): 1.2885, the wave iii of the 5-waver (c) from 1.2885 has ended at 1.4339 and wave iv is a triangle ended at 1.3878 and wave v formed a top at 1.5145. The decline from there is a 5-waver (C) with minor wave (i) of I of (C) ended at 1.4218 with wave (ii) ended at 1.4580, wave (iii) ended at 1.3267 and wave (iv) ended at 1.3692 and wave (v) ended at 1.1876, this is also the low of wave I of (C) and wave II ended at 1.4940, hence wave III is now in progress with a diagonal wave 1 ended at 1.2042, the breach of previous support at 1.1876 (wave I trough) adds credence to our view that the wave 2 has ended at 1.3993, wave 3 has commenced for further weakness to 1.0411, then towards 1.0000.
On the upside, whilst initial recovery to 1.1240-50 cannot be ruled out, said resistance at 1.1296 should hold and bring another retreat later. Above 1.1296-00 would signal recent upmove from 1.0340 low is still in progress for headway to another previous resistance at 1.1366, however, near term overbought condition should prevent sharp move beyond 1.1430-35 and price should falter below 1.1500, bring retreat later.
Recommendation: Exit long entered at 1.1210 and stand aside this week
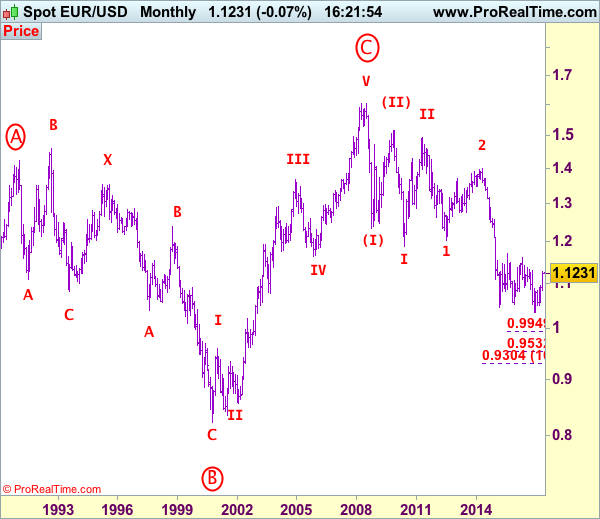
Euro's long-term uptrend started from 0.8228 (26 Oct 2000) with an impulsive structure. The rise from 0.8228 to 0.9593 (5 Jan 2001) is labeled as wave I, the retreat to 0.8352 (6 Jul 2001) is wave II and the rally to 1.3670 (31 Dec 2004) is wave III. Wave IV from there ended at 1.1640 (15 Nov 2005), the subsequent upmove to 1.6040 (July 15, 2008) is treated as wave V, the major selloff from the record high of 1.6040 to 1.2329 (October 27, 2008) signals a reversal has taken place with (I) leg ended at 1.2329 and once (II) ended at 1.5145, wave (III) itself is an extended move with I: 1.1876 and complex wave II ended at 1.4902, wave III has commenced with wave 1 and 2 ended at 1.2042 and 1.3993 respectively, wave 3 of III is now unfolding for weakness towards parity.
USD/JPY Elliott Wave Analysis
USD/JPY - 111.07
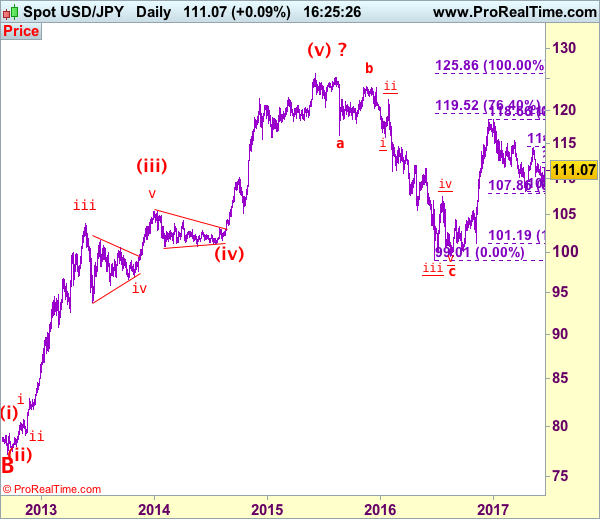
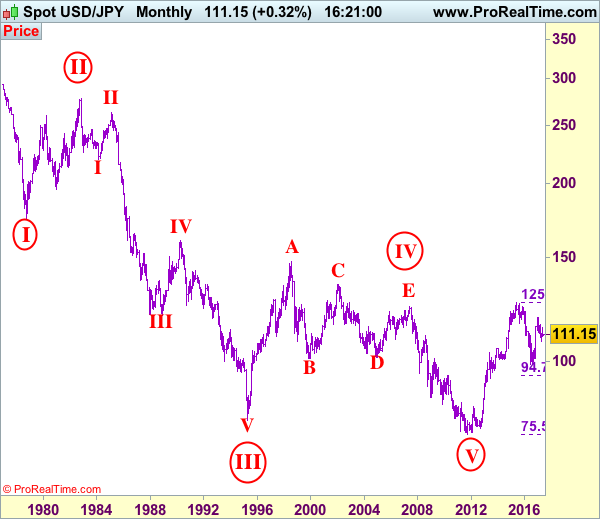
USD/JPY – Wave V of larger degree circle V has possibly ended at 75.31 and major correction has commenced and already met indicated target at 125.00.
Although the greenback has rebounded after marginal fall to 108.82 last week and consolidation with mild upside bias is seen for test of resistance at 111.71, however, as this move is viewed as retracement of the fall from 114.39, reckon upside would be limited to 112.25-30 (61.8% Fibonacci retracement of 114.39-108.82) and bring retreat later. Below 110.35 would bring weakness to 110.00 but reckon downside would be limited to 109.50-60 and said support at 108.82 would continue to hold, bring another rebound later.
Our preferred count is that, triangle wave IV (with circle) ended at 101.45 and the circle wave V brought dollar down to the record low of 75.31 in 2011 and the subsequent rebound signal major correction has commenced with A leg ended at 84.19, followed by wave B at 77.14 and impulsive wave C is now unfolding (indicated upside target at 125.00 had been met) for gain towards 127.00 level. In the event dollar drops below support at 99.01, this would confirm medium term decline from 125.86 top (2015 high) has resumed for subsequent weakness to 98.00 and possibly 97.00.
Under this count, this wave C is unfolding as impulsive waves with (1) (2), 1 2 ended at 80.67, 79.07, 82.84 and 81.69 respectively, hence the extended wave 3 has ended at 103.74 and wave 4 correction of recent upmove should bring weakness to 92.57, then towards 90.88 but psychological support at 90.00 should limit downside and bring another rally later in wave 5, indicated target at 125.00 had been met and gain to 127.00 cannot be ruled out but reckon price would falter below 130.00.
On the upside, whilst initial recovery to 111.71 resistance is likely, reckon upside would be limited to 112.25-30 (61.8% Fibonacci retracement of 114.39-108.82), bring another decline later. Above 112.50-60 would risk a stronger rebound to previous support at 113.12 but break there is needed to signal the fall from 114.39 has ended, risk further gain to 113.85-90, however, said resistance at 114.39 should remain intact, bring another decline later this month.
Recommendation: Sell at 112.50 for 110.50 with stop above 113.50.
On the monthly chart, we have changed our preferred count that an impulsive wave is unfolding with major wave III with circle ended at 79.75, then followed by wave IV with circle and is labeled as a triangle with A: 147.64 (11 August, 1998), B: 101.25, C: 135.20, D: 101.67 and E leg ended at 124.14 to end the wave IV with circle. Hence, wave V with circle commenced from there and hit a record low of 75.31, however, the subsequent strong rebound signals this circle wave V has possibly ended there, hence gain to (indicated upside target at 122.00 and 125.00 had been met), the retreat from 125.86 suggests wave A of major correction has ended there and wave B correction back to 99.00, then 95.00 would be seen, however, reckon downside would be limited to 90.00, bring another rebound in wave C next year.
Brexit Negotiations To Be Triggered
The Brexit negotiation between the UK and the EU is set to start today, June 19th.
Although Theresa May has stated before 'no deal is better than a bad deal', Chancellor said on Sunday that 'no deal would be a very, very bad outcome for Britain'. A Hung Parliament will likely cause both a positive and a negative impact on the Brexit process, as the Tories now have less dominance in the Parliament, the UK will likely be at a weaker position, resulting in a softer Brexit. However, different opinions and stances between different political parties will likely cause conflicts on discussion of some Brexit associated issues.
The focuses on the Brexit negotiations issues include whether the UK will be able to stay in the custom union, trade agreements, financial services, the rights of EU citizens living in the UK and British nationals living in the EU etc. In the short term, the GBP prospects will likely subject to the progression and situation of the Brexit process.
GBP has seen a rebound post the general election. GBP/USD has rebounded around 1.15% since June 12th. This morning, in early European session, the bulls are attempting to breach the psychological level at 1.2800. GBP/JPY has rebounded 2.3% since June 12th. This morning, in early European session, the bulls broke the resistance level at 142.00. EUR/GBP has retraced 1.3% since June 12th.
After the release of the UK general election outcome, markets’ risk-off sentiment has waned. The VIX (volatility) index fell to a low of 9.37, last seen in 1993, after the election. It was followed by a moderate rebound, trading around 10.38. It appears to be that markets’ risk-on sentiment will likely last an extended period.
Gold has retreated around 1.27% since the Fed addressed a hawkish statement last Wednesday. This morning in early European session, spot gold fell to a low of 1250.06, last seen on May 24th.. There is stronger support at the zone between 1245 – 1250, if the zone is broken, we will likely see an extended downtrend. In the short term, gold prices likely remain bearish unless some unexpected market events happen to push it up.
The economic data is relatively thin this week. The Reserve Bank of Australia (RBA) meeting minutes will be released at 02:30 BST on Tuesday morning, it will likely affect AUD crosses.
Macron Secures Comfortable Majority In Parliament, Euro Boosted
The French President Emmanuel Macron has won the strong parliamentary majority he asked the people of France to give him and can now proceed with the reforms he campaigned for, aiming to revive the French economy. Given his pro-EU rhetoric, his success could translate into success for the rest of the EU and perhaps more specifically the Eurozone.
Macron's centrist party, La République en Marche, and its fellow centrist ally, Modem, secured a comfortable majority in the National Assembly, the lower house of the French Parliament, by winning 350 of the 577 seats. After the first round of elections a week ago, some anticipated that more than 400 seats would be won by the two parties. Despite those expectations not materializing, the result is impressive for Macron's party which was formed only fourteen months ago and which would still hold a majority in parliament even without Modem's support.
The Socialist party of former President François Hollande suffered a crushing defeat, losing more than 200 seats. Jean-Christophe Cambadélis, the party's leader immediately stepped down. The National Front of far-right leader Marine Le Pen won nine seats, failing to capitalize on the votes its leader secured when running for president. Le Pen, who won a seat in the National Assembly for the first time in four attempts, was aiming to reach the 15-seat threshold, a feat which would grant her party greater financial support and more speaking time. Jean-Luc Mélenchon's Unbowed France won 17 seats, the Communist party 10, while the centre-right Republicans and ally forces, who will form the main opposition, won 137 seats from 199 before.
The turnout hit a new record low of just 43%, offering Le Pen the opportunity to question the legitimacy of the new parliament and the strength of the support Macron has received. It is also interesting to note that female representation in the new parliament will go up to 40% from just a quarter previously.
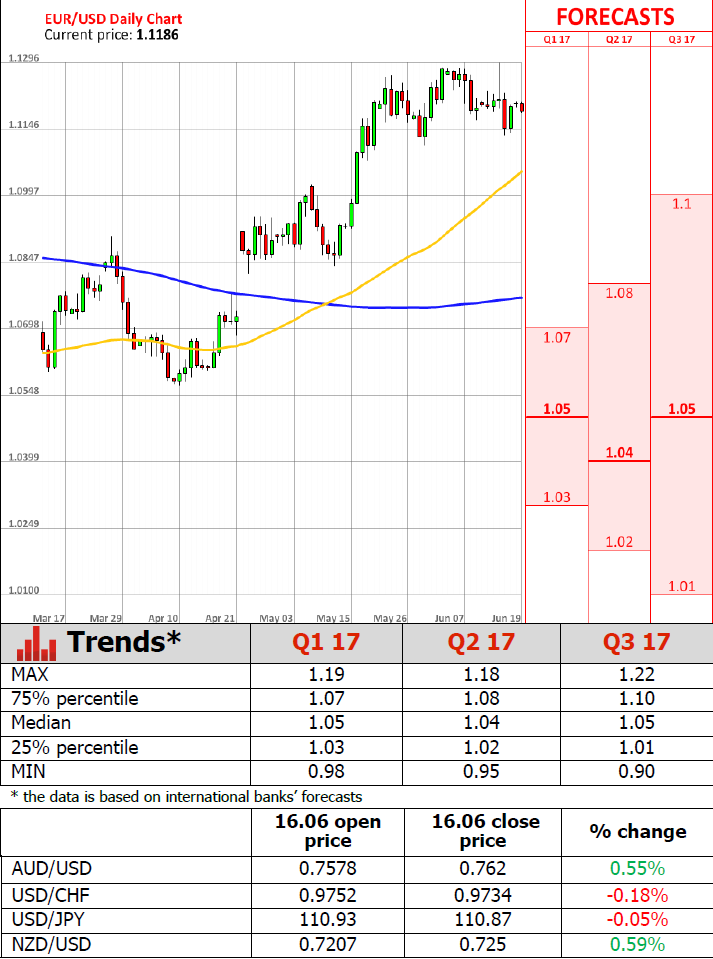
Closing with the reaction in the forex markets, as Asian markets opened for trading the euro received a modest boost, jumping to as high as $1.1208 to reach its highest for the day so far. As European traders are commencing their trading day, euro/dollar is marginally below the 1.12 handle.
Trade Idea: GBP/USD – Hold short entered at 1.2750
GBP/USD – 1.2799
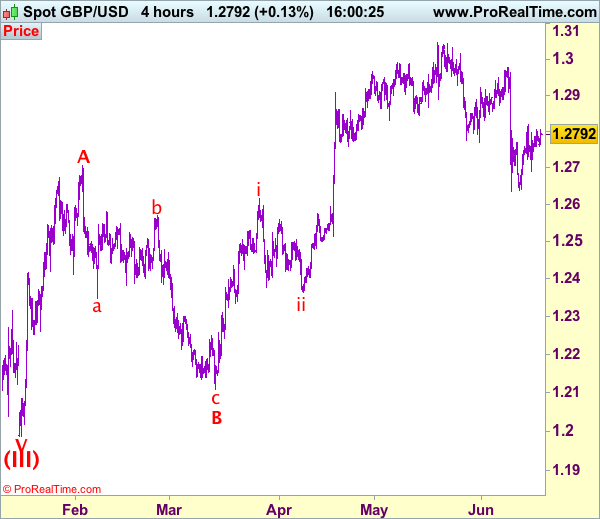
Recent wave: Wave V of larger degree wave (III) has ended at 1.1986 and major correction has commenced from there for gain to 1.3000 and 1.3140-50
Trend: Near term down
Original strategy :
Sold at 1.2750, Target: 1.2600, Stop: 1.2810
Position: - Short at 1.2750
Target: - 1.2600
Stop: - 1.2810
New strategy :
Hold short entered at 1.2750, Target: 1.2600, Stop: 1.2810
Position: - Short at 1.2750
Target: - 1.2600
Stop:- 1.2810
As sterling staged a strong rebound after finding support at 1.2690 last week, suggesting further consolidation would be seen, however, as long as resistance at 1.2818 holds, bearishness remains for another decline, below said support at 1.2690 would add credence to our view that the rebound from 1.2635 has ended at 1.2818, bring weakness towards said support at 1.2635 but break there is needed to confirm recent decline from 1.3048 top has resumed for retracement of recent upmove to 1.2600, having said that, downside should be limited to 1.2550 and reckon previous support at 1.2515 would hold.
Our preferred count on the daily chart is that cable's rebound from 1.3500 (wave (A) trough) is unfolding as a wave (B) with A ended at 1.7043, followed by triangle wave B and wave C as well as wave (B) has ended at 1.7192, the subsequent selloff is the larger degree wave (C) which is still unfolding with minor wave (III) of larger degree wave 3 ended at 1.1986, hence wave (IV) correction is in progress which could either be a triangle wave (IV) of a complex formation but upside should be limited to 1.3500 and price should falter well below 1.4000, bring another decline in wave (V) of 3 for weakness to 1.1500, then 1.1200.
On the upside, expect recovery to be limited and bring another decline. Only above said resistance at 1.2818 would defer and risk a stronger rebound to 1.2860-70 would but price should falter below 1.2900, bring another selloff later.
Trade Idea: GBP/JPY – Buy at 141.50
GBP/JPY - 142.25
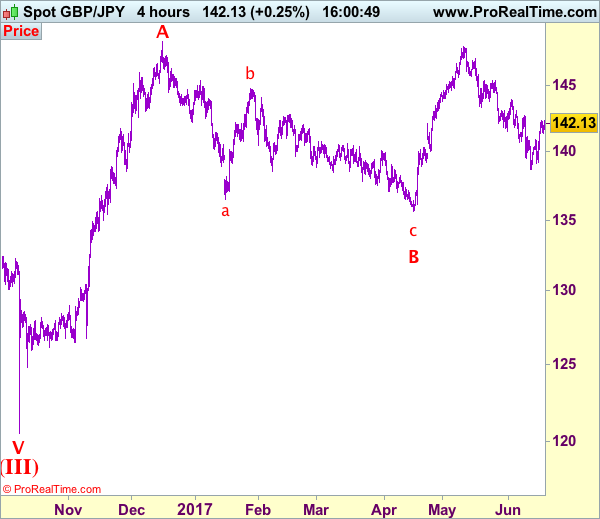
Recent wave: Medium term low formed at 120.50 and (A)-(B)-(C) major correction has commenced with (A) leg ended at 148.45, hence wave (B) is unfolding for retreat to 131.00-10.
Trend: Near term down
New strategy :
Buy at 141.50, Target: 143.50, Stop: 140.90
Position: -
Target: -
Stop:-
As sterling has maintained a firm undertone after the strong rebound from 138.70, suggesting low has been formed there and consolidation with upside bias is seen for test of 142.75 resistance, however, a sustained break above there is needed to add credence to this view, bring retracement of recent selloff to 143.05-10, then 143.50-60 but near term overbought condition should limit upside to resistance at 143.95-00.
In view of this, would not chase this rise here and would be prudent to buy sterling on pullback as 141.35-40 should limit downside. Below previous resistance at 140.90 would defer and risk weakness to 140.50, however, if our view that low has been formed at 138.70 is correct, downside should be limited to 140.15-20 and bring another rebound later.
Our preferred count is that larger degree wave V with circle is unfolding from 251.12 with wave (I) 219.34, (II): 241.38 and wave (III) is subdivided into 1: 192.60, 2: 215.89 (23 Jul 2008) and wave 3 ended at 118.87 earlier in 2009. The correction from there to 162.60 is wave 4 which itself is a double three and is labeled as first a-b-c ended at 151.53, followed by wave x at 139.03, 2nd a ended at 162.60, 2nd b at 146.75 and 2nd c leg of wave 4 ended at 163.00. Therefore, the decline from 163.00 to 116.85 is now treated as wave 5 which also marked the end of larger degree wave (III), hence wave (IV) major correction has commenced for retracement of the wave (III) from 241.38 and upside target at 183.95-00 (50% Fibonacci retracement of the wave (II) from 241.38) had been met, a drop below 160.00 would suggest wave (IV) has ended at 195.85, bring decline in wave (V) for initial weakness to 130 (already met) and 120.
Technical Outlook: GBPUSD Attacks Daily Cloud Top Again
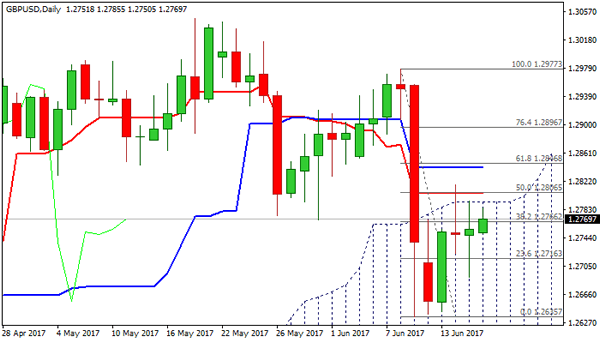
Sterling is standing at the front foot in early Monday’s trading and probing again through very strong 1.2800 resistance zone (daily cloud top / daily Tenkan sen and falling 10SMA in attempt to cross below rising 55SMA).
Several attempts at 1.2800 barrier failed last week, keeping near-term risk skewed lower while the price stays below. Negatively aligned daily indicators support the notion, however, limited downside is seen while 1.2700 pivot is intact. Break here is needed to generate stronger bearish signal.
Conversely, sustained break above 1.2800 would neutralize downside risk and signal further retracement of 1.2977/1.2635 downleg.
Falling 20SMA / Fibo 61.8% of 1.2977/1.2635 mark next strong barrier at 1.2848.
Res: 1.2800, 1.2817, 1.2848, 1.2896
Sup: 1.2750, 1.2722, 1.2704, 1.2690
US Housing Starts And Building Permits Drop Unexpectedly Last Month
'Homebuilders continue to caution that construction may be limited by a lack of available lots or skilled labor, but the market fundamentals suggest that demand should remain solid.' — Tom Simons, Jefferies LLC
US homebuilding activity rose slowed unexpectedly last month, official figures revealed on Friday. The Commerce Department reported that housing starts fell 5.5% to a seasonally adjusted annual pace of 1.09M units, the lowest since September 2016, following the preceding month's downwardly revised pace of 1.16M and falling behind analysts' expectations for decline to 1.23M-unit pace. On an annual basis, homebuilding dropped 2.4%. Single-family homebuilding fell 3.9% to a 194K-unit pace in May, the lowest in eight months, after hitting its almost 10-year high in February. The volatile-family housing sector posted a drop of 9.7% to a 298K-unit pace last month. In the meantime, building permits plunged 4.9% to a pace of 1.17M units during the reported month, compared to the prior month's pace of 1.23M units, whereas analysts anticipated an increase to a 1.25M-unit pace. Despite weak data on homebuilding, analysts suggested that employment would boost home construction in the upcoming months, taking into account the jobless rate at a record low of 4.3% and strong job creation.
Trade Idea: EUR/JPY – Buy at 123.40
EUR/JPY - 124.36
Recent wave: wave v of (C) ended at 94.12 and major correction in wave A has ended at 149.79
Trend: Near term up
Original strategy:
Buy art 123.40, Target: 125.40, Stop: 122.80
Position: -
Target: -
Stop: -
New strategy :
Buy art 123.40, Target: 125.40, Stop: 122.80
Position: -
Target: -
Stop:-
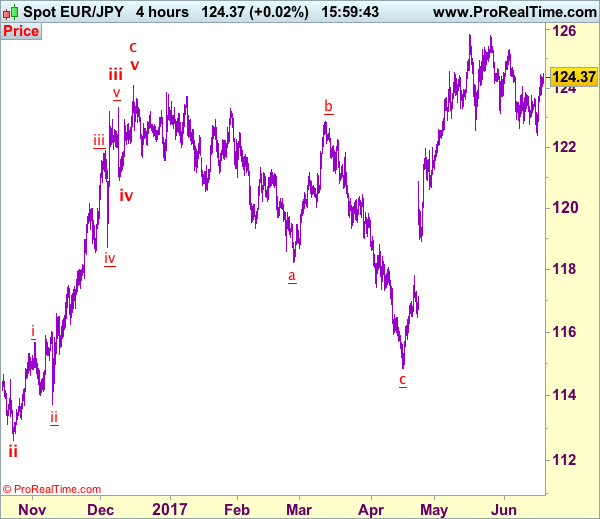
Although the single currency edged higher after staging a strong rebound from 122.40 (last week’s low), loss of near term upward momentum should prevent sharp move beyond 124.70-75 and reckon 125.00 would hold on first testing, risk from there has increased for are retreat to take place soon. Looking ahead, only a break of resistance at 125.31 would retain bullishness and suggest the correction from 125.82 has ended, bring eventual retest of this level later this month.
In view of this, would not chase this rise here and we are looking to buy euro on dips as 123.40-50 should limit downside and bring another rebound later. Below 122.90-00 would defer and risk another fall to said support at 122.40 but only break there would signal the erratic decline from 125.82 top is still in progress for correction of early upmove to 122.00, then 121.70-75.
Our latest preferred count is that wave (ii) is ABC-X-ABC which ended at 123.33 and wave (iii) is unfolding with wave iii ended at 100.77, followed by wave iv at 111.57 and wave v as well as the wave (iii) has ended at 97.04, followed by wave (iv) at 111.43 and wave (v) has ended at 94.12 which is also the end of the larger degree v, this also implied the major wave (C) has also ended there, hence major correction has commenced from there with (A) leg unfolding in its lower degree wave c which has possibly ended at 145.69. Under this count, A-B-C wave (B) has commenced with A leg ended at 136.23, wave B at 143.79 and wave C has possibly ended at 149.79.
Our larger degree count is that the decline from 139.26 is wave (C) and is sub-divided into a diagonal triangle i-ii-iii-iv-v with wave i - 105.44, wave ii- 123.33, wave iii - 97.03, wave iv - 111.43, followed by the final wave v as well as the end of wave (C) at 94.12, this also mark the bottom of larger degree wave B. Under this count, major rise in wave C has commenced as an impulsive wave with minor wave III ended at 145.69, wave V is still in progress for further gain to 150.00. Having said that, this so-called wave V could well be the first leg of larger degree 5-waver wave C and this wave C should bring at least a retest of wave A top at 169.97 (July 2008).
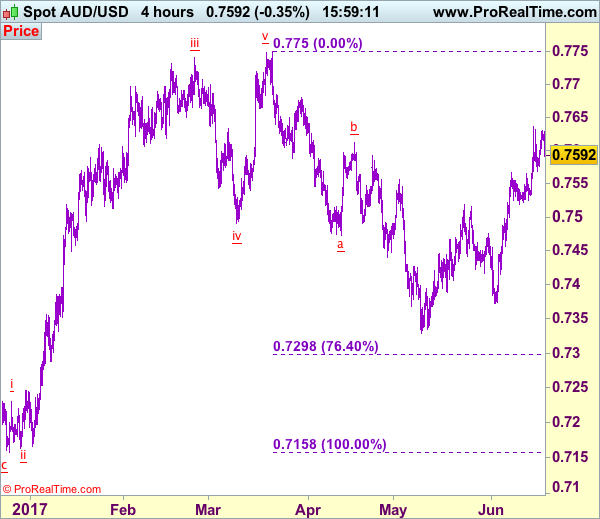
Trade Idea: AUD/USD – Buy at 0.7525
AUD/USD – 0.7592
Recent wave: Wave 5 ended at 1.1081 and major correction has commenced for fall to 0.7000 and then towards 0.6500-10
Trend: Near term up
Original strategy :
Buy at 0.7525, Target: 0.7670, Stop: 0.7465
Position: -
Target: -
Stop: -
New strategy :
Buy at 0.7525, Target: 0.7670, Stop: 0.7465
Position: -
Target: -
Stop:-
As aussie has retreated again after faltering below indicated resistance at 0.7636, retaining our view that consolidation below this level would be seen and pullback t0 0.7550-60 cannot be ruled out, however, reckon support at 0.7524 would limit downside and bring another rise later, above said resistance at 0.7636 would extend recent upmove from 0.7329 towards resistance at 0.7680 but loss of momentum should limit upside and price should falter below chart point at 0.7750.
In view of this, we are looking to buy aussie on dips as 0.7520-25 should limit downside and bring another rise. Only below support at 0.7457 would abort and suggest top is possibly formed, bring weakness to 0.7415-20 but price should stay well above key support at 0.7372, bring another rebound later.
On the 4-hour chart, the move from 0.8066 is the wave 5 with i: 0.8860, ii: 0.8315, wave iii is an extended move ended at 1.0183, iv: 0.9706 and wave v has ended at 1.1081 (also the top of entire wave 5). The subsequent selloff is the major correction which is unfolding as ABC-X-ABC and 2nd A leg has ended at 0.8848, followed by a-b-c wave B which ended at 0.9758, hence, 2nd C wave is now in progress and indicated downside target at 0.7000 and 0.6950 had been met, so further fall to 0.6710-20 cannot be ruled out.