Sample Category Title
Currencies: USD Looking For New Impetus As Post-Fed Rebound Stalls
Sunrise Market Commentary
- Rates: Slow start to trading week, with wildcard Dudley
Today's eco calendar is empty suggesting low volume neutral trading in tight ranges. Fed governor Dudley speaks and is a wildcard for dealings. Dudley is a bellwether and close ally to Fed chairwoman Yellen. US yields (10y, 30y) remain close to key support levels, even as the Fed held on to the blueprint of its future tightening cycle last week. - Currencies: USD looking for new impetus as post-Fed rebound stalls
On Friday, the dollar returned part of its post-Fed gains as US eco data disappointed. The dollar needs strong eco data or positive Fed comments to regain more ground. These factors probably won't be available today. Sterling hovers off the recent lows as the Brexit negotiations formally start.
The Sunrise Headlines
- Asian stocks rose on Monday, shaking off Wall Street's uninspiring performance on Friday. The yen slumped against all its major peers. Oil continued to retreat, trading near the lowest level since November.
- Macron's party won an absolute parliamentary majority in France (likely 350 out of 577 seats). Macron's majority gives him a free hand to push through his program of liberalizing France's labour market closer European integration.
- Fitch confirmed the Portuguese BB+ rating, but raised its outlook to positive from stable, giving the country the perspective to regain its investment grade status that it lost in 2011. Positive fiscal developments supported the decision.
- Fed Kashkari explained his dissenting vote at the FOMC meeting. He stressed the lower core inflation readings and inflation expectations and preferred the risk of not raising rates too soon, as lower core inflation might not be transitory.
- Fed Kaplan, voter & firmly in moderate camp, said the Fed must be cautious and patient in raising rates further. He wants to see more progress on achieving the 2% target and wants more evidence of that before taking the next step. This suggests there is doubt within the Fed on the timing of the next move.
- Rumours suggest pressure on PM May within her own party has increased as constituency party bosses, especially remain-voters, have called on ministers and MPs to force May from power through a no-confidence vote..
- The eco-calendar is wafer-thin today with the only event of significance being the Business Roundtable of NY Fed president Dudley
Currencies: USD Looking For New Impetus As Post-Fed Rebound Stalls
USD rally hesitates
On Friday, EUR/USD reversed part of Thursday post-Fed decline as the two day global dollar rebound stopped. Poor US housing data and weaker than expected US consumer confidence hit the dollar. USD/JPY was initially better supported by a constructive equity sentiment, but the momentum also eased later on. EUR/USD closed the session at 1.1198. USD/JPY finished the week at 110.88.
Overnight, Asian equities show moderate gains between. The Japanese trade surplus narrowed more than expected, but it was due to a sharp rise in both imports (17.8% Y/Y) and exports (14.9%). The report is an indication of better domestic demand. However, the impact on the yen is limited. USD/JPY trades in the 111 area. The kiwi dollar extended its recent rebound on better than expected consumer confidence and improvement in the services sector. NZD/USD trades in the 0.7280 area. For now, the positive risk sentiment is barely helping the dollar. EUR/USD is changing hands close to 1.12.
There are no data with market moving potential today. Political events, technical considerations and global risk sentiment on will have to guide USD trading. The party of the French president Macron secured a solid majority. Sentiment on risk is constructive at the start of the new trading week. The tech correction that weighed on global equities last week is apparently easing. Is this set-up enough to support a USD rebound? First indications from Asian show no rush to buy the dollar.
After last week's relative hawkish Fed statement, the topside in EUR/USD looked better protected and a cautious sell-on upticks approach was advised. We hold on to that view. However, sustained USD gains need better US eco data, supportive Fed comments and/or higher US yields. It's unlikely to happen today. An equity comeback might be slightly USD supportive, but we don't expect big USD progress. in this respect we keep a close eye on USD/JPY. Recently the USD/JPY performance was mediocre even as several equity indices are trading near record levels.
Technical picture
The USD/JPY rally ran into resistance in early May. A mini sell-off pushed the pair below the previous top (112.20), making the short-term picture negative and driving the pair further down in the 108.13/114.37 range. The post-Fed USD rebound pushed the pair beyond a first minor resistance at 110.81. However, there are still no follow-through gains. If the break higher is confirmed, it suggests that the USD/JPY downside momentum is easing. For now, were remain cautious to forecast a U-turn.
Early May, EUR/USD failed to break below the 1.0821/1.0778 support (gap). Poor US data and US political upheaval propelled EUR/USD north of the 1.1023 range top to a corrective top in the 1.12 area. The pair tested the 1.1300 area going into the FOMC decision, but the test is rejected. So the Trump top/correction top at 1.1300/1.1366 proved to be a solid resistance. USD sentiment will have to become very negative to clear this hurdle. A return below 1.1023 would indicate that the upside momentum has eased.
EUR/USD: test off 1.1300/66 resistance rejected, but correction remains limited for now
EUR/GBP
Sterling off recent lows as Brexit-talks start
On Friday, sterling entered calmer waters, as . However, there was no followthrough sterling buying after Thursday's BoE vote. EUR/GBP rebounded slightly off the correction low (0.8720 area), but this move mostly mirrored a modest rebound of the euro after yesterday's EUR/USD decline. The pair closed the session at 0.8760. Cable also gained a few ticks and finished the week at 1.2783.
Overnight, Rightmove House prices declined more than expected at -0.4% M/M and + 1.8% Y/Y. The focus for sterling trading will remain on the political scene. PM May still tries to find support for a minority government, while at the same time, the official Brexit talks will start. There is growing support even from a part of May's party for a softer Brexit. That should be sterling supportive, but it contains the risk of more division in the conservative party and thus global UK political uncertainty. We don't bet on a sustained sterling rebound as long as political uncertainty remains as high as it is.
From a technical point of view, EUR/GBP extensively tested the 0.8854 area (2017 top), but a real break didn't occur. Some consolidation might be on the cards after last week's post BoE EUR/GBP correction. However, the broader technical picture hasn't changed. A return below the 0.8655 correction low would be an indication that the pressure on sterling is easing. Such a break will be difficult. A EUR/GBP buy-on-dips approach is still favoured
EUR/GBP shows no clear trend as Brexit negotiations formally start
Trade Idea : USD/CHF – Buy at 0.9705
USD/CHF - 0.9731
Most recent candlesticks pattern : N/A
Trend : Near term up
Tenkan-Sen level : 0.9736
Kijun-Sen level : 0.9739
Ichimoku cloud top : 0.9744
Ichimoku cloud bottom : 0.9706
Original strategy :
Buy at 0.9705, Target: 0.9805, Stop: 0.9670
Position : -
Target : -
Stop : -
New strategy :
Buy at 0.9705, Target: 0.9805, Stop: 0.9670
Position : -
Target : -
Stop : -
As the greenback has retreated after rising to 0.9771 late last week, retaining our view that minor consolidation below this level would be seen and pullback to 0.9720 cannot be ruled out, however, reckon support at 0.9703 would limit downside and bring another rise later, above said resistance at 0.9771 would extend recent rise from 0.9613 low to resistance at 0.9808 but reckon previous resistance at 0.9825 would hold from here due to near term overbought condition, bring retreat later.
In view of this, we re looking to buy dollar on pullback as 0.9700-05 should limit downside. Below 0.9680 would defer and risk weakness towards said support at 0.9641 but only break there would abort and revive bearishness, this would also suggest the rebound from 0.9613 has ended instead, bring retest of this level later.
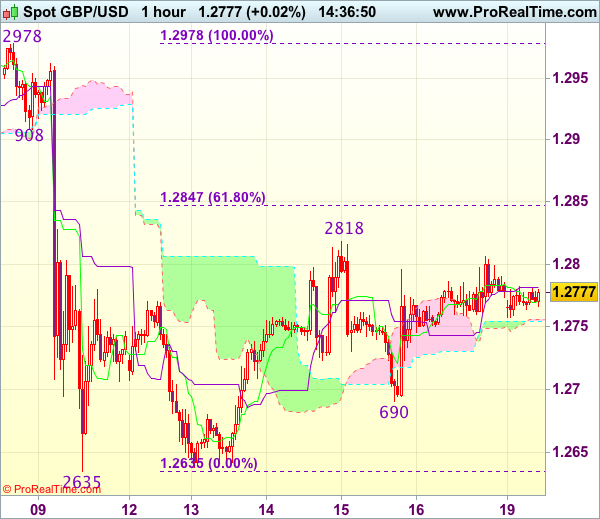
Trade Idea : GBP/USD – Stand aside
GBP/USD - 1.2778
Most recent candlesticks pattern : N/A
Trend : Near term down
Tenkan-Sen level : 1.2772
Kijun-Sen level : 1.2782
Ichimoku cloud top : 1.2756
Ichimoku cloud bottom : 1.2754
New strategy :
Stand aside
Position : -
Target : -
Stop : -
The British pound has traded narrowly after faltering below resistance at 1.2818, retaining our view that further sideways trading would be seen and cable needs to penetrate said resistance at 1.2818 to signal the erratic rise from 1.2635 low is still in progress and may extend gain to 1.2845-50 (61.8% Fibonacci retracement of 1.2978-1.2635) but upside should be limited to 1.2870-80 and price should falter below 1.2900, bring another decline later.
In view of this, would not chase this rise here and would be prudent to sell cable on further subsequent recovery, Below 1.2720-25 would suggest an intra-day top is formed, bring test of indicated support at 1.2690 but break there is needed to revive bearishness and signal the rebound from 1.2635 has ended, bring further fall to 1.2650, then towards said support at 1.2635.
Market Update – Asian Session: China Property Price Growth Slows, Japan Enters Trade Deficit
Friday US Session Highlights
(US) MAY HOUSING STARTS: 1.09M V 1.22ME (lowest since Sept); BUILDING PERMITS: 1.17M V 1.25ME (lowest since Aug)
Amazon to acquire Whole Foods Market for $42/shr in cash in $13.7B deal
(US) JUN PRELIMINARY UNIVERSITY OF MICHIGAN CONFIDENCE: 94.5 V 97.0E
(US) May Labor Market Conditions Index Change: 2.3 v 3.0e
Politics
(JP) Japan PM Abe intends to refresh his cabinet in Aug/Sept amid approval rating decline but expected to keep Fin Min Aso and top spokesman Suga - Nikkei
(JP) Japan PM Abe's cabinet approval rating declines by 12 pct points to 49%; First time below 50% in over a year - Yomiuri; Support also declines in polls from Mainichi, Nikkei and Asahi'
(AU) Australia's opposition Labor party leads ruling Coalition by 53% to 47% margin in the latest survey - Australian press
(FR) President Macron’s "En Marche" party (with centrist ally) said to take 361 out of the 577 seats in the National Assembly following 2nd round of parliamentary elections – Ipsos Sopra-Steria
Key economic data:
(CN) CHINA MAY PROPERTY PRICES M/M: RISE IN 56 OUT OF 70 CITIES VS 58 PRIOR; Y/Y: RISE IN 69 OUT OF 70 CITIES V 69 PRIOR
(JP) JAPAN MAY TRADE BALANCE: - ¥203B (first deficit in 4 months) V + ¥43BE; ADJ TRADE BALANCE: ¥134B V ¥346BE
(NZ) NEW ZEALAND MAY PERFORMANCE OF SERVICES INDEX: 58.8 V 53.2 PRIOR
(NZ) NEW ZEALAND Q2 WESTPAC CONSUMER CONFIDENCE: 113.4 V 111.9 PRIOR; 8-month high
(KR) SOUTH KOREA MAY PPI M/M: -0.2% V -0.2% PRIOR; Y/Y: 3.5% V 3.8% PRIOR
Asia Session Notable Observations
Weekend activity quiet as investors continue to process last week's FOMC hike and reconcile Fed's expectations of transitory nature of inflation retreat against the less rosy market-based view.
Key political developments include the 2nd round of French parliamentary elections, giving Macron's En Marche party a comfortable margin to govern with absolute majority. In Japan, approval ratings for PM Abe's cabinet dipped below 50% for the first time in over a year on allegations of favoritism over plans to establish a veterinary school in a government-designated special zone for deregulation. Cabinet officials indicated Abe is willing to reshuffle his cabinet, but likely to retain Fin Min Aso and Spokesperson Suga.
In economic data, Japan May Trade fell into deficit for the first time in 4 months - export growth at 15% was below 16% consensus, while Import grew by 18% - higher than 15% expected. Shipments to Asia, China, US, and Europe were all up double digits. In China, annualized property price growth continued to slow to 10.4% across top 70 cities vs 10.7% prior.
Speakers and Press
China
(CN) S&P: China property sector may see a cyclical downturn in H2 of this year
(CN) China regulators said to have loosened trade zone restrictions - Chinese press
(CN) China National Development and Reform Commission (NDRC) wants banks in Beijing to cancel the interest rate floor for corporate loans, lowering loan costs – financial press
(CN) China’s National Development and Reform Commission (NDRC) to allow some coal miners to increase capacity – financial press
(CN) China may cancel restrictions on futures investment by financial companies – Chinese Press
Japan
(JP) Japan PM Abe's cabinet approval rating declines by 12 pct points to 49%; First time below 50% in over a year - Yomiuri; Support also declines in polls from Mainichi, Nikkei and Asahi
(JP) Japan cabinet spokesperson Suga: Not swayed by movements in opinion polls; PMs have the right to reshuffle cabinets - press
Australia / New Zealand
(AU) RBA Gov Lowe: Economy is capable of stronger growth and Australia will fall behind without sharp focus on reforms
Korea
(KR) South Korea's FTC to push for a meeting with top four conglomerates - press
(KR) South Korea President Moon reiterates plan to phase out nuclear power
(KR) South Korea to limit mortgage limits to 60% (current 70%) of mortgage value in Seoul and cities showing heavy buying; effective July 3rd
Asian Equity Indices/Futures (00:00ET)
Nikkei +0.7%, Hang Seng +0.9%, Shanghai +0.7%, ASX200 +0.3%, Kospi +0.4%
Equity Futures: S&P500 +0.2%; Nasdaq +0.4%, Dax +0.2%, FTSE100 +0.2%
FX ranges/Commodities/Fixed Income (00:00ET)
EUR 1.1190-1.1210; JPY 110.75-111.15; AUD 0.7615-0.7630; NZD 0.7250-0.7300; GBP 1.2760-1.2780
Aug Gold -0.2% at 1,255/oz; July Crude Oil -0.3% at $44.83/brl; July Copper +0.1% at $2.57/lb
(US) Weekly Baker Hughes US Rig Count: 933 v 927 w/w (+0.6%) (22nd straight weekly rise)
(CN) PBOC SETS YUAN MID POINT AT 6.7972 V 6.7995 PRIOR
(CN) PBOC to inject combined CNY120B v CNY290B prior in 7-day, 14-day and 28-day reverse repos
(AU) Australia sells A$400M in 3.75% 2037 bonds; avg yield 3.0158%; bid-to-cover 2.96x
(KR) South Korea MOF sells 10-yr bonds; avg yield 2.170%
Asia equities/Notables/movers
Hong Kong
Chevalier International Holdings (25) +3.6%; Issues positive profit alert for FY17
Yuan Heng (332) -1.5%; Issues profit warning, citing stiff market competition
Man Wah (1999) -2.6%; Comments on Muddy Waters report, says it stands by the 2017 annual report
Wanjia (401) -2.9%; Reports FY17 Net loss HK$25.8M v loss HK$13.8M y/y, Rev HK$985.9M v HK$1.32B y/y
Australia
AWE Lted (AWE) +9.6%; Reports primary and secondary targets were intersected at Waitsia
Australian Finance Group (AFG) +7.9%; Guides FY17 Net A$37.0-37.8M v A$26Me
ANZ (ANZ) +0.8%; Said to value its Wealth unit at about A$5B - Australian press
Japan
Toshiba (6502) +2.7%; Expected to finalize sale of chip unit to Bain-led group - Japanese Press
NEC (6701) +2.1%; Guides Q1 Op profit ¥100B v loss ¥29.9B y/y - Japanese Press
RBA’s Governor Lowe Expects Stronger Growth In Australia In Coming Years
For the 24 hours to 23:00 GMT, the AUD rose 0.5% against the USD and closed at 0.7624 on Friday.
LME Copper prices rose 0.3% or $18.5/MT to $5655.5/MT. Aluminium prices declined 0.2% or $3.0/MT to $1861.0/MT.
In the Asian session, at GMT0300, the pair is trading at 0.7622, with the AUD trading a tad lower against the USD from Friday's close.
Overnight, the Reserve Bank of Australia's (RBA) Governor, Philip Lowe, remained upbeat over Australian economy, stating that Australia's economic growth over the next couple of years will be a bit stronger than it has been recently.
The pair is expected to find support at 0.7589, and a fall through could take it to the next support level of 0.7555. The pair is expected to find its first resistance at 0.7643, and a rise through could take it to the next resistance level of 0.7663.
Moving ahead, market participants will focus on the Reserve Bank of Australia's (RBA) June meeting minutes, scheduled to release tomorrow.
The currency pair is showing convergence with its 20 Hr moving average and trading above its 50 Hr moving average.

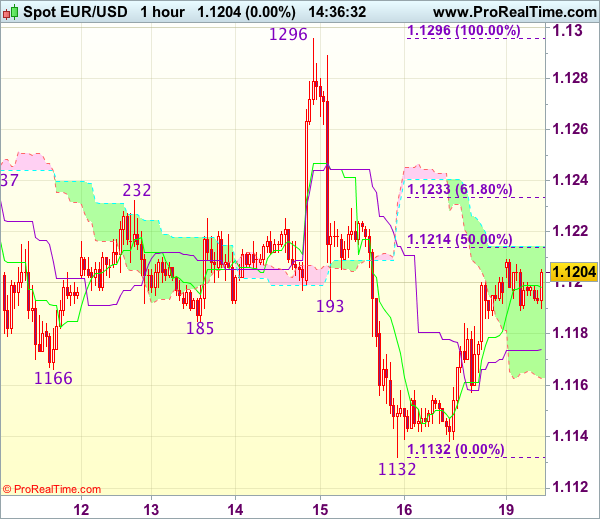
Trade Idea : EUR/USD – Sell at 1.1235
EUR/USD - 1.1203
Most recent candlesticks pattern : N/A
Trend : Near term down
Tenkan-Sen level : 1.1199
Kijun-Sen level : 1.1174
Ichimoku cloud top : 1.1214
Ichimoku cloud bottom : 1.1163
Original strategy :
Sell at 1.1220, Target: 1.1120, Stop: 1.1255
Position : -
Target : -
Stop : -
New strategy :
Sell at 1.1235, Target: 1.1135, Stop: 1.1270
Position : -
Target : -
Stop : -
As the single currency has continued trading with a firm undertone and near term upside risk remains for the rebound from 1.1132 (last week’s low) to extend gain towards 1.1230-35 (61.8% Fibonacci retracement of 1.1296-1.1132), however, if our view that top has been formed at 1.1296 is correct, upside should be limited and bring retreat later, below 1.1155-60 would bring retest of 1.1132, break there would extend recent decline from 1.1296 top to previous support at 1.1109.
In view of this, we are looking to sell euro on further recovery as 1.1230-35 (61.8% Fibonacci retracement of 1.1296-1.1132) should limit upside and bring another decline. Above 1.1260-70 would defer and risk a stronger rebound but price should falter well below said resistance at 1.1296, bring another decline later.
Euro-Zone’s Annual Inflation Confirmed At 1.4% In May
For the 24 hours to 23:00 GMT, the EUR rose 0.45% against the USD and closed at 1.1200 on Friday.
Macroeconomic data showed that the Euro-zone's final consumer price index advanced 1.4% on an annual basis in May, confirming the flash estimate and following a gain of 1.9% in the previous month.
The greenback lost ground against a basket of major currencies on Friday, following downbeat US economic data that raised fresh doubts over the state of the nation's economy.
The US flash Reuters/Michigan consumer sentiment index dropped more-than-expected to a level of 94.5 in June, suggesting that consumers are losing confidence over the country's growth prospects amid ongoing political unrest in Washington. In the preceding month, the index had registered a reading of 97.1, while market participants expected for drop to a level of 97.0. Moreover, the nation's housing starts dipped to an eight-month low level on a monthly basis in May, after it unexpectedly fell 5.5%, to an annual rate of 1092.0K, compared to a revised reading of 1156.0K in the previous month. Markets were expecting housing starts to rise to a level of 1220.0K. Further, the nation's building permits surprisingly eased 4.9% MoM, to an annual rate of 1168.0K in May, while investors had envisaged it to climb to a level of 1249.0K and following a revised reading of 1228.0K in the previous month. Also, the nation's labour market conditions index declined more-than-expected to a level of 2.3 in May, compared to a revised reading of 3.7 in the previous month.
In the Asian session, at GMT0300, the pair is trading at 1.1196, with the EUR trading slightly lower against the USD from Friday's close.
Over the weekend, the French President, Emmanuel Macron, won a decisive majority in French parliamentary elections.
The pair is expected to find support at 1.1154, and a fall through could take it to the next support level of 1.1113. The pair is expected to find its first resistance at 1.1222, and a rise through could take it to the next resistance level of 1.1249.
Going ahead, investors will look forward to the Euro-zone's construction output data for April, slated to release in a few hours. Moreover, in the US, a speech by William Dudley, due later in the day, will be on investors' radar.
The currency pair is trading above its 20 Hr and 50 Hr moving averages.

UK Set To Kick-Off Brexit Negotiations Today
For the 24 hours to 23:00 GMT, the GBP rose 0.24% against the USD and closed at 1.2784 on Friday.
In the Asian session, at GMT0300, the pair is trading at 1.2770, with the GBP trading 0.11% lower against the USD from Friday's close, as political uncertainty continues to run high as Britain begins its negotiations to exit the European Union today.
Overnight data revealed that UK's Rightmove house prices declined 0.4% MoM in June, following a gain of 1.2% in the previous month.
The pair is expected to find support at 1.2751, and a fall through could take it to the next support level of 1.2732. The pair is expected to find its first resistance at 1.2797, and a rise through could take it to the next resistance level of 1.2824.
The currency pair is trading below its 20 Hr moving average and showing convergence with its 50 Hr moving average.

Japanese Adjusted Merchandise Trade Surplus Unexpectedly Narrowed In May
For the 24 hours to 23:00 GMT, the USD slightly declined against the JPY and closed at 110.83 on Friday.
The Bank of Japan (BoJ) Governor, Haruhiko Kuroda, stated that inflation is still far from reaching the BoJ’s 2.0% target and thus it is “inappropriate” to say how the central bank would exit its massive stimulus programme.
In the Asian session, at GMT0300, the pair is trading at 110.99, with the USD trading 0.14% higher against the JPY from Friday’s close.
Overnight data showed that Japan’s adjusted merchandise trade surplus surprisingly narrowed to a level of ¥133.8 billion in May, compared to market expectations for it to widen to a level of ¥345.5 billion and after recording a revised surplus of ¥157.6 billion in the prior month.
The pair is expected to find support at 110.62, and a fall through could take it to the next support level of 110.25. The pair is expected to find its first resistance at 111.39, and a rise through could take it to the next resistance level of 111.79.
The currency pair is showing convergence with its 20 Hr moving average and trading above its 50 Hr moving average

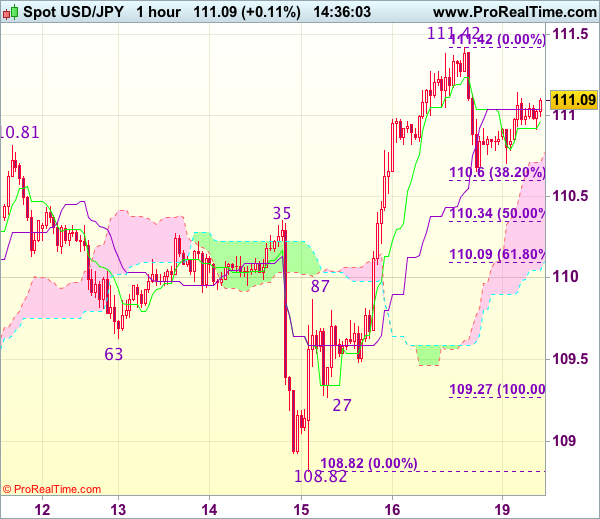
Trade Idea : USD/JPY – Buy at 110.35
USD/JPY - 111.08
Most recent candlesticks pattern : N/A
Trend : Near term up
Tenkan-Sen level : 110.96
Kijun-Sen level : 111.04
Ichimoku cloud top : 110.71
Ichimoku cloud bottom : 110.05
Original strategy :
Buy at 110.35, Target: 111.35, Stop: 110.00
Position : -
Target : -
Stop : -
New strategy :
Buy at 110.35, Target: 111.35, Stop: 110.00
Position : -
Target : -
Stop : -
Dollar’s retreat after meeting resistance at 111.42 has retained our view that consolidation below this level would be seen and pullback to 110.30-35 (50% Fibonacci retracement of 109.27-111.42) cannot be ruled out, however, renewed buying interest should emerge there and bring rebound later, above 111.25-30 would bring retest of 111.42 but break there is needed to confirm the rise from 108.82 low has resumed for retracement of recent decline from 114.37 to 111.60 (50% Fibonacci retracement of 114.37-108.82) and then test of previous resistance at 111.71 but price should falter well below another resistance at 112.13.
In view of this, we are looking to buy dollar on pullback but one should exit on next rise. Below 110.05-10 (61.8% Fibonacci retracement of 109.27-111.42) would abort and signal top has been formed, bring further fall to 109.85-90 and possibly towards 109.50 but support at 109.27 should remain intact.