
Sample Category Title
USDJPY Likely To Remain Bullish In The Week Ahead
Key Points:
- USDJPY likely to remain bullish in the near term as Dollar surges.
- BOJ discussing removing stimulus and tapering.
- Watch for a move towards the 112.00 handle in the coming week.
The USDJPY was strongly positive throughout most of last week as the pair rallied strongly in response to the U.S. Fed’s decision to hike interest rates. Subsequently, the pair closed the week sharply higher around the 1.1084 mark and within striking distance of the 100 Day MA. However, it remains to be seen if the USDJPY can mount a successful attack on the 112 handle in the near term. So let’s take a look at what occurred last week and what is potentially looming on the horizon in the week ahead.
The USDJPY had a relatively strong week as the pair reacted to a hawkish move by the U.S. Federal Reserve to raise the Federal Funds Rate by 25 basis points. This saw the pair moving sharply to the upside and was exacerbated by a highly negative JPY Core Machinery Orders result of -3.1%. Subsequently, the USDJPY rallied sharply to close the week around the 110.84 mark and is now relatively close to breaking the declining 50 and 100 Day MA’s.
In addition, the Bank of Japan was also active late in the week with their monetary policy decision to keep rates on hold at -0.10%. Although this didn’t prove to be a volatility inducing event it did provide some forward guidance that could potentially impact the pair over the medium term. In fact, the bank is still in the process of releasing their latest reports on the impact of their plans to remove some stimulus from the market. Subsequently, it could be some time before we see an actionable plan but if the BOJ does move to taper then we could see a significant impact upon the JPY.
The coming week is likely to focus strongly on the U.S. Unemployment Claims and Flash Manufacturing PMI figures given the abject lack of Japanese economic data due out. Subsequently, it would pay dividends to keep a close watch on the labour market data as it will need to provide a surprise, above the forecasted 240k, to guarantee a rally. In contrast, the Flash Manufacturing PMI will in all likelihood come in right on forecasts at 53.0 so will play less of a role in driving the near term trend.
From a technical perspective, the USDJPY’s recent rally has taken it relatively close to breaking above the 50 and 100 Day EMA’s. Additionally, the RSI Oscillator appears to be climbing out of the doldrums and rising within neutral territory. Subsequently, our initial bias for the week ahead is cautiously bullish and we would expect to see further gains towards the 112.00 handle. Support is currently in place for the pair at 109.11, and 108.16. Resistance exists on the upside at 111.41,112.19, and 113.76.
Ultimately, the ongoing technical resurgence of the USDJPY is likely to continue in the near term, especially if price action can surmount dynamic resistance around the 100 Day MA. In addition, there is next to no Japanese economic news of any significance due for release which means that the focus is likely to stay upon the buoyant U.S. labour market results. Subsequently, there are plenty of reasons to believe that the USDJPY will continue to trend higher and towards the 1.12 handle.
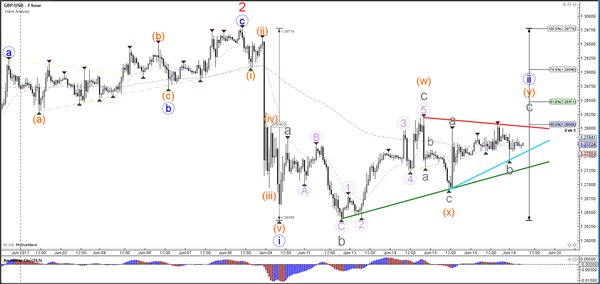
Daily Technical Analysis: EUR/USD Wave 2 Pullback At 1.1250 Resistance
Currency pair EUR/USD
The EUR/USD showed strong bearish momentum which is why it has been marked as a wave 1 (brown). However, price will need to break below the support trend line (blue) to confirm the end of the long-term uptrend.
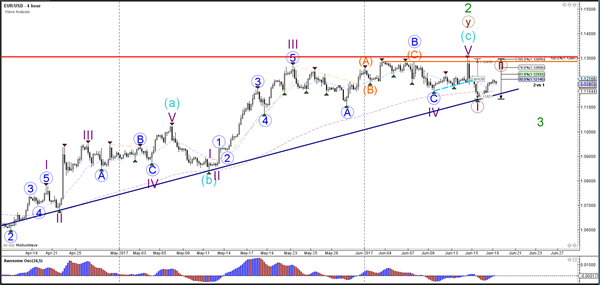
The EUR/USD is building a potential ABC (blue) zigzag within wave 2 (brown). A break above the 100% Fib level and resistance (red) invalidates the bearish reversal.
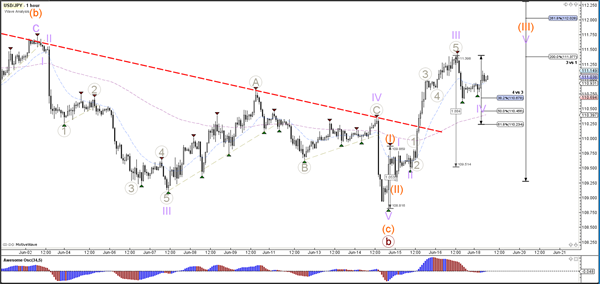
Currency pair USD/JPY
The USD/JPY seems to be building bullish momentum (orange 3) within wave C (brown) after breaking above the resistance trend line (red).
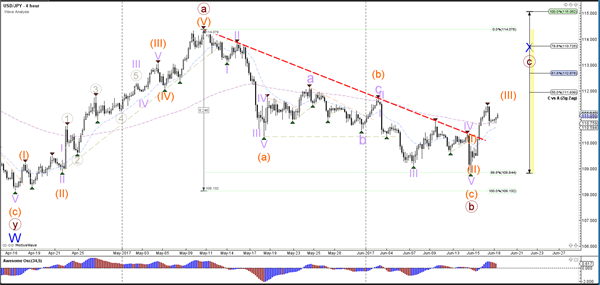
The USD/JPY could have completed wave 3 (purple) and retraced back to the 38.2% Fibonacci level within the wave 4 (purple) correction.
Currency pair GBP/USD
The GBP/USD could be building a correction within wave 2 (blue). A bearish breakout below support (green) could confirm wave 3 (red) but a break above the 100% Fib level invalidates wave 2 (blue).
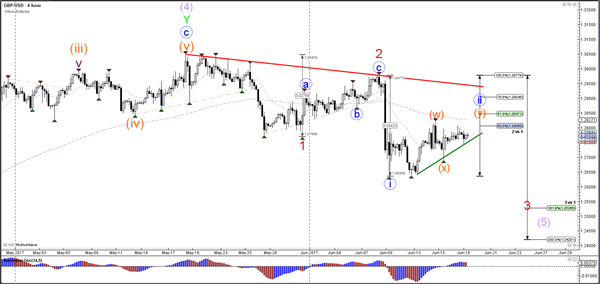
The GBP/USD needs to break below support (blue/green) to confirm a potential wave 3 (blue). The Fibonacci levels of wave 2 (blue) could act as resistance.
Weekly Technical Outlook And Review: EUR/USD, GBP/USD, AUD/USD, USD/JPY, USD/CAD, USD/CHF, DOW 30, GOLD
A note on lower timeframe confirming price action...
Waiting for lower timeframe confirmation is our main tool to confirm strength within higher timeframe zones, and has really been the key to our trading success. It takes a little time to understand the subtle nuances, however, as each trade is never the same, but once you master the rhythm so to speak, you will be saved from countless unnecessary losing trades. The following is a list of what we look for:
- A break/retest of supply or demand dependent on which way you're trading.
- A trendline break/retest.
- Buying/selling tails ... essentially we look for a cluster of very obvious spikes off of lower timeframe support and resistance levels within the higher timeframe zone.
- Candlestick patterns. We tend to only stick with pin bars and engulfing bars as these have proven to be the most effective.
We typically search for lower-timeframe confirmation between the M15 and H1 timeframes, since most of our higher-timeframe areas begin with the H4. Stops are usually placed 1-3 pips beyond confirming structures.
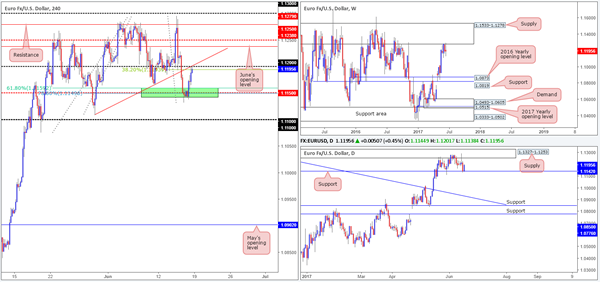
EUR/USD
Weekly gain/loss: 0
Weekly closing price: 1.1195
Despite the single currency ranging over 160 pips last week, there was absolutely no change registered at the close. What we did see form, however, was a clear-cut indecision weekly candle that tested the lower boundary of a major weekly supply coming in at 1.1533-1.1278.
Since the 22nd May, the daily candles have been consolidating between supply logged at 1.1327-1.1253 (glued to the underside of the said weekly supply zone) and a support level penciled in at 1.1142. A decisive close below this support could potentially place the trendline support etched from the high 1.1616 in the firing range, followed closely by support at 1.0850. To the upside, a break through the current supply may see price attempt to attack 1.1382: a daily Quasimodo resistance level.
For those who read Friday's report you may recall that we showed interest in buying from the 1.1150 neighborhood should a reasonably sized H4 bull candle (preferably a full-bodied candle) take shape. This was due to the following converging structures (a H4 trendline support taken from the low 1.1075 was initially included but is now considered invalid on the H4 chart):
A H4 61.8% Fib support at 1.1159 drawn from the low 1.1074.
A H4 78.6% retracement level pegged at 1.1149 penciled in from the low 1.1109.
A daily support level seen at 1.1142.
As you can see, H4 action rallied from the green buy zone on Friday, which saw price wrap up the week shaking hands with the 1.12 handle (intersects nicely with a H4 trendline resistance extended from the low 1.1109 and a H4 38.2% Fib resistance at 1.1193 taken from the high 1.1295).
Our suggestions: In short, here's what we're looking at right now.
Weekly price indicates shorts may take the lead this week.
Daily price on the other hand, recently recovered from support at 1.1142 and could pull the major back up to the aforementioned supply.
H4 price is seen trading around a particularly confluent sell zone.
Given the above points, we feel the sellers may have the upper hand here at the moment. However, before we look to short from 1.12, our team would require additional H4 price confirmation in the form of a bearish candle (preferably a full-bodied candle). This will by no means guarantee that the sellers will continue to push lower, but what it will do is show seller intent around a high-probability sell zone that boasts weekly confluence.
Data points to consider: German Buba President Weidmann speaks at 4pm. FOMC Member Dudley speaks at 1pm GMT+1.
Levels to watch/live orders:
- Buys: Flat (stop loss: N/A).
- Sells: 1.12 region ([waiting for a reasonably sized H4 bear candle – preferably a full-bodied candle – to form before pulling the trigger is advised] stop loss: ideally beyond the candle's wick).
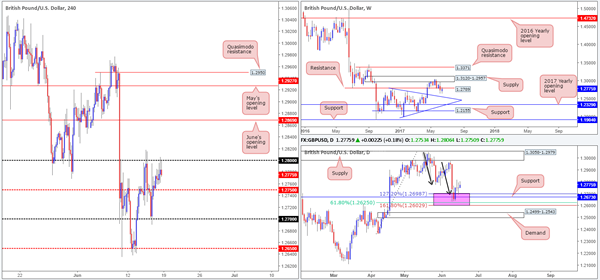
GBP/USD
Weekly gain/loss: + 35 pips
Weekly closing price: 1.2775
Following the close below weekly support at 1.2789 two weeks back, weekly price ended last week's segment retesting the underside of this line as resistance. The question is, will it hold? Assuming that it does, we could witness price selloff down to a trendline support taken from the high 1.2774.
The story on the daily timeframe, nonetheless, shows the candles recovering from 1.2602/1.2698 (an area marked in pink). This zone is comprised of a support level coming in at 1.2673, a 61.8% Fib support at 1.2625 (taken from the low 1.2365) and an AB=CD (black arrows) 127.2/161.8% ext. completion point seen at 1.2602/1.2698 (drawn from the high 1.3047).
A quick recap of Friday's movement on the H4 chart reveals that the 1.28 handle held firm as resistance going into the closing bell. This should not really come as much of a surprise considering that 1.28 sits only 20 or so pips above the said weekly resistance level. Consequent to this, 1.28 will likely play a key role today/this week.
Our suggestions: A decisive H4 close above 1.28 would likely place June's opening level at 1.2869 in the spotlight, and confirm buyer strength from the aforementioned daily zone marked in pink. On the other hand, further rejection from 1.28 may lead to the daily zone being taken out and price challenging the daily demand seen below it at 1.2499-1.2543, which happens to converge nicely with the aforementioned weekly trendline support.
Nevertheless, no matter which direction you pick to take this week, you'll be trading against higher-timeframe flow! With that being the case, our team has decided to remain on the sidelines for the time being until we have more of a defined direction in this market.
Data points to consider: FOMC Member Dudley speaks at 1pm GMT+1.
Levels to watch/live orders:
- Buys: Flat (stop loss: N/A).
- Sells: Flat (stop loss: N/A).
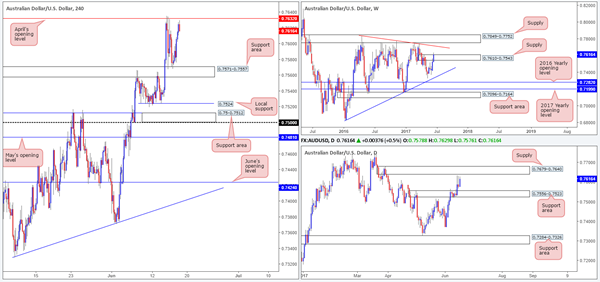
AUD/USD
Weekly gain/loss: + 88 pips
Weekly closing price: 0.7616
Over the last week we saw the bulls continue to lift price higher, marginally closing above weekly supply at 0.7610-0.7543. However, it may be worth waiting for this week's candle to close before presuming that the said weekly supply is consumed, since it could just as well be a fakeout.
Zooming in and looking at the daily timeframe, we can see that the unit ended the week closing just ahead of a supply zone pegged at 0.7679-0.7640. This further confirms the need to wait for the this week's candle to close, as the current daily supply may hold and bring the commodity currency back down to the support area penciled in at 0.7556-0.7523.
H4 action, as you can see, remains consolidating between April's opening level at 0.7632 and the support area coming in at 0.7571-0.7557. Of particular interest here is April's opening level is sited just 8 pips below the lower edge of the daily supply mentioned above at 0.7679-0.7640.
Our suggestions: Although weekly price printed a minor close above supply, both the H4 and daily charts indicate that the bears have a fighting chance here! To our way of seeing things, an ideal scenario would be for H4 price to chalk up a bearish selling wick that whipsaws through 0.7632, connects with the daily supply and then closes back below 0.7632. This would, in our humble opinion, be enough evidence to validate a sell, with an initial target objective set at the said H4 support area.
Data points to consider: RBA Gov. Lowe speaks at 12.30am. FOMC Member Dudley speaks at 1pm GMT+1.
Levels to watch/live orders:
- Buys: Flat (stop loss: N/A).
- Sells: Look for H4 price to chalk up a bearish selling wick that whipsaws through 0.7632 and connects with the daily supply (stop loss: ideally beyond the candle's wick).
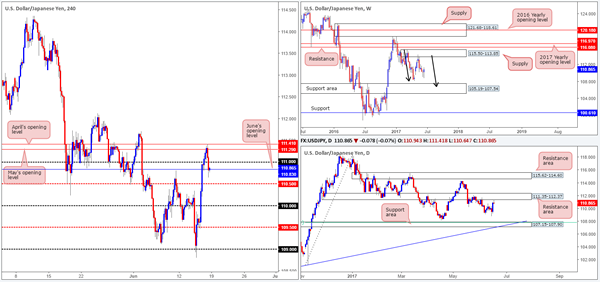
USD/JPY
Weekly gain/loss: + 55 pips
Weekly closing price: 110.86
In spite of last week's trade printing a gain, weekly bears remain in a relatively strong position after pushing aggressively lower from supply registered at 115.50-113.85. We know there's a lot of ground to cover here, but this move could possibly result in further downside taking shape in the form of a weekly AB=CD correction (see black arrows) that terminates within a weekly support area marked at 105.19-107.54 (stretches all the way back to early 2014).
Down on the daily chart, price recently made contact with a resistance area drawn from 111.35-112.37. Considering that this base has been in play since the end of November 2016, and the weekly candles also show bearish intentions, we expect the sellers to remain in a dominant position. The next downside target from here can be seen at 107.15-107.90: a support zone that's glued to the top edge of the said weekly support area.
For those who managed to catch Friday's report you may recall that we highlighted April/May's opening levels seen at 111.41/111.29 as a potential sell zone. We also said that due to the zone between these two levels being relatively small, we'd advise waiting for lower-timeframe confirmation (see the top of this report) before pulling the trigger. Unfortunately, we were unable to pin down a lower-timeframe setup from here, but what we did see was a H4 bearish candle, shaped in the form of a full-bodied candle, print from this zone. If we were not long the DOW 30, this would have been an attractive trade. Well done to any of our readers who managed to jump aboard here.
Our suggestions: As we write, H4 price established minor support around June's opening base line at 110.83 into the week's end. Personally, with what we've noted on the bigger picture, we do not see H4 price breaching the nearby 111 handle today. Regrettably however, trading short from below 110.86 is difficult given how near the H4 mid-level support at 110.50 is seen.
Therefore, if you're currently short, we would look to hold the position for lower prices. If you missed the train from 111.41/111.29, nevertheless, we do not much else to hang our hat on at this time.
Data points to consider: FOMC Member Dudley speaks at 1pm GMT+1.
Levels to watch/live orders:
- Buys: Flat (stop loss: N/A).
- Sells: Flat (stop loss: N/A).
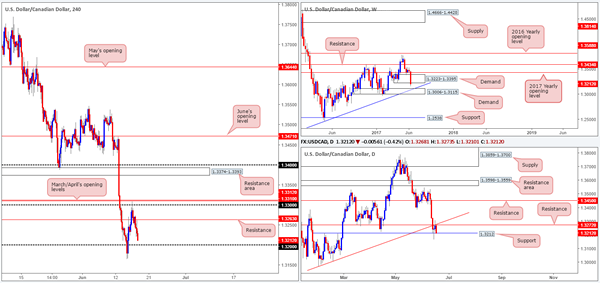
USD/CAD
Weekly gain/loss: – 250 pips
Weekly closing price: 1.3212
During the course of last week's trading the USD/CAD plummeted lower, marginally closing beyond weekly demand at 1.3223-1.3395. While this recent break could imply that a move down to weekly demand at 1.3006-1.3115 (converges with a weekly trendline support taken from high 1.1278) may take place, there's also a chance that this could simply be fakeout.
Down on the daily chart, things have recently been a tad cramped as price has been sandwiched between support at 1.3212 and resistance at 1.3272, which happens to meet with a trendline resistance extended from the low 1.2968. As can be seen from the chart, the pair ended the week closing around the said support, so there is a chance that we may see bids come into this market today.
A closer look at price action on the H4 chart shows that the support at 1.3263 did eventually give way, with the pair ending the day closing just ahead of the 1.32 handle. With daily support positioned just above this psychological band, weekly bears may struggle to continue pushing lower this week. With that, we will not be committing to any shorts at current price.
Our suggestions: In regards to longs, 1.32 could be an option today. A break below the daily support level at 1.3212 would likely trigger stops positioned beneath this barrier, thus providing liquidity to buy into. Furthermore, let's also bear in mind that beneath the weekly demand, stops have also likely been triggered thus providing additional liquidity.
Ultimately, what we're looking for is a full-bodied (or very near) H4 bull candle to form from 1.32. This would be a solid cue to enter long and target the H4 resistance pegged at 1.3263 as an initial take-profit zone.
Data points to consider: FOMC Member Dudley speaks at 1pm GMT+1.
Levels to watch/live orders:
- Buys: 1.32 region ([waiting for a reasonably sized H4 bull candle – preferably a full-bodied candle – to form before pulling the trigger is advised] stop loss: ideally beyond the candle's tail).
- Sells: Flat (Stop loss: N/A).
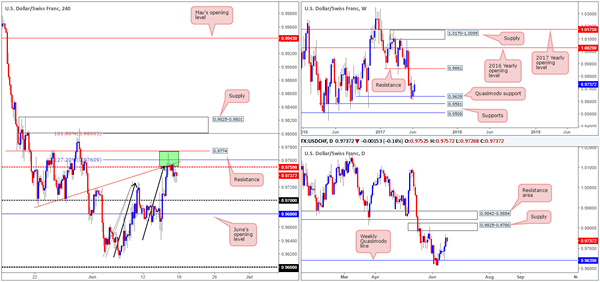
USD/CHF
Weekly gain/loss: + 49 pips
Weekly closing price: 0.9737
Recent action shows that the USD/CHF extended its bounce from the weekly Quasimodo support at 0.9639. In the event that the bulls continue to press forward, the next barrier in view is a resistance level coming in at 0.9861.
Down on the daily timeframe, nonetheless, we have price trading nearby a supply zone formed at 0.9825-0.9786. This zone, as you can probably see, is sited 35 or so pips below the said weekly resistance level, which happens to be encased within a daily resistance area at 0.9842-0.9884.
Looking over to the H4 candles, you can see that the green area at 0.9774/0.9750 managed to hold prices lower on Friday. 0.9774/0.9750 is comprised of a H4 resistance level at 0.9774, a H4 AB=CD 127.2% ext. at 0.9760 taken from the low 0.9613, a H4 trendline resistance etched from the low 0.9691 and a H4 mid-level resistance drawn from 0.9750. The H4 supply at 0.9825-0.9801 seen above, however, houses a H4 AB=CD 161.8% ext. at 0.98 taken from the low 0.9613 and the round number 0.98.
The interesting thing here, as we mentioned in Friday's report, is that the lower (green) H4 area has no higher-timeframe convergence, whereas the H4 supply positioned above is located around the upper edge of daily supply marked at 0.9825-0.9786.
Our suggestions: Even though the H4 candles remain capped by the said H4 green zone on Friday, our desk has decided to hold fire and wait and see if H4 price can extend up to supply seen at 0.9825-0.9801, simply due to the higher-timeframe confluence seen here. Should price strike this area today/this week, we would, dependent on the time of day, look to sell from here at market, with stops sited at 0.9827, targeting 0.9750 as an initial take-profit zone.
Data points to consider: FOMC Member Dudley speaks at 1pm GMT+1.
Levels to watch/live orders:
- Buys: Flat (stop loss: N/A).
- Sells: 0.98 (stop loss: 0.9827).
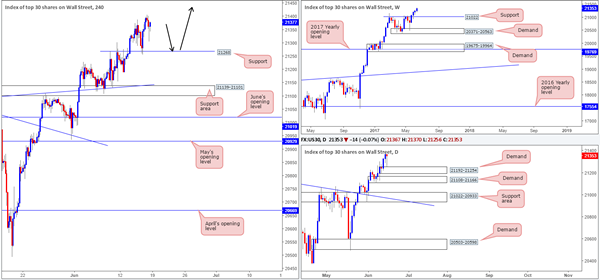
DOW 30:
Weekly gain/loss: 99 points
Weekly closing price: 21353
US equities climbed higher for a fourth consecutive week, managing to record a fresh record high of 21388. If the unit was to pullback, the weekly support level drawn from 21022 would likely be where you'll find price stabilize and potentially bounce.
Turning our attention to the daily timeframe, Friday's candle printed a rather nice-looking buying tail off the top edge of a minor demand at 21192-21254. This – coupled with there being absolutely no higher-timeframe resistance seen ahead, likely implies that further buying could be seen this week.
For those who have been following our reports over the past few days you may recall that our desk recently took a small long position at 21164 and initially placed stops below the H4 support area (21139-21101) at 21097. The position is still active, but we have liquidated 50% of the trade around the 21234 neighborhood.
Fortunately, the index has continued to push higher, as we are now trailing this market with the remainder of our position. The stop-loss order has been moved to 21247, a few points below the current H4 support at 21268, putting our overall gain into respectable numbers.
Our suggestions: Personally, we are looking for price to continue rallying, as we intend on trailing this trend long term. Should a second retest of 21268 be seen this week, bolstered by a full or near-full-bodied bullish candle, we may look to add to our current position (as per the black arrows) and trail accordingly.
Data points to consider: FOMC Member Dudley speaks at 1pm GMT+1.
Levels to watch/live orders:
- Buys: 21164 ([live] stop loss: 21247). 21268 region ([waiting for a reasonably sized H4 bull candle – preferably a full-bodied candle – to form before pulling the trigger is advised] stop loss: ideally beyond the candle's tail).
- Sells: Flat (stop loss: N/A).
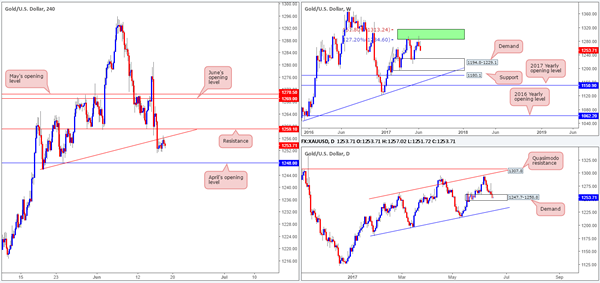
GOLD:
Weekly gain/loss: – $13.4
Weekly closing price: 1253.7
The yellow metal sustained further losses last week, following the prior week's rejection from an area comprised of two weekly Fibonacci extensions 161.8/127.2% at 1313.7/1285.2 taken from the low 1188.1 (green zone). From the weekly scale, there's room for the precious metal to continue pumping lower until we reach the demand base coming in at 1194.8-1229.1.
Daily price is still seen teasing the demand base coming in at 1247.7-1258.8, but remains vulnerable. Pressure from weekly sellers could see this area consumed, which in turn would likely bring the candles down to the channel support taken from the low 1180.4 (intersects with the above said weekly demand base).
A brief look at recent dealings on the H4 chart shows bullion retested the underside of the recently broken trendline support taken from the low 1249.3 for a second time, and held firm. The next level of interest below is April's opening line at 1248.0.
Our suggestions: Buying from within the current daily demand is not something we'd feel comfortable with given the position of both weekly and H4 price at the moment.
With daily price showing signs of weakness within the current daily demand, and H4 action indicating space to move down to at least April's opening level at 1248.0, as well as weekly price also reflecting a strong bearish stance, we believe the bears may take the lead this week. Therefore, should H4 price retest the said H4 trendline resistance for a third time and form a reasonably sized H4 bear candle, shorts are an option, with 1248.0 being the initial take-profit target. A decisive H4 close beyond here would likely attract further selling down to the top edge of the weekly demand at 1229.1.
Levels to watch/live orders:
- Buys: Flat (stop loss: N/A).
- Sells: Watching for H4 price to retest the current H4 trendline resistance and form a reasonably sized H4 bear candle (stop loss: ideally beyond the candle's wick).
European Open Briefing: The US Dollar Came Again Under Pressure In Asia
Global Markets:
- Asian stock markets: Nikkei up 0.60 %, Shanghai Composite rose 0.45 %, Hang Seng rallied 1.00 %, ASX 200 gained 0.30 %
- Commodities: Gold at $1255 (-0.10 %), Silver at $16.65 (-0.05 %), WTI Oil at $44.85 (-0.30 %), Brent Oil at $47.25 (-0.30 %)
- Rates: US 10-year yield at 2.16, UK 10-year yield at 1.02, German 10-year yield at 0.28
News & Data:
- New Zealand Westpac Consumer Sentiment 113.4 vs 111.9 previous
- Japan Trade Balance -JPY203bln vs JPY76bln expected
- Japan Exports 14.9 % vs 16.1 % expected
- Japan Imports 17.8 % vs 14.8 % expected
- Australia New Motor Vehicle Sales 2.9 % vs 0.3 % previous
- China House Prices 10.4 % vs 10.7 % previous
- UK House Price Index -0.4 % vs 1.2 % previous
- Asia stocks shake off Wall St. blues, sterling steady before Brexit talks – RTRS
- Oil prices fall on further rise in US drilling, signs of slowing demand – RTRS
- Dollar firm before Fed's Dudley speech, euro and pound hold steady – RTRS
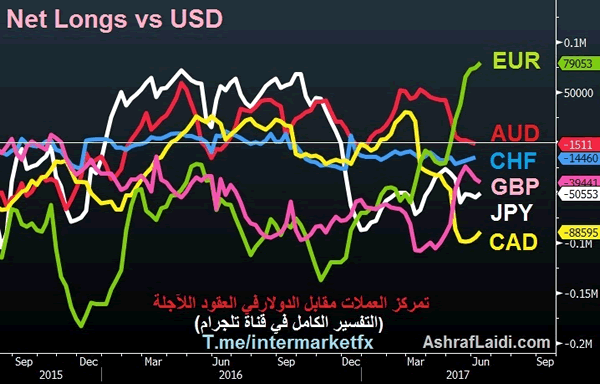
CFTC Positioning Data:
- EUR long 79K vs 74K long last week. Longs increased 5K
- GBP short 39K vs 37K short last week. Shorts increased by 2K
- JPY short 51K vs 55K short last week. Shorts trimmed by 4K.
- CHF short 14K vs 17K short last week. Shorts trimmed by 3K
- CAD short 88K vs 94K short. Shorts trimmed by 6K
- AUD short 1 vs square. Shorts increased by 1K
- NZD long 1K vs 2K short last week
Markets Update:
The US Dollar came again under pressure in Asia, following more disappointing US economic data on Friday. The New Zealand Dollar was the best performing currency overnight, with NZD/USD rallying to 0.73. Should it break above that level, next resistance is noted at 0.7380. The Australian Dollar followed the NZD higher, but lacked the momentum. AUD/USD reached a high of only 0.7630. AUD/NZD selling weighed a bit on the currency.
USD/JPY recovered along with stocks. The pair rose from 110.70 to 111.15. The outlook is still positive and another test of 111.50 resistance likely. Meanwhile, the Euro consolidated in a 1.1190-1.1205 range, while GBP/USD traded 1.2755-80.
There will likely be a positive reaction to the French parliamentary election outcome once Europe opens. EU stock markets are likely to open higher as well.
There are no notable data releases scheduled for today. The only event is a speech by FOMC member Dudley at 1300 BST.
Upcoming Events:
- 13:00 BST – FOMC Member Dudley speaks
The Week Ahead:
Tuesday, June 20th
- 02:30 BST – Australia House Price Index
- 02:30 BST – RBA Meeting Minutes
- 07:30 BST – SNB Chairman Jordan speaks
- 09:00 BST – Euro Zone Current Account
- 13:00 BST – FOMC Member Fischer speaks
- 13:30 BST – US Current Account
- 20:00 BST – FOMC Member Kaplan speaks
Wednesday, June 21st
- 00:50 BST – Bank of Japan Meeting Minutes
- 15:00 BST – US Existing Home Sales
- 15:30 BST – US Crude Oil Inventories
- 22:00 BST – RBNZ Rate Decision
Thursday, June 22nd
- 13:30 BST – US Initial Jobless Claims
- 13:30 BST – Canadian Retail Sales
- 14:00 BST – US House Price Index
- 15:00 BST – Euro Zone Consumer Confidence
Friday, June 23rd
- 08:00 BST – French Manufacturing PMI
- 08:00 BST – French Services PMI
- 08:30 BST – German Manufacturing PMI
- 08:30 BST – German Services PMI
- 09:00 BST – Euro Zone Manufacturing PMI
- 09:00 BST – Euro Zone Services PMI
- 13:30 BST – Canadian CPI
- 13:30 BST – Canadian Core CPI
- 14:45 BST – US Services PMI
- 14:45 BST – US Manufacturing PMI
- 15:00 BST – US New Home Sales
Market Morning Briefing: The Persistent Decline In US Housing Data Taking It To A 8-Month Low
STOCKS
Almost all major stock indices look bullish for the coming sessions.
Dow (21384.28, +0.11%) has been moving slow but looks bullish for the coming sessions. We could see a rise towards 21600 soon.
Dax (12752.73, +0.48%) has been fluctuating within the broad 12900-12600 region for the past few sessions and will have to break on either side to give us more clarity on further direction. For now while 12690 holds, we could see a rise to 12900 in the next 2-3 sessions.
Shanghai (3135.79, +0.40%) has risen and could have tested a decent support near 3120 which if holds, could take it higher towards 3160-3175 over the coming sessions.
Nikkei (20062.19, +0.60%) is trading higher and looks potentially bullish towards 20200-20240 levels in the near term.
Nifty (9588.05, +0.10%) has high chances of bouncing back to levels above 9600 within the next 2-3 sessions. Support near 9550-9570 may not break on the downside just now. We could possibly see another leg of a sharp rally in the near to medium term.
COMMODITIES
Gold (1266) remains in a slow corrective move which may take it to the support of 1242 but if the support holds, a quick bounce towards 1307can’t be ruled out. Silver (17.14) also continues to weaken and may decline to 16.90 in the coming days. We might see less volatility in the market ahead of FOMC meeting (on 14th June 2017), which may add some directional clarity.
Copper (2.63) is trading within the narrow range of 2.56-2.67. Only above 2.67, higher resistances of 2.84 can come into consideration. We will remain bullish on copper while it is trading above 2.55 regions.
Brent (48.40) and WTI (46.09) had tested their respective supports of 47.40 and 44.20, and bounced a little, keeping the upside possibility of 50.22 (Brent) and 47.50 (WTI) open. If Brent and WTI manage to close above 50.30 and 47.50 in the next couple of sessions, another attempt for 52 and 49.55 can be seen. Bearish possibilities will come in consideration in case 47.40 for Brent and 44.20 for WTI break down.
FOREX
The persistent decline in US Housing data taking it to a 8-month low and the much worse than expected reading in the US Consumer Sentiment gauge weakened the Dollar again.
The failure to rise above our resistance of 97.80 keeps Dollar Index (97.17) in a range of 96.30-97.80 for the third consecutive week. If the interim support band of 97.10-96.80 holds, then it may rise above 97.80 by the end of the week.
Euro (1.1195) found short covering from our support of 1.1120 but the selling pressure may be back near the resistance of 1.1215-35 and the lower end of the 3-week range of 1.1100-1.1300 may be retested.
Dollar-Yen (111.00) is taking a pause after the sharp rally from 108.80 to 111.42 in just 3 sessions, in line with our expectations. After this pause, the rally may resume for 112.00 and then 113.00.
Pound (1.2771) remains in a grinding corrective bounce which may end and the larger downtrend may resume by the end of the week. Immediate upside may be limited to 1.2850 but the downside is open to 1.2600 and lower.
Aussie (0.7622) may test the long term resistance of 0.7700-50 in the next few days and the price action there may determine the near to medium term path. Immediate support comes at 0.7570.
Dollar-Rupee (64.43) rallied to test 64.7350 before coming off sharply to close at the day’s low. The momentum with which it has fallen from 64.7350 is indicative of further bearishness in the early sessions this week. While 64.70/60 holds, we could possibly be headed towards 64.30-10 in the coming sessions.
INTEREST RATES
The German yields are mixed. The 30YR (1.11%) is trying to move down slowly while the shorter term yields ranging from 2Yr to 10Yr have been eventually rising and could test resistance in the coming sessions from where a fall could be expected in the medium term.
The German 10-2Yr (0.9360%) has been moving to lower levels and could test 0.80% in the coming sessions.
The Japan 10Yr (0.06%) could test decent resistance at 0.07% from where a fall could be expected in the near term. The Japanese yield differentials are headed to lower levels and look bearish for medium term.
USDX Daily Consolidation
We spoke about the aggressive sell off that saw USDX back below Trump's election win level on the blog, exactly a month ago today.
With both our long USD short term day trades failing to bounce off intraday support/resistance last week, all eyes turn back to the USDX chart for clues. Let's take another look at the Buck:
USDX Daily:
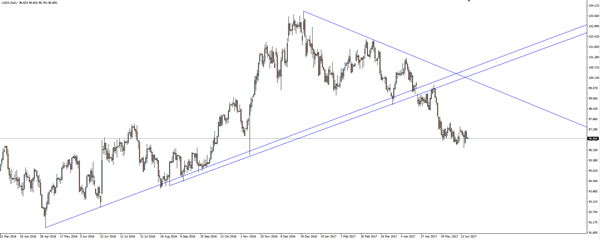
The major trend line break has followed through, but this last month of daily candles has see price consolidate. I'll leave it to you to draw some horizontal levels and make your own decisions on the significance of where this consolidation has decided to happen.
Do you see it as significant enough to look for a USDX turn? Will this then inspire you to be taking shorts on the major forex pairs?
Searching For A Spark
The market has been searching for a spark this morning. No doubt dealers are suffering a mild case of Central Bank fatigue as the market remains in flux digesting last week’s “hawkish Fed hike “ amongst other central bank hawkish surprises. I suspect the dollar will be susceptible in both directions given that the impact of soft US economic data persists while clashing with an overly hawkish Janet Yellen
The greenback is mirroring US rates indicating room for risk to evolve as weak US economic data will raise a red flag about Fed policy normalisation running ahead of the curve. However given the light US economic calendar this week, Fedspeak will be far more entertaining with Dudley on Monday and Fischer on Tuesday likely to attract the most attention. The risk for the dollar would be for the Fed members to reign in some of the hawkishness from Dr Yellen.
But I suspect the European political narrative will remain in focus as Brexit negotiations will commence later today, mind you with much difficulty for UK negotiators given the weaker hand the Tories have been dealt post-election. How these negotiations evolve will likely hold the near term fate for the Pound
Local market awaits the MSCI decision on the China A Index.
EURUSD – Risk Remains To The Downside On Pullback
EURUSD - With the pair continuing to hold on to its downside pressure, further bearishness is likely. Resistance comes in at 1.1150 level with a cut through here opening the door for more upside towards the 1.1200 level. Further up, resistance lies at the 1.1250 level where a break will expose the 1.1300 level. Conversely, support lies at the 1.1150 level where a violation will aim at the 1.1100 level. A break of here will aim at the 1.1050 level. All in all, EURUSD faces further downside threats.
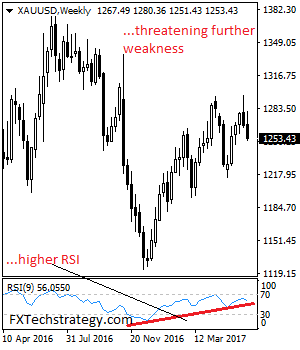
GOLD – Targets Further Weakness On Bearishness
GOLD - The commodity continues to face its pullback threats. On the downside, support comes in at the 1,250.00 level where a break will turn attention to the 1,240.00 level. Further down, a cut through here will open the door for a move lower towards the 1,230.00 level. Below here if seen could trigger further downside pressure targeting the 1,220.00 level. Conversely, resistance resides at the 1,260.00 level where a break will aim at the 1,270.00 level. A turn above there will expose the 1,280.00 level. Further out, resistance stands at the 1,290.00 level. All in all, GOLD looks to strengthen further.
Fed Refocus, Euro Infatuation Grows
Macron put a final stamp on his electoral victory on Sunday by claiming a combined majority with his coalition partner. The US dollar will be in focus in the week ahead as nine Fed speakers are set to take the podium. CFTC positioning showed euro net longs at the most extreme since 2007. 3 new charts backing our existing EURUSD Premium trade +a detailed note on the OIS-Fed divergence are have been posted.
Macron with ally Mouvement Democrate are projected to win 355 to 356 out of 577 seats in French parliament with most of the votes counted. Alone, it also looks like his La Republique party will win a bare majority with 291 seats. In the past week Macron has made increasingly sweeping promises to reform France and unleash innovation. He certainly has the mandate to do it and any early successes are likely to underpin the euro.
The US dollar faces a volatile week ahead (and summer) as markets attempt to gauge exactly where the Fed stands. Dudley kicks off a week of 9 speakers with an appearance at 1200 GMT.
What makes it especially intriguing were late-Friday comments from Kashkari and Kaplan. Kashkari was the lone dissenter told a newswire other members shared his views but weren't quite ready to take a stand. Kaplan is seen as more of a hawk but said he will be “very cautious” about supporting a hike.
The comments from the pair of policymakers are more in line with the market's stance than what Yellen offered in her presser. The dollar could be heavily swayed if others highlight the same kind of aversion towards hiking before inflation and growth data accelerate.
CFTC Commitments of Traders
Speculative net futures trader positions as of the close on Tuesday. Net short denoted by - long by +.
EUR +79K vs +74K prior GBP -39K vs -37K prior JPY -51K vs -55K prior CHF -14K vs -17K prior CAD -88K vs -94K prior AUD 11K vs 0K prior NZD +1K vs -2K prior
Euro net longs hit the most since 2007 as enthusiasm shaping buy-the-dips approach. EUR/USD was sold on Wed/Thurs after the FOMC decision but it's already recovered half the decline.
GBP traders await Monday's press conference from the first day of UK-EU talks at 17:230, followed by BoE's Carney Mansion House speech on Tuesday for his view on the biggest dissent in 6 years.
We also emphasize how vulnerable that CAD position suddenly looks. Few of those specs were anticipating a hawkish turn from the BOC last week and a big rethink may have only just begun.