Sample Category Title
The Weekly Bottom Line
HIGHLIGHTS OF THE WEEK
United States
- Markets were mixed on the week, seemingly undecided on how to score continued headlines from Washington, disappointing U.S. economic data, and the Fed's confident tone accompanying its rate hike.
- The Fed anticipates that the recent softness in inflation to prove temporary. Its outlook for future rate hikes remained unchanged. We expect the process of reducing its balance sheet will begin in the fall, with a modest pace of rate hikes continuing thereafter.
- Other economic data this week was a tad on the soft side. But our outlook for the U.S. economy to post solid growth of 2.2% this year, and 2.1% next year has not changed, as a fundamentally strong consumer and better global growth help support the U.S. economy.
Canada
- Despite falling oil prices and soft equity markets, the loonie saw robust gains this week as investors digested a marked change in tone from the Bank of Canada.
- Bank of Canada communications this week suggested that the era of emergency level interest rates may end earlier than expected. It now appears likely that the first policy interest rate increase in more than six years will take place in October.
- Robust growth in recent quarters and a constructive outlook suggest that inflation is at or near a bottom, justifying the removal of some monetary accommodation. Only a gradual pace of policy rate increases is expected thereafter, reflecting the challenges still facing the Canadian economy.
UNITED STATES - FED CASTS VOTE OF CONFIDENCE ON US ECONOMY
Markets weakened on the week, focusing on some disappointing U.S. economic data instead of the Fed's confident tone accompanying its rate hike. The 25 basis-point increase in the fed funds rate was widely expected. More important was the vote of confidence cast by the Fed in its economic and inflation outlook. It left the number of rate hikes penciled in unchanged despite the loss of inflation momentum in recent months. The Fed also revealed more detailed plans for scaling back its holdings of Treasuries and MBS securities, describing the process for paring back the monthly amount of principal repayments it reinvests. We expect an announcement this September signaling this process to start in October. After that, the Fed is likely to next raise rates in December, and continue its gradual pace through 2018, provided the economy progresses as outlined in our latest forecast.
This was not a unanimous decision. President of the Minneapolis Fed, Neel Kashkari, dissented. He has written in the past that he is concerned about the Fed consistently missing on its inflation mandate, and would prefer to see more evidence that inflation pressures are building before hiking rates. He is not alone in this view. Many analysts suggest the Fed should wait to see greater evidence of inflation before acting to slow the economy. Financial markets aren't totally convinced either (Chart 1). Given that inflation has fallen short of the Fed's 2% target for the past five years, the skepticism is understandable.
Like many things in the post-financial crisis recovery, inflation pressures are proving slow to materialize. This phenomenon is not confined to the United States either. As discussed in our new Quarterly Economic Forecast, inflation readings across the G7 and key emerging markets have come in below expectations. Some of this reflects a pull-back in oil prices, but underlying core inflation measures have also undershot forecasts.
May's CPI report provided further sustenance for the doves. Core inflation posted its lowest reading in two years, at 1.7% y/y. There was an encouraging firming in core services price pressures, ending the cooling in the prior two month but core goods prices remained in deflationary territory.
There is evidence that goods price pressures are building further up the supply chain. Producer and import prices are both pointing to higher prices for consumer goods in the coming months, as the effect of past U.S. dollar appreciation starts to wane. Moreover, domestic wage pressures have picked up over the past two years as the labor market has tightened (Chart 2). With job growth continuing to put downward pressure on unemployment, this is likely to continue. Eventually rising wages will squeeze profit margins and put upward pressure on inflation.
At this stage in the cycle we expect consumer spending growth to be increasingly driven by income gains. As such, real consumer spending growth should run at a solid 2-2.5% pace over the next two years. Although the May retail data was a bit soft, this was in part due to weak inflation. It does not derail the Q2 real consumer spending rebound. Nor does it change our expectation that, barring an unforeseen shock, the U.S. expansion is set to continue.
CANADA - BRIGHTER OUTLOOKS SETS STAGE FOR MONETARY TIGHTENING
It was a somewhat volatile week for Canadian markets, with declining oil prices helping lead the S&P/TSX index lower. Still, the loonie shook off the oil softness, and stood out as the star of the show. It climbed nearly half a cent vs the greenback Monday afternoon, and strengthened as the week went on, up nearly one cent by mid-morning Friday.
The key driver for the loonie's strength was a marked shift in the tone of the Bank of Canada communications that served to bring forward market expectations of a policy rate increase, pushing longer-term interest rates modestly higher. The key trigger was a speech by Senior Deputy Governor Carolyn Wilkins (See our commentary). She suggested that the adjustment of the Canadian economy to lower oil prices was in the rear-view, and that despite persisting uncertainty "decisions must be taken" - marking a change in thinking.
Wilkins' speech nevertheless appeared to leave a bit of ambiguity around just how quickly the Bank of Canada may begin to remove stimulus. This was quickly erased the next day when Governor Stephen Poloz appeared on CBC Radio, stating that "...people need to be thinking about what their finances would look like were interest rates to be a little higher when they renew their mortgage." The rapid change in communication tone, coupled with the unusual clarity in Poloz's comments, points to a Bank that is getting ready to increase interest rates in the near future.
Is an increase in borrowing costs warranted? And if so, when and how quickly? The answer to the first question is a qualified "yes". The Canadian economy has been on a tear recently, posting 3.5% growth on average over the last three quarters. As outlined in the June edition of our Quarterly Economic Forecast, we expect growth to moderate slightly, but remain well above-trend through the remainder of this year. Clearly this is no longer an economy that requires emergency-level interest rates.
The qualification to the "yes" is related to inflation - not an unimportant detail given it is the sole monetary policy objective of the Bank. Despite robust growth, inflation remains stubbornly low, with the Bank of Canada's measures of core or "underlying" inflation ticking lower recently. Still, this is likely to be more of a backward-looking measure as history suggests that these tend to lag output (Chart 1). From this standpoint, inflation appears close to turning the corner. Given that monetary policy is set not for the economy of 'today', but rather that of 'tomorrow', it is only logical the Bank of Canada will want to get ahead of any inflationary pressures to ensure that inflation remains as near the 2% target as possible. The first step towards this goal will be to bring their policy interest rate off its recent lows, likely at the October monetary policy announcement.
Even if Poloz and company are taking a more aggressive near-term approach, it remains likely that caution will rule the day for subsequent policy increases. Business investment has only begun to come back in any meaningful sense, while the adjustment process in the key Ontario/Toronto housing markets has only just begun. As a result, we expect any future hikes to be only gradual, with the policy rate reaching just 1.25% by the end of next year (Chart 2).
Week Ahead Dollar Struggles Despite Fed Rate Hike Boost
Political risk to drag US dollar lower
The US dollar will end the week down against most major pairs even after the U.S. Federal Reserve hiked rates by 25 basis points and the plan to keep tightening via more rate hikes and a reduction of the central bank's balance sheet was part of the communication on Wednesday. Economic data released this week has the market questioning how serious the Fed is about its economic forecasts as inflation, retail sales and building permits all came in lower than expected this week. The Trump administration continues to be caught in the turmoil of the Russian connection investigation and it now appears the President will be under investigation doing the dollar no favors.
Central banks dominated headlines this week even if they did not feature a policy statement. The Bank of Canada (BoC) surprised markets when during a routing speech the Deputy Governor Carolyn Wilkins said that the central bank would be assessing its monetary policy if the current pace of growth continues. A second endorsement for reducing stimulus came a day later from Governor Stephen Poloz when he said the rate cuts from two years ago had done their job. The Fed was the only central bank to modify its monetary policy but the Bank of England (BoE) delivered a hawkish vote count in their 5–3 decision to keep rates unchanged. The three votes for a rate hike came despite the uncertain waters the economy must transverse during the upcoming Brexit negotiations.
The Bank of Japan (BOJ) kept interest rates no hold and after the European Central Bank (ECB) and BoE have changed their tune about ultra easing monetary policy Japan could be the last major economy without a tighter monetary policy. The week will bring few scheduled economic events, the highlight being the Reserve Bank of New Zealand (RBNZ) rate statement on Wednesday, June 21 at 4:00 pm EDT. The optimism resulting form the BoC comments will be put to the test on Thursday, June 22 with the release of Canadian retail sales and again on Friday, June 23 at 8:30 am EDT when Canadian inflation data is published.
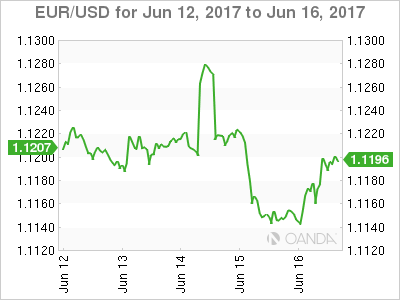
The EUR/USD gained 0.047 percent this week. The single pair is trading at 1.1188 after softer economic data out of the US offset the actions of the Fed. The monetary policy divergence that had the USD on the path to appreciate further has been hindered by political drama despite the Fed sticking to the script by hiking two times this year with the possibility of another rate raise before the end of the year and outlining their plans to reduce their massive balance sheet.
The EUR/USD will end nearly flat and all the Fed could do was bring the pair to just below the 1.12 price level. The high of the week was 1.1296 just before the Fed release its June statement.
The economic calendar for the week of June 19 to 23 will provide little guidance for investors with news of US President Donald Trump under possible investigation for obstruction of justice to provide further volatility. The probability of impeachment is low and if anything all investigations could drag on for years. The market is now starting to price in the reality of the end of the Trump trade with no solid timelines on what kickstarted the strength of the dollar after the US presidential elections. Infrastructure spending and tax reform are now tougher sells as the President does not have the full support of his party, even if they hold the majority.
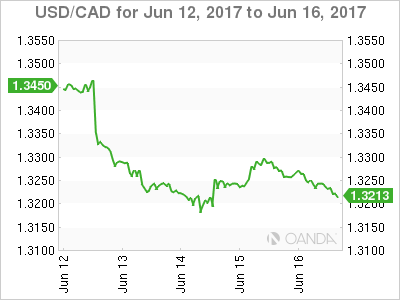
The USD/CAD lost 1.411 percent in the last five days. The currency pair is trading at 1.3241 after comments from the Bank of Canada (BoC) Deputy governor put a rate hike firmly on the table. Governor Stephen Poloz followed up on the comments the next day and confirmed the optimism on the growth of the economy and the possible reduction of stimulus going forward. The loonie rallied until the U.S. Federal Reserve delivered its own optimistic view on the American economy while hiking rates for the second time this year. The hike was not enough to offset the negative indicators delivered this week that contradict the picture painted by the Fed's forecasts.
The CAD advanced despite little support from oil prices who suffered from another surprise buildup, this time in gasoline stocks. The battle to stabilize crude prices between the Organization of the Petroleum Exporting Countries (OPEC) and US producers continues to show the glut of energy products remain.
The biggest risk for the Canadian dollar remains a political one. The renegotiation of the NAFTA is scheduled for late August and a negative outcome could reshape the Canadian economy for the worse. The turmoil in the Trump Administration has taken some of the pressure off, but the consultation process needed before renegotiation was initiated as anticipated and the soft lumber tariffs to Canadian producers sent a strong message ahead of sitting down at the negotiation table.
Market events to watch this week:
Monday, June 19
- 9:30pm AUD Monetary Policy Meeting Minutes
Tuesday, June 20
- 2:30 am CHF SNB Chairman Jordan Speaks
- 4:45 am CHF SNB Chairman Jordan Speaks
Wednesday, June 21
- 10:30 am USD Crude Oil Inventories
- 4:00 pm NZD RBNZ Rate Statement
- 5:00 pm NZD Official Cash Rate
Thursday, June 22
- 8:30 am CAD Core Retail Sales m/m
- 8:30 am USD Unemployment Claims
Friday, June 23
- 8:30 am CAD CPI m/m
*All times EDT
As Other Banks Take Punchbowl, BoJ Says: The Night Is Young
In recent weeks, the message from the major central banks has been - get ready for a return to more normal policy. The Bank of Japan is prioritizing its inflation target even at the risk of being too accommodative.
Bucking the Trend
This week has been broadly consequential in terms of major central bank meetings. The Fed raised rates for the second time this year and offered some specifics on how it would begin winding down its balance sheet. The Bank of England (BoE) held rates steady but only by a 5-3 vote. The fastest pace of inflation since 2013 in the United Kingdom has some policymakers thinking the time is right for the BoE to join the Fed in raising rates. Finally, the European Central Bank (ECB) in its meeting last week dropped a reference to a future rate cut, and markets are expecting a communication later this year about a tapering of the ECB's asset purchase program.
That was the backdrop leading into this week's meeting of the Bank of Japan (BoJ). While other major central banks are moving to normalize policy, the BoJ is steadfast in its commitment to achieving what has been a fleeting objective for a generation: sustained CPI inflation of 2.0 percent.
For the sixth consecutive meeting, policymakers in Tokyo made no change to the broad set of stimulative monetary policies that it has labeled "Quantitative and Qualitative Monetary Easing (QQE) with Yield Curve Control."
In specific terms that means it will maintain: (1) a negative policy rate of -0.10 percent, (2) a pace of Japanese Government Bond (JGB) purchases sufficient to keep the yield on the 10-year JGB "around zero percent" at an annual pace of roughly ¥80 trillion yen, (3) purchases of exchange-traded mutual funds at an annual pace of ¥6 trillion, (4) purchases of real estate investment trusts at an annual pace of ¥90 billion and (5) commercial paper and corporate bond holdings at their present values of ¥2.2 trillion and ¥3.2 trillion, respectively.
In a press conference following the meeting, Governor Kuroda articulated the Bank's position on the growing pressure to join in the normalization trend among other central banks. "Achieving and maintaining stable prices and avoiding a return to deflation are far more important than the problems of the prolonged period of easing."
Effectiveness and Growth Outlook
Kuroda is now in the last year of his five-year term. The avant-garde approach to monetary policy during his governorship has had mixed results. The BoJ has been successful in arresting what had been a four-year pattern of deflation when he took over. However, achieving the price stability target of 2.0 percent has been an elusive goal.
Arguably, the accommodative policy is helping with growth. If Japanese GDP growth is positive in the current quarter, as we expect it will be, it will extend the streak of consecutive quarters of GDP growth to five - a feat not matched at any point in the current expansion.
Trade Idea : USD/CHF – Buy at 0.9705
USD/CHF - 0.9743
Most recent candlesticks pattern : N/A
Trend : Near term up
Tenkan-Sen level : 0.9741
Kijun-Sen level : 0.9749
Ichimoku cloud top : 0.9717
Ichimoku cloud bottom : 0.9701
Original strategy :
Buy at 0.9705, Target: 0.9805, Stop: 0.9670
Position : -
Target : -
Stop : -
New strategy :
Buy at 0.9705, Target: 0.9805, Stop: 0.9670
Position : -
Target : -
Stop : -
As the greenback has eased after surging to 0.9771 yesterday, suggesting minor consolidation below this level would be seen and pullback to 0.9720 cannot be ruled out, however, reckon support at 0.9703 would limit downside and bring another rise later, above said resistance at 0.9771 would extend recent rise from 0.9613 low to resistance at 0.9808, however, reckon previous resistance at 0.9825 would hold from here due to near term overbought condition, bring retreat later.
In view of this, we re looking to buy dollar on pullback as 0.9700-05 should limit downside. Below 0.9680 would defer and risk weakness towards said support at 0.9641 but only break there would abort and revive bearishness, this would also suggest the rebound from 0.9613 has ended instead, bring retest of this level later.

Trade Idea Wrap-up: GBP/USD – Stand aside
GBP/USD - 1.2782
Most recent candlesticks pattern : N/A
Trend : Near term down
Tenkan-Sen level : 1.2783
Kijun-Sen level : 1.2772
Ichimoku cloud top : 1.2754
Ichimoku cloud bottom : 1.2749
Original strategy :
Sold at 1.2790, stopped at 1.2800
Position : - Short at 1.2790
Target : -
Stop : - 1.2800
New strategy :
Stand aside
Position : -
Target : -
Stop : -
Although the British pound edged higher in NY morning and gain towards indicated resistance at 1.2818 cannot be ruled out, break there is needed to signal the erratic rise from 1.2635 low is still in progress and may extend gain to 1.2845-50 (61.8% Fibonacci retracement of 1.2978-1.2635) but upside should be limited to 1.2870-80 and price should falter below 1.2900, bring another decline later.
In view of this, would not chase this rise here and would be prudent to sell cable on further subsequent recovery, Below 1.2720-25 would suggest an intra-day top is formed, bring test of indicated support at 1.2690 but break there is needed to revive bearishness and signal the rebound from 1.2635 has ended, bring further fall to 1.2650, then towards said support at 1.2635.

Trade Idea Wrap-up: EUR/USD – Sell at 1.1220
EUR/USD - 1.1191
Most recent candlesticks pattern : N/A
Trend : Near term down
Tenkan-Sen level : 1.1176
Kijun-Sen level : 1.1166
Ichimoku cloud top : 1.1220
Ichimoku cloud bottom : 1.1201
Original strategy :
Sell at 1.1210, Target: 1.1110, Stop: 1.1245
Position : -
Target : -
Stop : -
New strategy :
Sell at 1.1220, Target: 1.1120, Stop: 1.1255
Position : -
Target : -
Stop : -
As the single currency has rebounded after holding above yesterday’s low at 1.1132, suggesting consolidation above this level would be seen and corrective bounce to 1.1210-15 (50% Fibonacci retracement of 1.1296-1.1132) cannot be ruled out, however, reckon 1.1230-35 (61.8% Fibonacci retracement) would limit upside and bring another decline later. Below 1.1155-60 would bring retest of 1.1132, break there would extend recent decline from 1.1296 top to previous support at 1.1109.
In view of this, we are looking to sell euro on recovery as 1.1210-15 (50% Fibonacci retracement of 1.1296-1.1132) should limit upside and bring another decline. Above 1.1230-35 (61.8% Fibonacci retracement) would defer and risk a stronger rebound to 1.1250 but price should falter well below said resistance at 1.1296, bring another decline later.

Week Ahead – Brexit Talks Begin; RBNZ in Focus; PMI Data on Tap; Fed Speakers to be Closely Scrutinized
Brexit negotiations finally begin in Brussels on Monday. New Zealand's central bank will be in focus next week while flash June PMI surveys out of the Japan, the Eurozone and the United States will also be on investor's watch list. Various FOMC members are due to give speeches. French President Emmanuel Macron's Republic on the Move (REM) party is set to win Sunday's legislative elections.
Brexit Negotiations
Brexit negotiations are due to start on Monday June 19 with Brexit Secretary David Davis meeting the EU's negotiator Michel Barnier in Brussels on Monday. In the aftermath of the UK elections which resulted in Prime Minister Theresa May losing her majority government, it would be interesting to see if her hard Brexit stance will prevail or will the UK aim for a soft Brexit.
French legislative elections
The final round of the legislative elections in France are being held this Sunday. The latest polls indicate the President Emmanuel Macron's Republic on the Move (REM) party is heading for a landslide victory.
Reserve Bank of New Zealand
The Reserve Bank of New Zealand (RBNZ) is due to announce its monetary policy decision on June 22. The central bank is expected to keep its benchmark rate at a record low and to stick to its neutral stance. The latest softer-than-expected first quarter economic growth would likely push the RBNZ to remain accommodative for longer. The GDP report showed the economy growing at the slowest pace since 2015 at 0.5% on the quarter. In May, the RBNZ kept the official cash rate at 1.75% and hinted it would remain on hold until at least the end of 2018. A shift in the bank's neutral stance next week to a more positive outlook could help the kiwi bounce back after the post-GDP dip.
Japan PMI and BOJ minutes
On Wednesday, the Bank of Japan will release the minutes of its April policy meeting. The central bank kept all its policy settings unchanged at the meeting, as was widely expected. Next week's minutes could offer some more insight. Economic data releases from Japan next week include May trade data on Monday and June manufacturing PMI on Friday.
RBA minutes and Governor Lowe speech
On Tuesday, the minutes of the Reserve Bank of Australia's latest policy meeting will be published. At its meeting, the RBA held the main cash rate at 1.50% as was widely predicted, despite expectations of weaker growth in the Australian economy. Meanwhile, a speech by RBA Governor Phillip Lowe will be scrutinized on Monday for any clues regarding future monetary policy.
United States - Home sales and PMI
Various data on the housing sector for the month of May are due for release next week. Existing home sales are due on Wednesday while new home sales are expected on Friday. The flash Markit manufacturing and services PMI surveys for June are also scheduled for release on Friday.
A number of Fed speakers will attract attention next week for insight into the US central bank's policy path. The FOMC meeting this week resulted in a much-expected date hike of 25 basis points bringing the fed funds rate to between 1.00 and 1.25%. The Fed was more hawkish than expected and appears on track to raise rates one more time this year. New York Fed President William Dudley will kick off a busy week of Fed speeches followed by Chicago Fed President Charles Evans. On Tuesday, Vice Chair Stanley Fischer, Boston Fed President Eric Rosengren, and Dallas Fed President Robert Kaplan are all set to speak. Finally, to end the week, St. Louis Fed President James Bullard and Cleveland Fed President Loretta Mester will gives speeches.
Canada - retail sales and inflation
Canada will release April retail sales numbers on Thursday while CPI data for May are due next Friday. Inflation data are particularly closely watched by the Bank of Canada when making decisions on monetary policy. BoC Governor Stephen Poloz and Senior Deputy Governor Carolyn Wilkins speaking earlier this week, suggested the central bank was starting to make the case for a modest tightening in monetary policy later this year, much sooner than many people had thought.
Eurozone PMI
June PMI data for the Eurozone next week could provide supporting evidence of a stronger economic recovery in the region. The composite PMI from IHS Markit, which comprises the services and manufacturing components, is forecast to ease slightly from May's 56.8 to 56.7 in June. This will be a preliminary reading, so it would be important to watch.
RBNZ & Norges Bank Policy Meetings, UK Queen’s Speech, Key Data in Focus
Next week's market movers
- In New Zealand, the RBNZ is expected to take no action. We think that the tone of the meeting statement may be slightly more cautious than previously.
- The Norges Bank is also forecast to stand pat. We see the case for policymakers to communicate a somewhat more upbeat message.
- In the UK, the beginning of the Brexit negotiations and the Queen's Speech are likely to attract market attention.
- We also get key economic releases from Australia, the Eurozone and Canada.
On Monday, we have a relatively quiet day, with no major indicators due to be released. Given the absence of economic events, traders may turn their attention to political developments and specifically to the EU-UK divorce. The first round of Brexit negotiations is expected to start on this day, according to statements by both sides. Having said that, we think that until the UK sorts out its new government, these talks could attract less attention than one would expect, as it is not certain yet which UK officials will be attending these talks in a few weeks, and most importantly, with what mandate. The situation is likely to clear up once Parliament votes on the Queen's Speech (see below).
On Tuesday, the RBA will release the minutes of its June policy gathering, where the Bank kept its policy unchanged, and maintained a balanced tone overall. Even though policymakers offered very little new information regarding the next move in interest rates, they did appear slightly more upbeat on the labor market, a sector of the economy they had previously expressed concerns about. We think that market focus will revolve mainly around their views on this topic again, considering that the last two employment reports from Australia have been stellar. Even though this may not be reflected in these minutes, as the latest jobs report was released after the RBA meeting, we think that the Bank is likely to sound more upbeat with regards to the labor market when it meets again, on the 4th of July.
On Wednesday, market focus will probably turn back to the UK, where the Queen's Speech takes place. The Queen will outline a list of laws that the government wants to get approved over the coming year. Parliament will spend the following six days debating these plans, before holding a vote. Thus, we will probably know the outcome the week after. It will be particularly interesting to see whether lawmakers approve it or not. If Theresa May secures the support of the DUP lawmakers, or if other parties support her policies, she keeps her place as Prime Minister and she is the one to carry out the Brexit negotiations. However, if May is unable to establish a majority that votes for the Speech, then Labour leader Jeremy Corbyn would be invited to attempt to form a government.
On Thursday, during the Asian morning, the RBNZ rate decision will be in the spotlight and the forecast is for the Bank to keep its policy steady. At its latest policy meeting, the Bank kept the door for further easing open, indicating that much of the recent progress in inflation was transitory. Meanwhile, policymakers noted that growth was soft in H2 2016, but the growth outlook remained positive. With regards to the Kiwi, they indicated that its 5% decline since February was encouraging, and if sustained, this would help to rebalance the growth outlook. However, ever since, developments on the latter two fronts have been quite discouraging. GDP data for Q1 showed that growth was only +0.5% qoq, far below the RBNZ's forecast of +0.9% qoq. Meanwhile, the NZD recovered notably, and is now trading at levels similar to those in February, when officials had noted that "a decline in the exchange rate is needed". Bearing all these in mind, we think that the Bank is likely leave the prospect for further easing on the table, and may also reintroduce its prior concerns regarding the exchange rate.
During the European day, the Norges Bank will announce its rate decision too. At its latest gathering, the Bank was quite cryptic, offering almost no new information on policy. It basically noted that the outlook for the economy had not changed much since its March assessment. Back in March, the Bank indicated there is a slightly higher probability of a rate cut rather than a rate hike in the coming period. Recent developments have been mixed, on balance. On the bright side, GDP growth for mainland Norway came +0.6% qoq in Q1, above the NB's March forecast of +0.4% qoq, and the unemployment rate declined to 2.6% in May, better than the Bank's expectations of 2.9%. On the downside, the core CPI rate declined to +1.6% yoy in May, notably below policymakers' forecast of +1.9% yoy. However, having said that, the recent decline in NOK argues in favor of a higher inflation rate in coming months, so the NB could incorporate into its forecasts a higher inflation path moving forward. In this case, we would not exclude the scenario of a more optimistic tone by policymakers, considering that the slowdown in inflation is the only dark spot in Norway's economic picture at the moment.
On Friday, we get preliminary manufacturing and services PMIs for June from several European nations and the Eurozone as a whole. The manufacturing indices are expected to have declined slightly, while the services figures are forecast to have ticked up. In any case, all of these indices are anticipated to remain at elevated levels, consistent with solid economic growth in the Eurozone. Such prints would also be in line with the ECB's assessment that the risks to Euro area's growth outlook are now "broadly balanced", and could enhance our own view that the Bank will probably continue to shift towards a more sanguine tone at its upcoming meetings.
In Canada, CPI data for May will be in focus, though no forecast is available yet. Given that the yearly change in oil prices has turned negative, we believe that the headline rate is likely to slide, even if the core print stays unchanged. In order to see the headline rate turning up, we need a strong rebound in the core rate, which appears unlikely in our view. On Monday, BoC Deputy Governor Carolyn Wilkins indicated that the Bank will assess whether all the monetary stimulus currently in place is still needed, which raised speculation that the Bank may start considering raising interest rates in the not-too-distant future. Therefore, further slowdown in inflation may pour cold water on expectations with regards to a more hawkish BoC at the upcoming meetings.
Trade Idea Wrap-up: USD/JPY – Buy at 110.35
USD/JPY - 111.05
Most recent candlesticks pattern : N/A
Trend : Near term up
Tenkan-Sen level : 111.04
Kijun-Sen level : 110.92
Ichimoku cloud top : 109.81
Ichimoku cloud bottom : 109.65
Original strategy :
Buy at 110.40, Target: 111.40, Stop: 110.05
Position : -
Target : -
Stop : -
New strategy :
Buy at 110.35, Target: 111.35, Stop: 110.00
Position : -
Target : -
Stop : -
As the greenback has retreated after meeting resistance at 111.42, suggesting consolidation below this level would be seen and pullback to 110.30-35 (50% Fibonacci retracement of 109.27-111.42) cannot be ruled out, however, renewed buying interest should emerge there and bring rebound later, above 111.05-10 would bring retest of 111.42 but break there is needed to confirm the rise from 108.82 low has resumed for retracement of recent decline from 114.37 to 111.60 (50% Fibonacci retracement of 114.37-108.82) and then test of previous resistance at 111.71 but price should falter well below another resistance at 112.13.
In view of this, we are looking to buy dollar on pullback but one should exit on next rise. Below 110.05-10 (61.8% Fibonacci retracement of 109.27-111.42) would abort and signal top has been formed, bring further fall to 109.85-90 and possibly towards 109.50 but support at 109.27 should remain intact.

Fed Remains On Track Despite Faltering Inflationary Pressures
- Markets Return To A Focus On Central Banks - Peter Rosenstreich
- Fed Remains On Track Despite Faltering Inflationary Pressures - Arnaud Masset
- Economic Uncertainties Still Prevail In Japan - Yann Quelenn
- Global Electric
- RBNZ Could Surprise - Peter Rosenstreich
Economics - Markets Return To A Focus On Central Banks
Trading President Trump or European political uncertainty has done our heads in. Yet these rogue events have been the only true drivers of volatility while it has become difficult to say the least to provide plenty of price action directional and forecastable predictions. Last week the focus returned to Central Banks and monetary policy and we breathed a sigh of relief. We can handle these fundamentals more than random 3am tweets from Trump. For traders, monitoring Central Bank policy strategy will once again become profitable. On the whole, slightly more hawkish decisions by the Central Banks sent bond yields higher.
Setting the pace last week was the FOMC, which clearly indicated to investors to ignore short-term noise. The Fed delivered a 25bp hike to 1.0-1.25% and held the DOTS basically unchanged. Fed members discounted the recent inflation weakness (punctuated by a soft CPI read only hours prior), highlighting transitory effects and placing significantly more emphasis on the strong labour markets.
The failure to acknowledge soft inflation forced the markets to meaningfully price-in a December hike. But potentially more influential on rate and USD were the additional details on balance sheet reduction, which had the markets pulling forward the announcing to September (already our prediction). Moving forward, we expect the Fed will drive USD against low yielding G10 currency but remain weak against EM currencies.
The Bank of Canada surprised the markets with a hawkish shift due to positive economic momentum. The absorption of lower oil prices has already occurred and bubble-like behaviour in real-estate markets has increased the probability of the BoC starting its tightening cycle sooner than anticipated. We have a hike penciled in for early 2018, which combined with overly bearish CAD position and fading protectionist threat will give CAD further bullish momentum. The Bank of England looked above the political fray and Brexit chatter to strike a hawkish tone. Unexpectedly, three members on the MPC voted for a rate hike. Dissenters focused on strong labour market conditions and the threat of an inflation overreach.
We suspect despite mixed signals, this hawkish tone is correct given the BoE's long-standing challenge with battling inflation and our view of a "soft" Brexit. We still don't see a Brexit-induced correction in the UK consumer, although very weak retail sales has us vigilant, dragging down growth at this point.
With a rate hike on the table and political developments (on both sides of the channel) indicating a less punishing agreement and expectations for a stronger GBP, one of our strongest conviction ideas is long GBPCHF based on monetary policy deviations.
Economics - Fed Remains On Track Despite Inflationary Pressures
As broadly expected, the Federal Reserve lifted borrowing costs by 25bps following a two-day meeting. The decision was already priced-in by market participants. However, the Committee created a stir with a surprisingly hawkish statement and press conference from Janet Yellen despite the recent publication of lacklustre economic data. Indeed, the last CPI and retail sales reports came on the soft side and triggered a USD sell-off, just a couple of hours before the announcement of FOMC's decision. The consumer price index extended only 1.9% y/y in May versus 2.0% expected and down from 2.2% in the previous month amid sustainable downside pressure on crude oil prices. In addition, the core measure, which excludes the most volatile components such as food and energy prices, slid to 1.7% y/y, down from a previous reading and median forecast of 1.9%. Finally, retail sales printed in negative territory and contracted 0.3% m/m in May, well below market expectations of a flat reading, signalling that US consumers preferred to remain cautious against the backdrop of political jitters in the US and an uncertain economic outlook.
Committee members seemed committed to hold the line and keep steady the tightening pace as announced at the preceding meetings. Moreover, the Fed remains highly confident the recent set-back in inflation developments is only temporary and expects to increase by another notch the federal funds target before the end of the year. In our opinion, the fact that the Fed is not really concerned about the disappointing inflation readings suggests that the institution may have started to reconsider the ground for reaching at all cost the 2% inflation target. Indeed, overall the US economy is not in such a bad state as it is not in recession anymore and the economic growth is the envy of many countries. Finally, the Committee discussed further about balance sheet unwinding as it drafted carefully a plan for policy normalisation; and it is expected to be implemented before the end of the year.
However, the Fed remained extremely cautious by stating that "the Committee would be prepared to resume reinvestment of principal payments received on securities held by the Federal Reserve if a material deterioration in the economic outlook were to warrant a sizable reduction in the Committee's target for the federal funds rate".
The USD was broadly higher this morning and erased partially the losses triggered by the release of the CPI and retail sales report. Housing starts and building permits also came in largely below expectations. EUR/USD is back below 1.12 and currently into a positive short-term momentum.
Economics - Economic Uncertainties Still Prevail In Japan
A set of data has been released earlier last week and it seems it is a neverending story for Japan.
April machine orders just collapsed at -.31% m/m while markets had estimated an increase of 0.5. This data is often used as a proxy for the capital expenditure.
Other recent fundamental data showed improvement in Japan's economy. Japan's demand has accelerated according to a report released last Wednesday and central bankers, once more, expect this demand to keep growing, in particular the foreign demand. Nonetheless the inflation is standing well below the target, and this has not changed for the past decade. CPI is currently standing at an annualised data of -0.4%.
Investors seem to be reluctant to invest domestically, due to several possible reasons including uncertainties about President Trump's trade policy and about Japan's economic future.
Later last week, the Japan producer price index came in flat at 0% and it represents the weakest PPI result in nine months. Already last week, the growth rate had been revised down to 0.3% from 0.5%.
The yen has slightly strengthened against the US dollar because of a riskoff sentiment in the market over the past few weeks.
Upside pressures on the currency remain but the BoJ cannot tighten its monetary policy or it would largely hurt its economy. The safe haven status is also one key issue, as whatever the state of Japan's economy, investors would drive their money as soon as a risk-off sentiment arises.
But we consider the economy in Japan is still struggling to recover. The sad reality is Japan has not succeeded in boosting private consumption, which accounts for 60% of the GDP.
This is why BoJ had no choice than to hold its monetary policy unchanged for now. The base rate has been kept on hold at -0.1% last Thursday and the central bank will continue to focus on maintaining the 10-year yield to 0 by purchasing massive amounts of Government bonds (80 trillion yen annually).
The BoJ seems definitely stuck in its very loose monetary policy as deflationary pressures are still important.
We believe that Japan, in the medium-term, will try to expand the monetary policy divergence with the US in order to help reduce pressures on its currency. Yet, we consider that the US economy is overestimated and may trigger again inflow towards the Japanese yen. We reload bullish yen positions around 112 against the greenback.
Themes Trading - Global Electric
The growth in electric energy consumption continues to be a reliable investment theme. According to the IEA 2014 report total final world consumption from 2000 to 2014, increased by 60% and is forecast to grow at an equally fast pace. While the sources of energy have become diverse and abundant, the electricity sector remains a stable revenue generator. The explosion of electrical devices growing alongside the expansion of the global middle class has demand for electricity and utility services are driving the sectors returns.
Utilities generally sell electricity through regulated markets by operating generation, conduction and distribution services. These legal monopolies are good for income seekers as they produce dividend yield, which are stable and higher-than-average. This theme sources the global top 15 corporations according to market capitalization as the massive barriers to entry will discourage new entrants and reward large players.
FX - RBNZ Could Surprise
The RBNZ's 22nd June rate decisions might be more interesting than generally expected. Markets suspect that the bank will be concerned over the slowing growth due to disappointing 1Q GDP. However, there is scope for a slightly more hawkish communication. Last week's data flow sent Antipodean traders into a spin with good Australia and weak New Zealand data. However, we suspect temporary dislocation will normalise with New Zealand economic momentum picking up.
New Zealand's 2.5% from 2.7% annual GDP growth read might have been slower than expected, however growth pace remains solid within the G10 ranking. The underlying GDP private spending components indicate strong trend, supported by surveys outlook (PMI manufacturing rose to 58.5). On the inflation side, the forecast puts the read on the higher side as 2Q CPI stands at 2.2%. Commodity prices will clearly drag across the board, yet dairy prices remain buoyant.
Overall, we should not overlook that New Zealand economic data has generally surpassed market expectations. The RBNZ sees interest rates on hold until H2 2019, but markets are pricing-in 13bp of rate hikes by May 2018. This monetary policy decision is not a forecasting meeting with only an accompanying statement. The primary message will remain unchanged that monetary policy will continue "accommodative for a considerable period," indicating that NZD depreciation will support rebalancing and inflation pressure is likely to increase slowly.
While traders are now focused on AUDNZD reversal based on stretched growth differentials, forecasts would watch NZDJPY. Last week the BoJ held its assessment on inflation and the economy providing only the slightest optimist tone on household consumption. But for those traders who were expecting that political pressure and marginally positive economic data would force the BoJ to discuss exit strategies, they were mistaken.
At the accompanying press conference Governor Kuroda clearly stated that communicating exit strategy was not appropriate since the bank's targets were not reached. In addition, he indicated that talk of US and EU exit strategies were not suitable for Japan's economic condition. Should we get even a most minor of RBNZ tone shift (a BoC type of redirection) monetary policy divergence will continue to benefit long NZDJPY trades.