Sample Category Title
Fed Remains On Track Despite Faltering Inflationary Pressures
- Markets Return To A Focus On Central Banks - Peter Rosenstreich
- Fed Remains On Track Despite Faltering Inflationary Pressures - Arnaud Masset
- Economic Uncertainties Still Prevail In Japan - Yann Quelenn
- Global Electric
- RBNZ Could Surprise - Peter Rosenstreich
Economics - Markets Return To A Focus On Central Banks
Trading President Trump or European political uncertainty has done our heads in. Yet these rogue events have been the only true drivers of volatility while it has become difficult to say the least to provide plenty of price action directional and forecastable predictions. Last week the focus returned to Central Banks and monetary policy and we breathed a sigh of relief. We can handle these fundamentals more than random 3am tweets from Trump. For traders, monitoring Central Bank policy strategy will once again become profitable. On the whole, slightly more hawkish decisions by the Central Banks sent bond yields higher.
Setting the pace last week was the FOMC, which clearly indicated to investors to ignore short-term noise. The Fed delivered a 25bp hike to 1.0-1.25% and held the DOTS basically unchanged. Fed members discounted the recent inflation weakness (punctuated by a soft CPI read only hours prior), highlighting transitory effects and placing significantly more emphasis on the strong labour markets.
The failure to acknowledge soft inflation forced the markets to meaningfully price-in a December hike. But potentially more influential on rate and USD were the additional details on balance sheet reduction, which had the markets pulling forward the announcing to September (already our prediction). Moving forward, we expect the Fed will drive USD against low yielding G10 currency but remain weak against EM currencies.
The Bank of Canada surprised the markets with a hawkish shift due to positive economic momentum. The absorption of lower oil prices has already occurred and bubble-like behaviour in real-estate markets has increased the probability of the BoC starting its tightening cycle sooner than anticipated. We have a hike penciled in for early 2018, which combined with overly bearish CAD position and fading protectionist threat will give CAD further bullish momentum. The Bank of England looked above the political fray and Brexit chatter to strike a hawkish tone. Unexpectedly, three members on the MPC voted for a rate hike. Dissenters focused on strong labour market conditions and the threat of an inflation overreach.
We suspect despite mixed signals, this hawkish tone is correct given the BoE's long-standing challenge with battling inflation and our view of a "soft" Brexit. We still don't see a Brexit-induced correction in the UK consumer, although very weak retail sales has us vigilant, dragging down growth at this point.
With a rate hike on the table and political developments (on both sides of the channel) indicating a less punishing agreement and expectations for a stronger GBP, one of our strongest conviction ideas is long GBPCHF based on monetary policy deviations.
Economics - Fed Remains On Track Despite Inflationary Pressures
As broadly expected, the Federal Reserve lifted borrowing costs by 25bps following a two-day meeting. The decision was already priced-in by market participants. However, the Committee created a stir with a surprisingly hawkish statement and press conference from Janet Yellen despite the recent publication of lacklustre economic data. Indeed, the last CPI and retail sales reports came on the soft side and triggered a USD sell-off, just a couple of hours before the announcement of FOMC's decision. The consumer price index extended only 1.9% y/y in May versus 2.0% expected and down from 2.2% in the previous month amid sustainable downside pressure on crude oil prices. In addition, the core measure, which excludes the most volatile components such as food and energy prices, slid to 1.7% y/y, down from a previous reading and median forecast of 1.9%. Finally, retail sales printed in negative territory and contracted 0.3% m/m in May, well below market expectations of a flat reading, signalling that US consumers preferred to remain cautious against the backdrop of political jitters in the US and an uncertain economic outlook.
Committee members seemed committed to hold the line and keep steady the tightening pace as announced at the preceding meetings. Moreover, the Fed remains highly confident the recent set-back in inflation developments is only temporary and expects to increase by another notch the federal funds target before the end of the year. In our opinion, the fact that the Fed is not really concerned about the disappointing inflation readings suggests that the institution may have started to reconsider the ground for reaching at all cost the 2% inflation target. Indeed, overall the US economy is not in such a bad state as it is not in recession anymore and the economic growth is the envy of many countries. Finally, the Committee discussed further about balance sheet unwinding as it drafted carefully a plan for policy normalisation; and it is expected to be implemented before the end of the year.
However, the Fed remained extremely cautious by stating that "the Committee would be prepared to resume reinvestment of principal payments received on securities held by the Federal Reserve if a material deterioration in the economic outlook were to warrant a sizable reduction in the Committee's target for the federal funds rate".
The USD was broadly higher this morning and erased partially the losses triggered by the release of the CPI and retail sales report. Housing starts and building permits also came in largely below expectations. EUR/USD is back below 1.12 and currently into a positive short-term momentum.
Economics - Economic Uncertainties Still Prevail In Japan
A set of data has been released earlier last week and it seems it is a neverending story for Japan.
April machine orders just collapsed at -.31% m/m while markets had estimated an increase of 0.5. This data is often used as a proxy for the capital expenditure.
Other recent fundamental data showed improvement in Japan's economy. Japan's demand has accelerated according to a report released last Wednesday and central bankers, once more, expect this demand to keep growing, in particular the foreign demand. Nonetheless the inflation is standing well below the target, and this has not changed for the past decade. CPI is currently standing at an annualised data of -0.4%.
Investors seem to be reluctant to invest domestically, due to several possible reasons including uncertainties about President Trump's trade policy and about Japan's economic future.
Later last week, the Japan producer price index came in flat at 0% and it represents the weakest PPI result in nine months. Already last week, the growth rate had been revised down to 0.3% from 0.5%.
The yen has slightly strengthened against the US dollar because of a riskoff sentiment in the market over the past few weeks.
Upside pressures on the currency remain but the BoJ cannot tighten its monetary policy or it would largely hurt its economy. The safe haven status is also one key issue, as whatever the state of Japan's economy, investors would drive their money as soon as a risk-off sentiment arises.
But we consider the economy in Japan is still struggling to recover. The sad reality is Japan has not succeeded in boosting private consumption, which accounts for 60% of the GDP.
This is why BoJ had no choice than to hold its monetary policy unchanged for now. The base rate has been kept on hold at -0.1% last Thursday and the central bank will continue to focus on maintaining the 10-year yield to 0 by purchasing massive amounts of Government bonds (80 trillion yen annually).
The BoJ seems definitely stuck in its very loose monetary policy as deflationary pressures are still important.
We believe that Japan, in the medium-term, will try to expand the monetary policy divergence with the US in order to help reduce pressures on its currency. Yet, we consider that the US economy is overestimated and may trigger again inflow towards the Japanese yen. We reload bullish yen positions around 112 against the greenback.
Themes Trading - Global Electric
The growth in electric energy consumption continues to be a reliable investment theme. According to the IEA 2014 report total final world consumption from 2000 to 2014, increased by 60% and is forecast to grow at an equally fast pace. While the sources of energy have become diverse and abundant, the electricity sector remains a stable revenue generator. The explosion of electrical devices growing alongside the expansion of the global middle class has demand for electricity and utility services are driving the sectors returns.
Utilities generally sell electricity through regulated markets by operating generation, conduction and distribution services. These legal monopolies are good for income seekers as they produce dividend yield, which are stable and higher-than-average. This theme sources the global top 15 corporations according to market capitalization as the massive barriers to entry will discourage new entrants and reward large players.
FX - RBNZ Could Surprise
The RBNZ's 22nd June rate decisions might be more interesting than generally expected. Markets suspect that the bank will be concerned over the slowing growth due to disappointing 1Q GDP. However, there is scope for a slightly more hawkish communication. Last week's data flow sent Antipodean traders into a spin with good Australia and weak New Zealand data. However, we suspect temporary dislocation will normalise with New Zealand economic momentum picking up.
New Zealand's 2.5% from 2.7% annual GDP growth read might have been slower than expected, however growth pace remains solid within the G10 ranking. The underlying GDP private spending components indicate strong trend, supported by surveys outlook (PMI manufacturing rose to 58.5). On the inflation side, the forecast puts the read on the higher side as 2Q CPI stands at 2.2%. Commodity prices will clearly drag across the board, yet dairy prices remain buoyant.
Overall, we should not overlook that New Zealand economic data has generally surpassed market expectations. The RBNZ sees interest rates on hold until H2 2019, but markets are pricing-in 13bp of rate hikes by May 2018. This monetary policy decision is not a forecasting meeting with only an accompanying statement. The primary message will remain unchanged that monetary policy will continue "accommodative for a considerable period," indicating that NZD depreciation will support rebalancing and inflation pressure is likely to increase slowly.
While traders are now focused on AUDNZD reversal based on stretched growth differentials, forecasts would watch NZDJPY. Last week the BoJ held its assessment on inflation and the economy providing only the slightest optimist tone on household consumption. But for those traders who were expecting that political pressure and marginally positive economic data would force the BoJ to discuss exit strategies, they were mistaken.
At the accompanying press conference Governor Kuroda clearly stated that communicating exit strategy was not appropriate since the bank's targets were not reached. In addition, he indicated that talk of US and EU exit strategies were not suitable for Japan's economic condition. Should we get even a most minor of RBNZ tone shift (a BoC type of redirection) monetary policy divergence will continue to benefit long NZDJPY trades.
NZDUSD Undergoing A Temporary Three Wave Recovery
NZDUSD is making an intra-day rally from the lows, where previous five wave movement has ended. That said, current rally can now be part of a three wave contra-trend reaction that can in sessions ahead find some resistance around the Fibonacci ratio of 50.0/61.8 and near the previous swing high of wave four at 0.7269. Around the mentioned area a new reversal lower can begin.
NZDUSD,1H

Post-USD Rebound Already Running into Resistance?
- EMU equities went moderate higher( 0.4% EuroStoxx) led by utilities and IT. US equity indices start with minor (S&P/Dow) to moderate losses (Nasdaq).
- The pace of US new-home construction unexpectedly cooled in May, the latest piece of data to offer a mixed reading on the economy's QE performance. Housing starts tumbled 5.5% M/M to an annualised pace of 1.09m units, widely missing expectations of a 4.1%. Permits were down 4.9% to an annual pace of 1.2m units, also missing forecasts.
- Prime Minister Theresa May's government has bowed to European Union demands to focus the initial stage of Brexit talks on the terms of the U.K.'s departure rather than trying to arrange a future trade relationship at the same time, according to two EU officials with knowledge of the preparations.
- The Russian rouble outperformed its emerging-market peers on Friday after oil prices picked up and the country's central bank cut interest rates to 9% from 9.25%, less than some analysts had expected, as investors remain relatively sanguine about the currency's prospects despite weaker oil prices and new sanctions from the US.
- Nine months after schedule, Greece finally has some more creditor cash. The country's stock index been driven to a two-year high and bonds are rallying after eurozone and International Monetary Fund officials agreed to unlock a $8.5B bailout tranche to help Greece avoid default and pay off some of its arrears.
- Labour costs in Spain remained steady in the first quarter of 2017 after falling throughout last year, reflecting the growing strength of the country's labour market, but highlighting the fact that there is still a long way to go before the ECB sees its goal of higher wage growth across the eurozone.
- Wages for French workers grew at their fastest pace in three years at the start of 2017 - showing welcome signs of acceleration as the country prepared for its major presidential election. Quarterly wage growth picked up to 0.6% in Q1 from 0.1% in Q4 of 2016.
Rates
Core bonds end the week uneventful
Following wild swings in the past two sessions, core bonds are little changed today in a low volume session devoid of key data releases or events. The Bund started the session on a weak footing and lost more ground in follow through selling, but the tide turned at mid-morning and losses were erased during the remainder of a lethargic session. US Treasuries moved sideways in a tight range, but weak housing data brought a bid in the market, pushing US Treasuries to minor daily gains. It helped the Bund travel to unchanged levels.
The German yield curve shifted marginally higher with yields changes varying between -0.5 bp (5-yr) and +2 bp (30-yr). The US curve bull steepened with yields down by 2.2 bps (2-yr) to 0.2 bp. Intra-EMU spreads versus Germany (10-yr) were nearly unchanged with exception of the Greek spread which narrowed about 20 bps on an agreement to pay out the second tranche of the bailout package, allowing Greece to redeem maturing bonds in July.
Currencies
Post-USD rebound already running into resistance?
In technical trading, EUR/USD reversed part of yesterday's post-Fed decline. The move was supported by poor US housing data. USD/JPY initially profited from a constructive equity sentiment, but the momentum also eased during the US session. EUR/USD trades in the 1.1175 area. USD/JPY tries to stay north of 111. So, the dollar trades off the recent lows, but it's too early to call a sustained USD comeback.
Asian stock markets traded mixed. Japan outperformed, profiting from the post-Fed USD/JPY rebound. This rebound continued this morning. The BOJ left its policy unchanged as expected. The BOJ slightly raised its assessment on the Japanese economy, but BOJ governor Kuroda indicated that it is too early to discuss any concrete steps on the exit policy as this exit is still far away. The dollar also maintained gains against the euro. EUR/USD hovered near 1.1150.
There was little news to guide EUR/USD trading during the European morning session. Yield changes were modest. If anything, spreads between the US and Germany narrowed marginally. Yesterday's post-Fed USD rebound slowed and EUR/USD reversed part of yesterday's decline in technical trading. USD/JPY remained better bid. The BOJ policy decision being out of the way maybe gave some comfort to JPY bears. The pair was also supported by a constructive equity sentiment. The pair filled offers in the 111.40 area.
The US housing data disappointed again in May (see headlines) Housing data are usually no market mover, but time US yields, the dollar and even US equity futures declined a bit. Markets still feel unease with disappointing US data. USD/JPY drifted back to the low 111 area. EUR/USD returned close to the intraday highs, currently trading in the 1.1175 area. The Michigan consumer confidence release might still amend the end of week FX positioning.
No follow-through gains on the BOE sterling rally
Sterling entered calmer waters. Yesterday, the UK currency received BOE support. However, there were no follow-through sterling gains. The eco calendar was empty and there was also no high profile news from the political scene. Cable was locked in a tight sideways range in the upper half of the 1.27 big figure. EUR/GBP rebounded slightly off the overnight correction low (0.8720 area), but this move mostly mirrored a modest rebound of the euro after yesterday's EUR/USD decline. EUR/GBP hovers in the 0.8750 area. Sterling maintains most of yesterday's gains but political uncertainty remains high as UK PM May is still trying to strike a deal with the DUP to support her minority government. At the same time, the Brexit negotiations are scheduled to start next week. Press headlines suggest that the UK would be prepared to discuss the terms of the divorce first, which would be a concession to the EU at the start of the negotiations. Is this a precursor for a less hard Brexit?
Weekly Focus: Signals of Weaker Growth
Market movers ahead
- In the US, we will look out for any comments in speeches by FOMC members about what drove the decision on the June rate hike, which in our view was not justified by the data. On the data front, we get PMI figures and we continue to believe that the moderate growth will primarily be driven by the service sector.
- Consumer confidence stood at the highest level since 2007 in May. We expect it to keep increasing in June on the back of rising employment and fading political uncertainty.
- In China, we expect the recent increases in rates and yields are likely to feed into a slowdown in housing for the rest of the year and a moderation in house-price inflation.
- On Thursday, we expect Norges Bank to keep rates unchanged and remove its 'easing bias' from the interest rate path.
Global macro and market themes
- The Fed strikes a hawkish tone, hiking rates and setting out its balance sheet reduction...
- ..rating the tightening labour markets as more important than recent weak inflation prints.
- Further flattening of the US yield curve likely.
- We maintain our equity call of 'sell-on-rallies' near-term...
- ..as well as our tactical bearish EUR/USD trade recommendation.
- We see rising risk from China to the global outlook.
Trade Idea: EUR/GBP – Buy at 0.8660
EUR/GBP - 0.8751
Recent wave: Major double three (A)-(B)-(C)-(X)-(A)-(B)-(C) is unfolding and 2nd (A) has possibly ended at 0.6936.
Trend: Near term up
Original strategy :
Buy at 0.8660, Target: 0.8860, Stop: 0.8620
Position : -
Target : -
Stop : -
New strategy :
Buy at 0.8660, Target: 0.8860, Stop: 0.8620
Position : -
Target : -
Stop : -
Euro’s retreat after meeting resistance at 0.8836 has retained our view that further consolidation below this week’s high at 0.8866 would be seen and initial downside risk remains for correction to 0.8700, however, reckon support at 0.8652 would limit downside and bring another rise later, above 0.8836 would signal the pullback from 0.8866 has ended, bring retest of this level first. A break above this resistance would extend recent erratic upmove from 0.8304 low to 0.8880, then 0.8900, having said that, as broad outlook remains consolidative, reckon current c leg of larger degree wave b should be limited to 0.8950 and price should falter well below 0.9000, bring retreat later.
In view of this, we are looking to buy euro on further subsequent pullback but one should exit on such rise. Below 0.8680 would defer and risk test of 0.8650-55 support but break there is needed to signal top is formed instead, bring further fall to 0.8620, then 0.8600 which is likely to hold from here.
Our preferred count is that, after forming a major top at 0.9805 (wave V), (A)-(B)-(C) correction is unfolding with (A) leg ended at 0.8400 (A: 0.8637, B: 0.9491 and 5-waver C ended at 0.8400. Wave (B) has ended at 0.9413 and impulsive wave (C) has either ended at 0.8067 or may extend one more fall to 0.8000 before prospect of another rally. Current breach of indicated resistance at 0.9043 confirms our view that the (C) leg has ended and bring stronger rebound towards 0.9150/54, then towards 0.9240/50.

Housing Starts Continue Their Descent in May
Homebuilding took a nosedive in May, marking a third consecutive monthly decline and erasing the gains made at the start of the year. Starts fell 64k to 1092k in May from a downwardly revised 1156k print for April. The number was below market expectations that anticipated a 1220k pace of starts.
Single-family homebuilding posted a 32k decline on the month, with the multi-family segment down by the same amount. This performance will be detrimental to growth in Q2 with residential investment expected to be a modest drag on activity during the quarter.
Building permits also came in well below expectations, falling to 1168k in May, while markets had anticipated a 1249k print. This month, the volatile multi-family segment accounted for the majority of the decline, while the single-family segment subtracted a more modest 15k from building intentions relative to April.
Activity in the South has been consistently weak, and this region accounted for the majority of the decline, falling by 51k in May. The Midwest weighed (-17k) but declined from a stellar reading last month. The Northeast maintained its pace of building from April at 87k, while the West posted a meagre 4k increase in builds.
Key Implications
Housing has been a key contributor to growth during the recovery, but after a strong start to the year the robust performance will not be repeated this quarter. Rising mortgage rates and new home prices have weighed on affordability even as the labor market gains traction. Moreover, the weakness in permit activity offers no consolation, suggesting that a quick bounceback is not in the cards.
Builders have faced challenging conditions related to a shrinking pool of labor, land availability, and rising material prices - including wood - which have resulted in rising new home prices. Many of these will continue to weigh on the sector, but some rebound later this year should materialize as demand for homes rises. In particular, we expect the building of single-family homes to pick up in the coming months, allowing housing to contribute to growth later this year. Overall, builders remain optimistic, with the June NAHB survey reporting a healthy level of confidence.
This report adds to the string of disappointing releases in recent weeks. Still, despite the modest drag from residential investment this quarter, we expect economic growth to clock in at just over 3%.
Oil Bounced from $44.22 Low
US oil bounced on Friday from $44.22 low where the price found temporary footstep. Recovery was signaled by reversal of daily RSI from oversold territory and is seen as consolidation ahead of final push towards key support at $43.74 (05 May low). Strong bearish sentiment on concerns over global oversupply and another disappointing crude stocks release keep oil price under increased pressure. Bearish technical studies support negative scenario which requires weekly close below $45.32 (Fibo 61.8% of $39.20/$55.22) for confirmation. Meantime, bears could be interrupted by corrective action on oversold studies. Limited correction is seen ahead of fresh push lower, with strong barriers at $45.08/60 ( Fibo 38.2% / 61.8% of $46.46/$44.22) and $45.82 (falling 10SMA) expected to ideally cap.
Res: 45.08; 45.34; 45.60; 45.82
Sup: 44.22; 44.00; 43.74; 43.06
Trade Idea: USD/CAD – Sell at 1.3350
USD/CAD - 1.3241
Recent wave: Only wave v of c has ended at 0.9407 and wave C of major A-B-C correction is underway for headway to 1.4700
Trend: Near term down
Original strategy :
Sell at 1.3350, Target: 1.3130, Stop: 1.3410
Position: -
Target: -
Stop: -
New strategy :
Sell at 1.3350, Target: 1.3130, Stop: 1.3410
Position: -
Target: -
Stop:-
The greenback found support at 1.3165 earlier this week and rebounded, retaining our view that consolidation above this level would be seen and recovery to 1.3330 cannot be ruled out, however, reckon 1.3360-65 would limit upside and bring another decline later, below 1.3220 would suggest the rebound from 1.3165 has ended, bring retest of this level but break there is needed to signal recent decline from 1.3794 has resumed for weakness towards 1.3100 and possibly towards previous support at 1.3078.
In view of this, would be prudent to sell again on subsequent recovery as 1.3350-60 should limit upside. Above previous support at 1.3387 (now resistance) would defer and suggest low is possibly formed, bring a stronger rebound to 1.3420-25 but break there is needed to provide confirmation.
To recap, wave B from 1.3066 is unfolding as an a-b-c and is sub-divided as a: 1.2192, b: 1.2716 and wave c is a 5-waver with i: 1.1983, ii: 1.2506, extended wave iii with minor iii at 1.0206, wave iv ended at 1.0781 and wave v as well as wave iii has ended at 0.9931, hence the subsequent choppy trading is the wave iv which is unfolding as (a)-(b)-(c) with (a) leg of iv ended at 1.0854, followed by (b) leg at 1.0108 and (c) leg as well as the wave iv ended at 1.0674. The wave v is sub-divided by minor wave (i): 0.9980, (ii): 1.0374, (iii): 0.9446, (iv): 0.9913 and (v) as well as v has possibly ended at 0.9407, therefore, consolidation with upside bias is seen for major correction, indicated target at 1.3700 and 1.4000 had been met and further gain to 1.4700 would be seen later.

EUR/USD Mid-Day Outlook
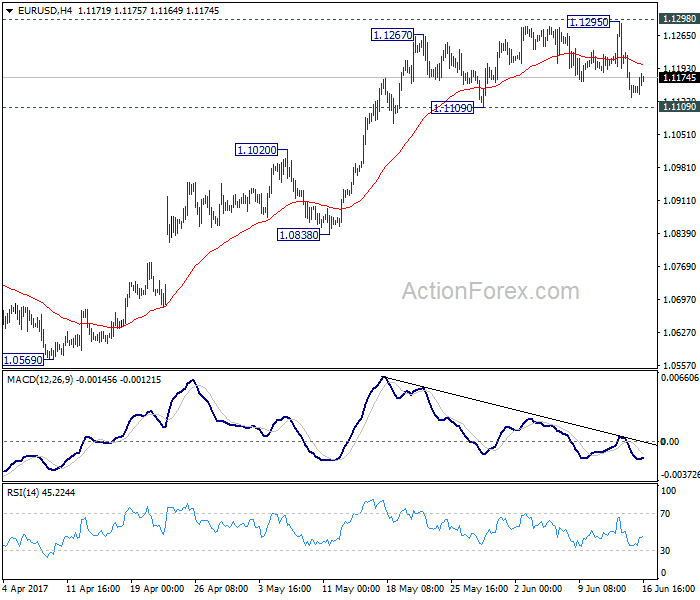
Daily Pivots: (S1) 1.1109; (P) 1.1168 (R1) 1.1205; More....
At this point, EUR/USD is still holding above 1.1109 support and outlook is unchanged. Intraday bias remains neutral with focus on 1.1298 key resistance. Decisive break there will carry larger bullish implication and target 1.1615 resistance next. On the downside, break of 1.1109 support will indicate short term topping and rejection from 1.1298. In such case, intraday bias will be turned to the downside for 1.0838 support.
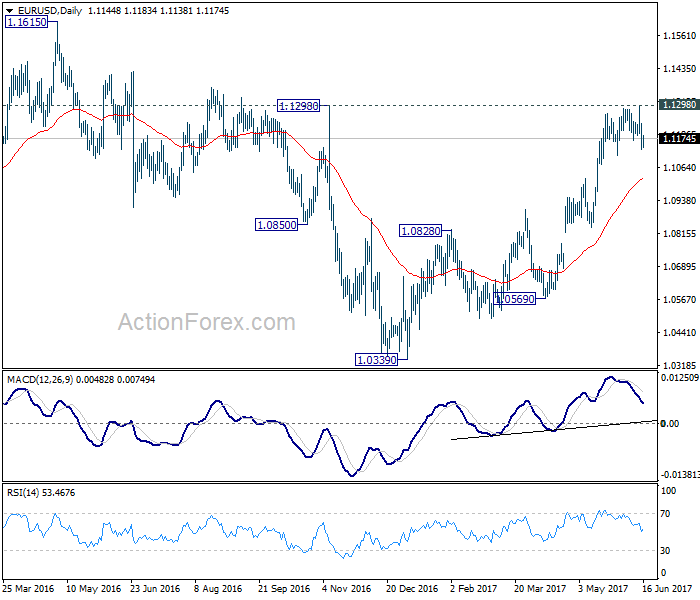
In the bigger picture, the case for medium term reversal continues to build up with EUR/USD staying far above 55 week EMA (now at 1.0922). Also, bullish convergence condition is seen in weekly MACD. Focus will now be on 1.1298 key resistance. Rejection from there will maintain medium term bearishness and would extend the whole down trend from 1.6039 (2008 high). However, firm break of 1.1298 will indicate reversal. In such case, further rally would be seen back to 1.2042 support turned resistance next.
GBP/USD Mid-Day Outlook
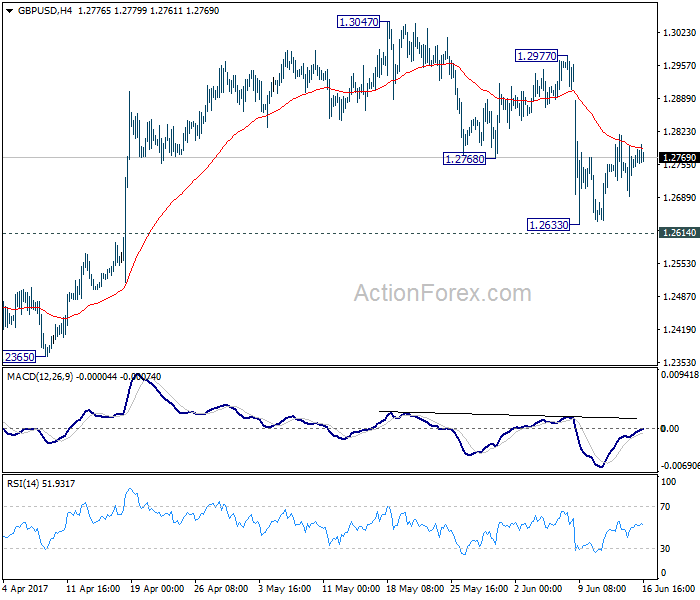
Daily Pivots: (S1) 1.2697; (P) 1.2746; (R1) 1.2803; More...
Intraday bias in GBP/USD remains neutral for the moment. Also, near term outlook stays bearish with 1.2977 resistance intact. We continue to favor the case that consolidation pattern from 1.1946 has completed at 1.3047 already. Decisive break of 1.2614 resistance turned support would confirm our bearish view and target a test on 1.1946 low next. However, break of 1.2977 will dampen our view and turn bias back to the upside for 1.3047 and above.
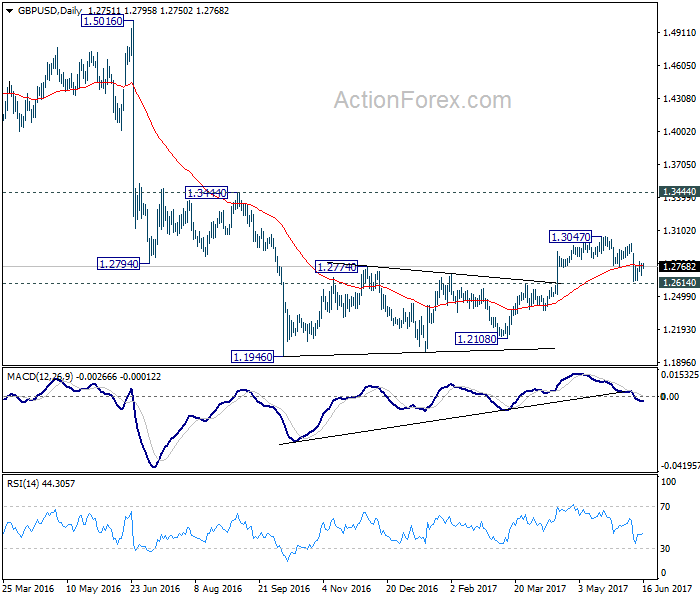
In the bigger picture, fall from 1.7190 is seen as part of the down trend from 2.1161. Price actions from 1.1946 medium term low are seen as a consolidation pattern, which could have completed after hitting 55 week EMA. Break of 1.1946 low will target 61.8% projection of 1.5016 to 1.1946 from 1.3047 at 1.1150 next. In case the consolidation from 1.1946 extends, outlook will stay remain bearish as long as 1.3444 resistance holds.