

Sample Category Title
EURJPY Elliott Wave View: Correction In Progress
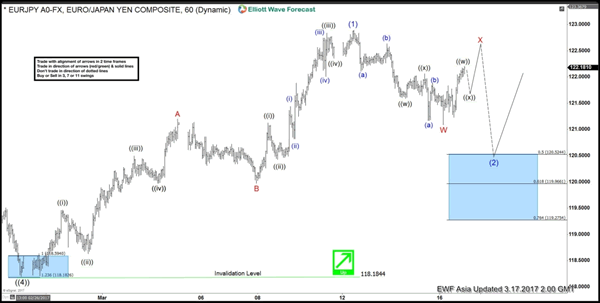
Short term Elliott Wave view in EURJPY suggests that the decline to 118.18 on 2/24 ended Primary wave ((4)). Primary wave ((5)) is currently in progress higher and the rally from Primary wave ((4)) low at 118.18 is unfolding as an ending diagonal Elliott wave structure where Intermediate wave (1) ended at 122.88. The subwaves of Intermediate wave (1) takes the form of a zigzag Elliott wave structure where Minor wave A ended at 121.19, Minor wave B ended at 119.97, and Minor wave C of (1) ended at 122.88.
Revised view suggests that Intermediate wave (2) pullback is still in progress in 7 swing or a double three structure where Minor wave W ended at 121.087. While Minor wave X bounce fails below 122.88, pair has scope to turn lower one more leg in Minor wave Y of (2) towards 119.27 – 120.52 area before the rally resumes. We don’t like selling the proposed pullback and expect buyers appear at 119.27 – 120.52 area for an extension higher or at least 3 waves bounce as far as pivot at 118.18 low stays intact. If pair breaks above 122.88 from here, that will suggest that Intermediate wave (2) has ended at 121.087 and pair has resumed the rally higher.
EURJPY 1 Hour Chart
ECB’s Nowotny Hints At Coming Rate Hikes For The Euro
Key Points:
- ECB Nowotny suggests rate hikes on the way for the Eurozone.
- Central Bank may increase deposit rates but leave prime unchanged.
- QE program likely to continue regardless of policy tightening.
The last 24 hours has been an interesting watershed moment in monetary policy as the U.S. Federal Reserve raised the FFR 25bps and purportedly is now embarking on a cycle of tightening. In addition, the Bank of England, although holding rates steady at 0.25%, also heralded a significantly more hawkish than expected view. However, it was a surprising statement from the European Central Bank that caught the market by surprise as the ECB's Nowotny suggested that rate hikes could be on the way for the Eurozone.
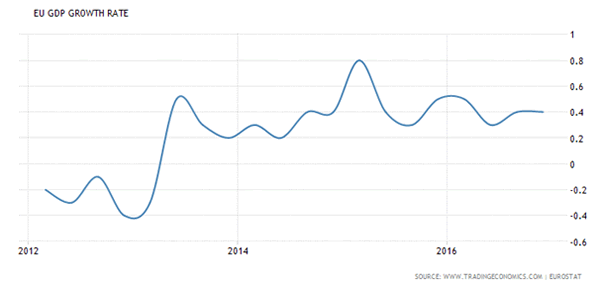
Subsequently, it would appear that after years of an extraordinary stimulus package that the Eurozone may be resuming a period of building inflation pressures. Certainly the latest round of CPI data seems to concur with the overall view that strong inflation is on the way with January and February posting 1.8%, and 2.0% gains respectively. However, GDP growth is still languishing behind the curve, with last quarter's anaemic 0.4% print, and will have to increase significantly to see the sort of gains that could support genuine inflationary pressures.
In addition, the EU's quantitative easing (QE) program is still ongoing and this is likely distorting much of the CPI data as the central bank continues to pump large amounts of money into the economy via bond markets. Subsequently, it would make little intuitive sense to raise rates whilst at the same time the ECB continues stimulating the economy.
The reality is that what most concerns the ECB currently is the malaise within the Eurozone's banking sector and potential risk that is ever present. Currently, most continental bank's margins are being squeezed by the central banks negative interest rate policy. The deposit rate presently sits at -0.40% and this is a cost that is typically unable to be passed on to consumers and is therefore absorbed. Subsequently, any move by the ECB to raise rates could help alleviate that profit gap for the big banks and allow them to recapitalise over a period of time, without the need for bailouts.
However, this sort of monetary policy mix of QE and rate hikes is not without its risks as expectations plays a critical role in the central bank's ability to shape forward expectations. In fact, any move to undertake a rate hike by stealth could back fire dramatically if the ECB gets the tone of their message wrong and business and consumer confidence takes a dive. Any such misfire of the policy mix could see things turn relatively toxic for the ECB and damage their ability to shape forward guidance in the future.
USDCHF Ready To Rebound
Key Points:
- A reversal is expected in the near-term.
- Ascending trend line is now coming into play.
- The pair has become highly oversold.
The Swissy's severe losses could be about to be put on pause if the technical bias is anything to go by. Specifically, the pair has moved into conflict with some robust support and a number of other technical readings are suggesting that a near-term reversal is now on the cards. Furthermore, the impending US data could provide the momentum needed to turn the USDCHF around in the final session of the week, making it worthwhilewatching this pair.
Starting with the technical bias, as mentioned above, one key reason a reversal is now forecasted for this pair is a strong zone of support around the 0.9951 level. Historically, this point has proven to be a reversal zone which will have the bears taking a more cautious approach moving ahead. Moreover, the bulls will be emboldened by the USDCHF's proximity to the ascending trend line which will likely begin to exert some buying pressure in the very near-term.
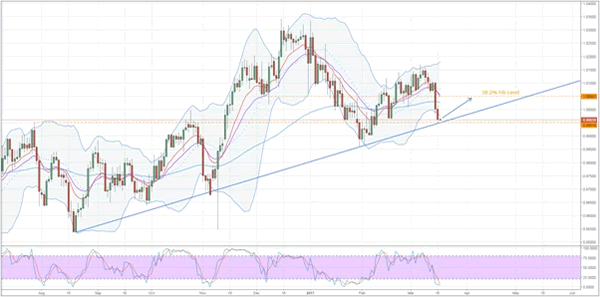
Some other technical readings that signal upsides are likely on the horizon are the stochastics and the Bollinger bands. Starting with the stochastic oscillator, this is highly oversold which will certainly be generating some buoyancy moving ahead. As for the Bollinger bands, the extreme selling pressure of the past few sessions has pushed price action below the lower band which should mean that the pair now seeks to regress back to the basis line.
Whilst the evidence for a reversal is quite robust, it is not expected that the entirety of the recent bearish price action is eroded. Predominantly, the presence of some dynamic resistance courtesy of the 100 day EMA and the 38.2% Fibonacci retracement suggests that gains will be capped around the 1.0050 mark. However, with an assist from some bullish fundamentals, the rally could extend beyond this point.
Speaking of which, the fundamental news to keep an eye on will largely come from the US front. Notably, the US Industrial Production and Preliminary Michigan Consumer Sentiment Figures are due out as the week winds down and could generate some buoyancy for this pair. Additionally, if Trump can avoid sparking any controversy as the week comes to an end, the Franc could weaken against the USD as the perceived political risks strengthening it subside.
Ultimately, the mix of fundamental and technical forces described above should see a rally in the next session or two so keep an eye on the Swissy. Specifically, that ascending trend line should come into play, especially if the fundamentals come in better than forecast. However, watch out for any potential breakouts that could result from political turmoil stemming from either Trump or the ongoing Brexit saga.
European Open Briefing
Global Markets:
- Asian stock markets: Nikkei down 0.30 %, Shanghai Composite fell 0.25 %, Hang Seng rose 0.30 %, ASX 200 gained 0.35 %
- Commodities: Gold at $1226 (+0.01 %), Silver at $17.30 (-0.20 %), WTI Oil at $48.90 (+0.25 %), Brent Oil at $51.80 (+0.15 %)
- Rates: German 10 year yield at 0.44, UK 10 year yield at 1.26, US 10 year yield at 2.54
News & Data:
- NZ ANZ Consumer Confidence (MoM) (Mar): -1.70% (prev -1.00%)
- NZ ANZ Consumer Confidence Index (Mar): 125.2 (prev 127.4)
- Wall Street slips with healthcare stocks, Nasdaq flat
- Oil prices mark time, set for small weekly rise
Markets Update:
The US Dollar came under further pressure overnight. While the Fed hiked rates on Wednesday, it did not signal that further hikes will follow soon and remained rather cautious. This triggered position covering from USD longs and brought the currency under pressure against most other G10 peers.
EURUSD rallied to 1.0780 overnight. Traders and investors were relieved about the election victory in the Netherlands, and seem now a little bit less worried about the upcoming French elections. This supported the Euro, and it rose against most other major currencies as well.
Meanwhile, the British Pound rallied. Despite the on-going Brexit worries, GBP caught a bid after the BoE meeting. It reached a high of 1.2357 in Asia. Should it break above that resistance level, the next big level to watch is 1.25.
Upcoming Events:
- 10:00 GMT – Euro Zone Trade Balance
- 14:15 GMT – US Industrial Production
- 13:15 GMT – US Manufacturing Production
- 14:00 GMT – US Michigan Consumer Sentiment
Daily Technical Analysis
EURUSD
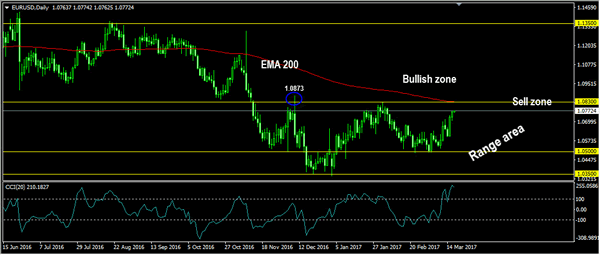
The EURUSD continued its bullish momentum yesterday topped at 1.0770. The bias remains bullish in nearest term testing 1.0830 area located at the daily EMA 200 as you can see on my daily chart below which is a good place to sell with a tight stop loss above 1.0873. Immediate support is seen around 1.0710. A clear break below that area could lead price to neutral zone in nearest term testing 1.0650 support area. On the upside, a clear break and daily/weekly close above 1.0830 – 1.0873 would activate my bullish mode.
GBPUSD
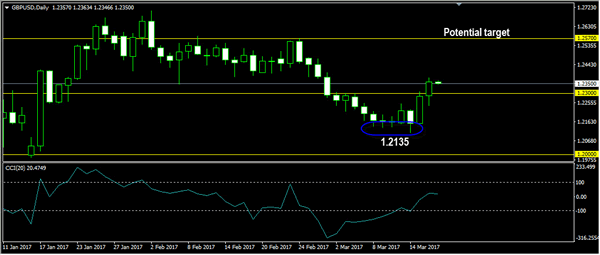
The GBPUSD continued its bullish momentum yesterday topped at 1.2376 as a part of the bullish scenario after bounced from triple bottom formation at 1.2135. The bias remains bullish in nearest term testing 1.2450 area. Immediate support is seen around 1.2300. A clear break below that area could lead price to neutral zone in nearest term testing 1.2250/25 area. On the upside, a clear break and daily/weekly close above 1.2450 would expose 1.2570 – 1.2600 region next week. Overall I remain neutral.
USDJPY
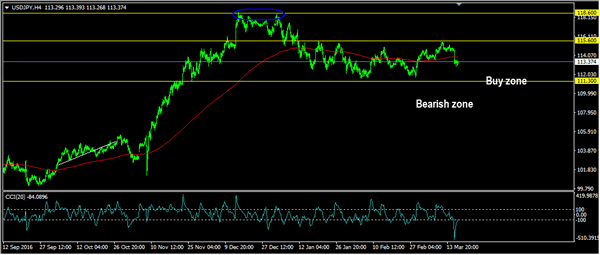
The USDJPY was indecisive yesterday. The bias is neutral in nearest term. Immediate support is seen around 112.90 (yesterday’s low). A clear break below that area could trigger further bearish pressure testing 112.50 but key support remains at 111.30 area which is a good place to buy with a tight stop loss. Immediate resistance is seen around 113.50. A clear break above that area could trigger further bullish pressure testing 114.00 or higher.
USDCHF
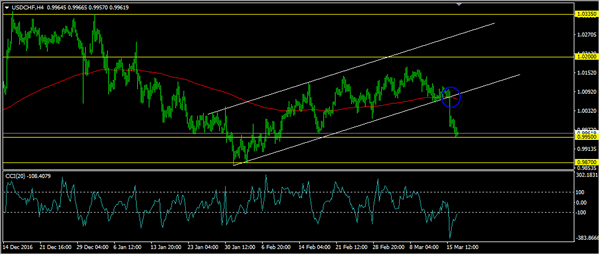
The USDCHF continued its bearish momentum yesterday bottomed at 0.9951. The bias remains bearish in nearest term testing 0.9870 support area. Immediate resistance is seen around 0.9985. A clear break above that area could lead price to neutral zone in nearest term testing 1.0020/50 area. Overall I remain neutral.
Forbes’ Dissent Would Unlikely Speed Up BOE’s Rate Hike Schedule
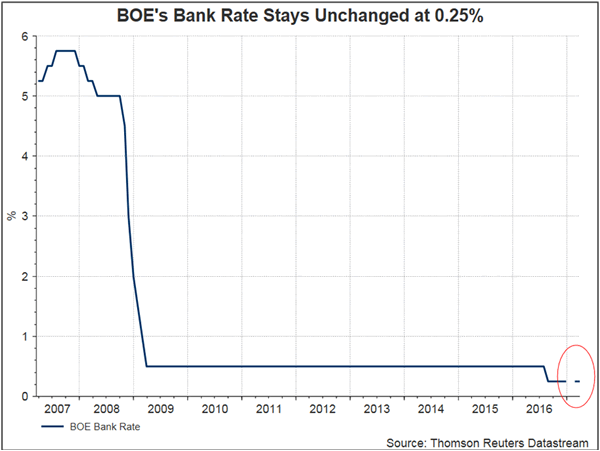
To our, and the market's, surprise, BOE's Kristin Forbes voted in favor of a 25 bps rate hike in March. While this had not altered the decision of keeping the Bank rate unchanged at 0.25%, the overall message sent to the public has now become more hawkish. The members voted unanimously to leave the government bond purchases at 435B pound and corporate bond purchases at up to 10B pound. Adding to the rising speculations of tightening is the minutes, which suggested that some of those who voted for unchanged policy believed 'it would take relatively little further upside news on the prospects for activity or inflation for them to consider that a more immediate reduction in policy support might be warranted'. GBPUSD jumped to a 2-week high of 1.2376 after the announcement, before settling at 1.2358, up +0.55%.
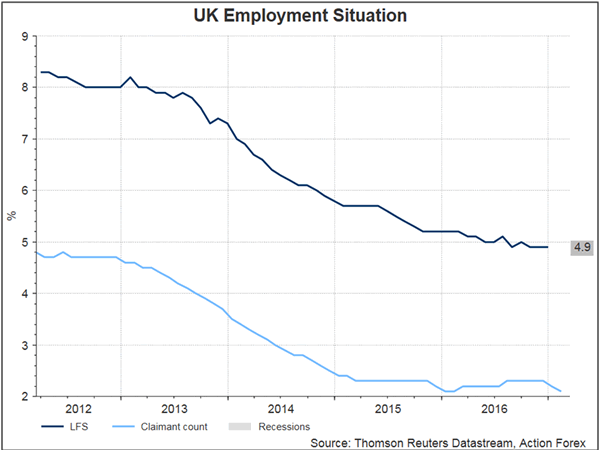
Leaving the MPC in June, Forbes has been the most hawkish member of the committee. Yet, she had not called for a rate hike until the March meeting. As she explained in an article written for Daily Telegraph, Forbes noted that 'although wage growth has been disappointing, this likely reflects temporary caution around Brexit,'. She added that the 'softening' on consumer spending 'should only be moderate, due to support from resilient consumer confidence, solid house prices, low unemployment, and easy access to cheap credit'. While there are 'risks consumers could pull back more sharply — but these are still just risks'.
It is not only the hawkishness of Forbes that sent tightening speculations higher. Indeed, the minutes signaled that other members have turned more confident over the economic outlook. For the eight members who voted to keep the policy rate unchanged, they cited subdued pay growth, slacks in the labour market and the squeeze in households' real income growth as the factors for maintaining the status quo. They also noted the uncertainty over post-Brexit trading arrangements would pose 'downside risk to the activity outlook'. However, they added that 'with inflation rising sharply, and only mixed evidence on slowing activity domestically, some members noted that it would take relatively little further upside news on the prospects for activity or inflation for them to consider that a more immediate reduction in policy support might be warranted'. This is definitely a more hawkish move, as the February minutes noted that 'for some members, the risks around the trade-off embodied in the central projection meant they had moved a little closer to those limits'.
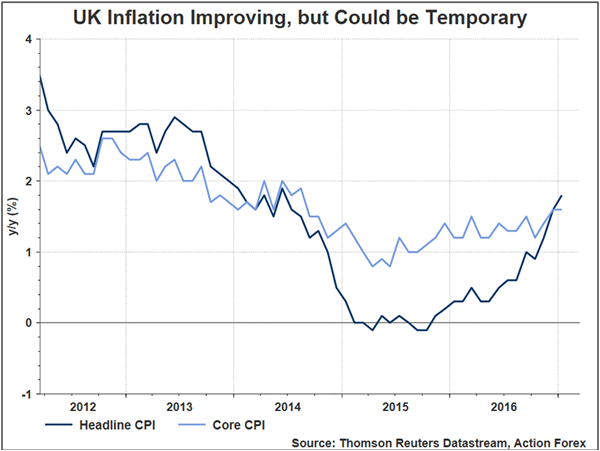
Although the members appeared more hawkish than previously, we expect that BOE would remain on hold throughout the year. First, Forbes would leave the MPC at the end of June. Her successor could be less hawkish, rebalancing the committee towards a less bullish team. Second, the expected economic growth slowdown could be felt more deeply, offsetting the strong inflation which could prove temporary.
Foreign Exchange Market Commentary
EUR/USD
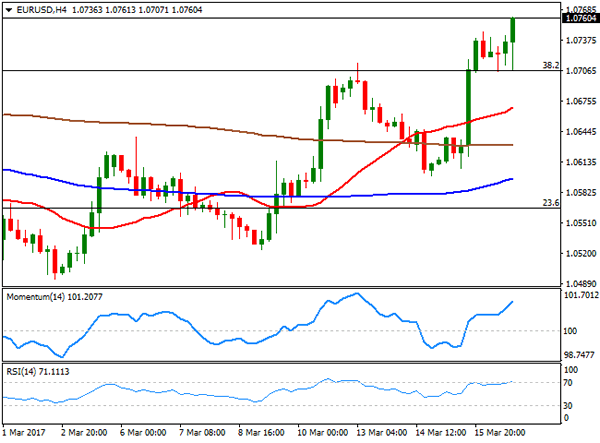
After spending the day in a tight 40 pips range, the EUR/USD pair soared to a fresh 1-month high above 1.0760, following comments from ECB's Nowotny, governor of the Austrian National Bank and a member of the Governing Council , after he said that rate hikes could be done in a different manner from Fed, and that a "rate increase may be on the way." The greenback remained weak after Wednesday's Fed's decision, whilst the common currency find support in the Dutch election's outcome, as the far-left Party for Freedom came in second with 20 seats, whilst the ruling party won 33 seats, bringing some relief to the EU, diminishing fears that populism is taking over Europe.
In the data front, EU February final inflation figures matched expectations, with inflation confirmed at 2.0% in the month against 1.8% in January. In the US, and for the week ending March 11, initial jobless claims were of 241,000, down 2,000 from the previous week, although above market's expectations of 240K. Housing starts surged to a fresh 4-month high to a 1.288 million annualized rate, surpassing expectations, although Building permits missed expectations, surging by 1.213 million.
As for the technical outlook, the EUR/USD pair retains a bullish stance as it held well above 1.0700, now breaking also above the previous weekly high. In the 4 hours chart, the 20 SMA heads north after advancing beyond the 100 and 200 SMAs, whilst technical indicators have resumed their advances near overbought territory, favoring additional gains for the upcoming sessions, towards 1.0820, the 50% retracement of the post-US election decline.
Support levels: 1.0745 1.0710 1.0660
Resistance levels: 1.0785 1.0820 1.0860
USD/JPY
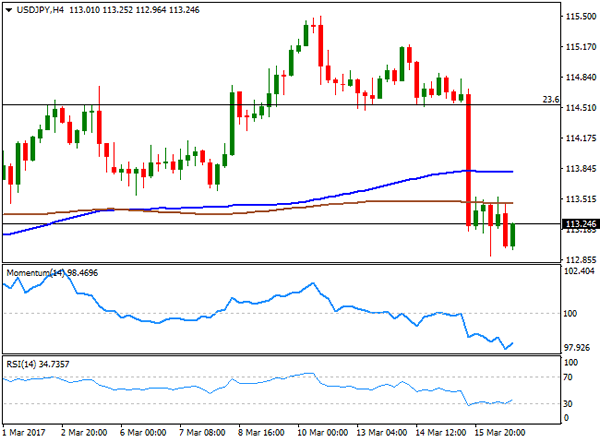
The USD/JPY pair established around 113.25 ahead of Friday's opening, recovering partially from a fresh 2-week low of 112.90 achieved at the beginning of the day. The Bank of Japan has its monetary policy meeting right after US Federal Reserve one, but decided to make no changes to its ongoing stimulus programs. In fact, Governor Kuroda said that an uptick in inflation towards 1% won't immediately trigger an interest rate hike, indicating that the Central Bank has no plans to modify the monetary status quo, and that the economy still needs massive stimulus to fight deflation. Despite soft, US housing and employment data was enough to prevent the pair from falling further, albeit not enough to revert the negative tone triggered by the Fed. Technically, the 4 hours chart shows that selling interest contained advances around a horizontal 200 SMA, in the 113.50 region, while the 100 SMA stands above it, also lacking directional strength. Indicators in the mentioned chart have bounced modestly from oversold readings, but are far from suggesting a change in the dominant trend. Renewed selling interest below the mentioned daily low should see the pair resuming its decline towards 112.00 a long term Fibonacci support.
Support levels: 112.90 112.50 112.10
Resistance levels: 113.50 114.00 114.50
GBP/USD
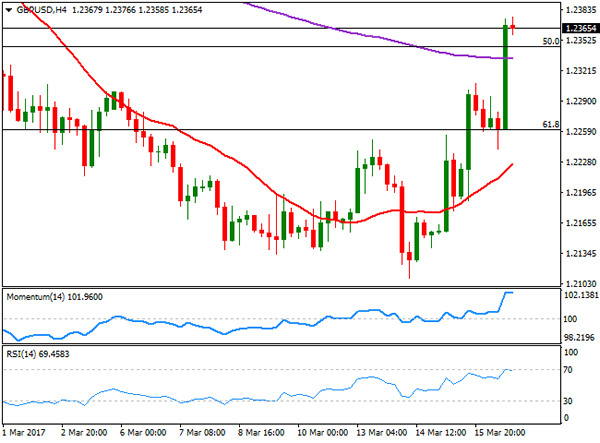
The GBP/USD pair soared to a fresh 2-week high of 1.2376, holding nearby at the end of the day. The rally came after the BOE's monetary policy meeting, as despite the Central Bank left its policy unchanged, there was one dissenter among the MPC member, Christine Forbes. Forbes considered that given that inflation is projected to remain above-target for the next years, while growth is showing signs of slowing, a rake hike was compelling. Additionally, the Minutes of the meeting said that “with inflation rising sharply, and only mixed evidence on slowing activity domestically, some members noted that would take relatively little further upside news on the prospects for activity or inflation for them to consider that a more immediate reduction in policy support might be warranted.” Brexit jitters have been left aside temporarily, although they may return to the market once the Central Banks´ feast euphoria eases. The 4 hours chart shows that the pair has settled above 1.2345, the 50% retracement of the January rally and February's monthly low, while the price has advanced far above a bullish 20 SMA, and also beyond the 200 SMA for the first time this March. Technical indicators in the mentioned time frame have lost upward momentum and turned fat in overbought territory, not enough to confirm a downward move. Additional advances expose the 1.2425 level, the 38.2% retracement of the same rally.
Support levels: 1.2345 1.2300 1.2260
Resistance levels: 1.2380 1.2425 1.2470
GOLD
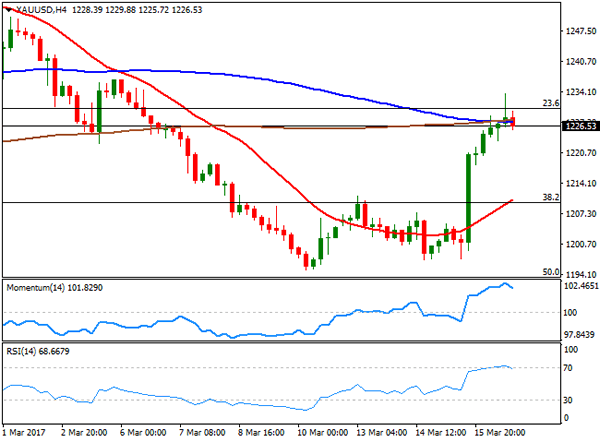
Gold prices continued advancing this Thursday, with spot reaching $1,233.62 a troy ounce, to settle at 1,226.60. The sharp advance in the commodity came after the US Federal Reserve indicated that they won't accelerate the pace of tightening. Gains were contained by increasing optimism after Dutch elections that fueled demand for higher yielding assets. The daily chart for the commodity shows that the price settled below its 20 DMA and a Fibonacci resistance, the 23.6% retracement of the latest daily bullish run at 1,230.10, holding also far below a bearish 200 DMA, currently at 1,250.65. This last, capped February's rally. In the same chart, technical indicators have extended their recoveries, with the Momentum still below the 100 level and the RSI at 53. In the 4 hours chart, the price is struggling around the 100 and 200 SMAs, both converging around 1,227.00, while technical indicators have turned modestly lower, still holding within overbought territory. Should the price extend beyond the mentioned 1,230.10, the risk turns towards the upside for this Friday.
Support levels: 1,223.15 1,212,90 1,203.30
Resistance levels: 1,230.10 1,242.50 1,250.65
WTI CRUDE
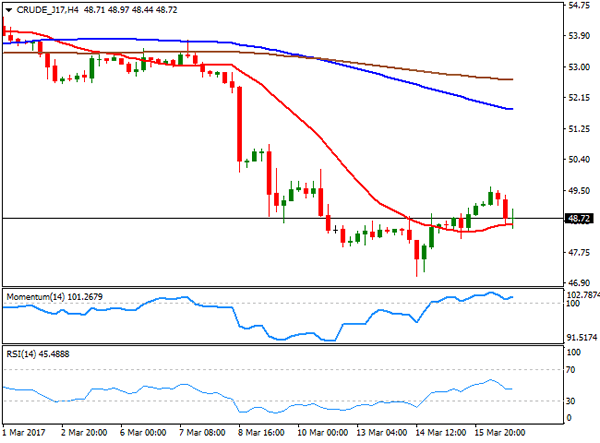
Crude oil prices managed to extend their advances at the beginning of the day, but later retreated, with West Texas Intermediate crude futures settling at $48.70 a barrel after peaking at 49.60 at the beginning of the day. Concerns about rising output in the US weighed on the commodity, despite the latest EIA report showing that stockpiles decreased for the first in the past ten weeks. The daily chart shows that the commodity advanced briefly, but settled below the 200 DMA, currently at 49.10, while technical indicators have turned flat in oversold territory after a modest upward correction, indicating that buying interest remains limited. In the 4 hours chart, the price is standing a few cents above a flat 20 SMA, while technical indicators have pulled back towards their mid-lines, now attempting to bounce, but still within neutral territory.
Support levels: 48.00 47.30 46.65
Resistance levels: 49.10 49.75 50.50
DJIA
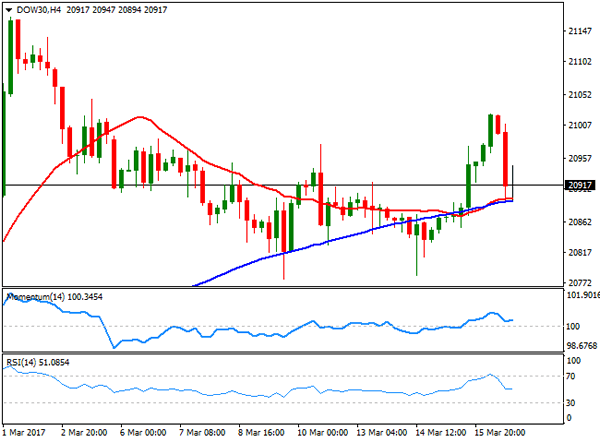
US indexes closed mixed, but not far from their daily openings. The Nasdaq Composite advanced less than 1 point, and closed at 5,900.76, while the S&P and the Dow closed in the red, with the first down 3 points to 2,381.38 and the DJIA shedding 15 points or 0.07%, to 20,934.55, as investors continued to digest the latest Fed's announcement. Within the Dow, most members closed lower, with oil-related equities leading the decline as the commodity failed to extend its latest recovery. El du Pont was the worst performer, closing 1.08% lower, followed by Chevron that shed 0.94%. Financials were among the best performers, with American Express up 0.68% and Goldman Sachs adding 0.58%. The index's daily chart shows that it held again above its 20 DMA that anyway has partially lost its upward strength, whilst technical indicators erased the positive momentum gained on Wednesday, although hold within positive territory. In the 4 hours chart technical indicators have also lost their bullish strength, now flat above their mid-lines, whilst the 20 and 100 SMAs converge at 20,900, providing an immediate support that if broken, could lead to a deeper correction.
Support levels: 20,900 20,852 20,817
Resistance levels: 20,978 21,015 21,064
FTSE 100
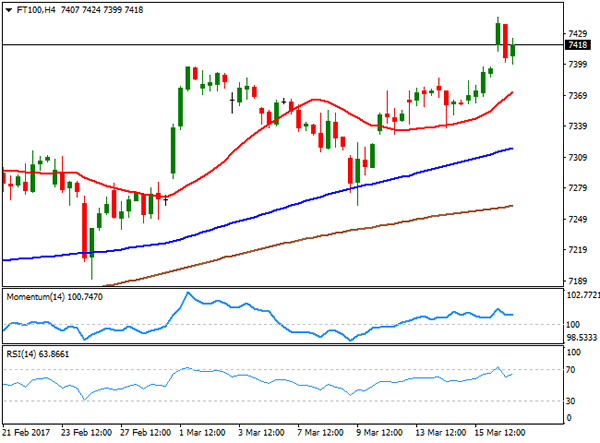
The FTSE 100 closed at a record high of 7,415.95, up by 47 points or 0.64%. The index got a boost from mining-related equities, as a weaker dollar fueled the recovery of base metals. The Footsie reached an all-time high of 7,445, although a strong advance in the Pound weighed on equities mid London session. The top performers were Anglo American closing the day 8.62% higher, Glencore adding 5.01% and Antofagasta surging by 4.65%. Hikma Pharmaceuticals was the worst performer, down by 4.66%. The daily chart shows an increasing upward potential, as the Momentum indicator finally advanced from neutral territory, heading now north at fresh 2-month highs, whilst the RSI indicator also heads sharply higher around 68, and the index holds above all of its moving averages. In the 4 hours chart, technical indicators resumed their advances within positive territory after correcting overbought conditions, whilst the 20 SMA has accelerated its advance below the current level, supporting additional advances as long as Pound's rally remains contained.
Support levels: 7,399 7,363 7,338
Resistance levels: 7,445 7,480 7,510
DAX
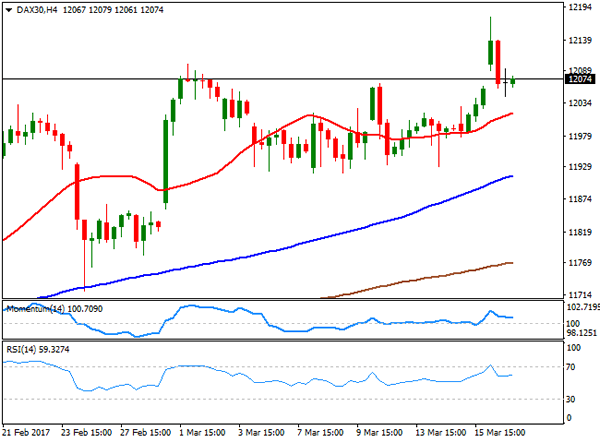
The German DAX added 73 points to settle at 12,083.18, with all of the broad-based European indexes closing with gains this Thursday, fueled by previous Wall Street's gains, and with optimism surging in the region after the ruling party defeated its populist competitor in the Dutch elections. Within the DAX, Deutsche Lufthansa was the best performer, adding 4.18%, followed by Deutsche Post that gained 1.87%. Heidelberg Cement led decliners, down 1.83%. The DAX closed off an multi-month high of 12,177, level last seen in March 2015. Holding near the mentioned close, the daily chart shows that the benchmark posted a higher high and a higher low daily basis, holding above bullish moving averages, whilst technical indicators head north within positive territory, favoring additional advances ahead. In the 4 hours chart, the index also stands above bullish moving averages, with the 20 SMA now at 12,018, whilst technical indicators have turned flat within positive territory after correcting overbought conditions.
Support levels: 12,059 12,018 11,977
Resistance levels: 12,099 12,140 12,178
The Big Turn
Reversing a trade like EUR/USD is like turning an ocean liner - it's a slow process. Positive signals continue to trickle in as the euro was one of the top performer along with GBP and EUR on Thursday while the kiwi lagged. The Asia-Pacific calendar is light but expect many comments from finance ministers in the day ahead with the G20 meetings ramping up. A new Premium trade has been added, backed by 3 charts and 6 factors and is considered a partial hedge to yesterday's trade.
The second day of March madness in financial markets was all about the Bank of England. Forbes delivered a surprise by voting for a rate hike and that gave the pound a lift. In an op-ed, she said Brexit uncertainty has held down wages and that inflation is coming.
But the ECB's Nowotny and Praet that have our attention. Praet said the outlook is now better than it has been in many years and Nowotny said a rate increase may be on the way. He also said the deposit rate/refi rate corridor could narrow.
In addition, the Dutch election results argue that populism is on the wane and French polls have been steady. Perhaps what's been most impressive was the euro's resilience in early March. EUR/USD gained despite hawkish Fed talk and great US data.
We will be watching the economic data closely in the weeks ahead but we don't see the comments from Nowotny and Praet as a coincidence. They are two of the most-experienced core members of the ECB and they aren't prone to comments that stray from Draghi's thinking.
An extended policy of easing has submarined the euro from 1.60 to 1.06 and even if there is no scope for a full retracement, some stability or a hawkish turn from the ECB could easily mean 1.15 or 1.20.
Another central bank that is overdue for a hawkish comment, or at least a less-dovish one, is the Bank of Japan. That didn't happen Thursday and Kuroda was defiant but the shift in global central banking tone is beginning to look like dominos falling and when the BOJ changes, yen crosses will have a long way to fall.
Market Morning Briefing
STOCKS
Equity indices are almost mixed. Dax could face some rejection near current levels while Dow and Nikkei could remain stable. Shanghai and Nifty are trading strong and looks bullish amongst others.
Dow (20934.55, -0.07%) is stuck within important resistance and support levels of 21200 and 20800 respectively and needs a clear break on either side just now to decide on further direction. However, we prefer a break on the upside in the early next week.
Dax (12083.18, +0.61%) has come up to test resistance near 12200 and while that holds, a small dip is possible. A break above 12200 could be bullish towards 12400.
Nikkei (19523.17, -0.34%) is stuck within the narrow 19600-19400 region and could spend a couple of sessions in this range. Medium term looks bullish towards 19900-20000 levels on a break above 19600.
Shanghai (3270.35, +0.05%) could be headed higher while above 3250. Looking at the weekly line chart, the index looks bullish for the medium term. We could expect a rise towards 3300 just now with a higher target of testing 3400 in the medium term.
Nifty (9153.70, +0.76%) has risen sharply this week maintaining above the 8930 support level on the Weekly candles. Our initial target of 9130 has been broken yesterday and we now look towards 9280 in the coming sessions.
COMMODITIES
Gold (1227) is trading below 1240, which is the pivot of its recent trading range of 1213-1266.This could open up lower supports at 1213 and 1200 respectively. While 1200 may hold for a few sessions, considering the short term oversold state, but the chances of seeing 1180 and lower levels are much greater now.
Silver (17.31) is also trading within the range of 16.81-17.45.In case of any short covering, the upside in the near term may be limited for bullion. The trend is bearish in the near to medium term time frame and any corrective bounce may face selling pressure at the higher levels.
Copper (2.67) was unable to close above its pivot at 2.72 of its recent trading range of 2.55-83. We will remain bearish while it is trading below 2.70-72.Only a close above 2.72 could negate our short term bearish view.
Brent (51.77) and WTI (48.83) both are still within their narrow trading channel of 50-52.50 and 47.5-50. It may consolidate within these levels for few more sessions though the possibility of a decline towards channel supports can’t be ruled out. We will remain bearish while Brent and WTI are trading below 53 and 50 levels respectively.
FOREX
Further weakness overnight for the Dollar against the Euro (1.0775), but some recovery against the Yen (113.45). The Dollar Index (100.26) trades lower while the Euro-Yen (122.23) trades higher. As mentioned yesterday, break below 100.40 on Dollar Index sets up a near term target of 99.00. Further weakness below 99, although possible, may take time to materialise.
The Euro-Yen looks like it wants to test 123, a move that may be driven more by Dollar-Yen (113.45) if it manages to remain above 21-week Moving Average Support near 113.00
Near term Resistance is coming up near 1.08 on the Euro, so be careful about chasing the market and buying late. While below 1.08, we could see a corrective dip towards 1.07-1.06 again. That said, in case there is a strong break above 1.08, the focus will shift upwards to 1.10. For that to happen, the Dollar Index may need to break below 99, which may take time.
The Pound (1.2350) has broken above the resistance at 1.23 mentioned yesterday and is close to testing near term Resistance at 1.2410-20, which might hold on first testing. An eventual break, if seen, will pull the Pound up towards 1.26. The Euro-Pound (0.8721) is relatively bullish while the Pound-Yen (140.15) is trading sideways.
Important Resistance is seen near 0.7725 on the Aussie (0.7685) which is holding for now. In case it is broken some more upside towards 0.7810-20 may be possible, but that too may hold.
In sum, although the current Dollar weakness can persist for a day or two, be aware of Support at 99 on the Dollar Index and Resistances at 1.08 on the Euro, at 1.24 on the Pound and 0.7725 on the Aussie.
Dollar-Rupee trades near 65.35 on the NDF. Possibly the RBI will try to limit its downside for the while.
INTEREST RATES
The US yields recovered a bit yesterday but continues to trade below the immediate resistance levels. The yields could come off a little more in the near term before again heading towards respective resistance levels.
The Japanese yields have paused after the recent fall in the last few sessions and could possibly move up a little in the near term. The 5Yr (-0.13%), 10Yr (0.08%) and the 30Yr (0.84%) are almost stable compared to yesterday’s levels.
The UK 10-5Yr (0.65%) has recovered as expected and could move up towards 0.70-0.75% in the coming sessions. That could possibly help the yields also to recover a bit on the higher side.
Fed Pullback Brings USD/JPY Longs into Play
We've been following the current USD/JPY narrative on the blog for a while now, with price above a higher time frame support level, but now capped inside a range as it tries to work its way higher.
Obviously yesterday's USD negative Fed rate hike kept price within this range and brought price back down again.
But to me, so long as we're above this following daily level…
USD/JPY Daily:
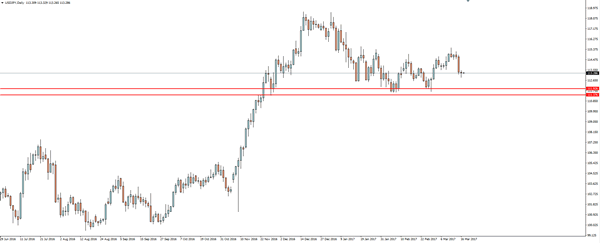
…then long are in play, and any short term pullback such as this is there to be bought.
Short term pullbacks to levels such as this…
USD/JPY 4 Hourly:
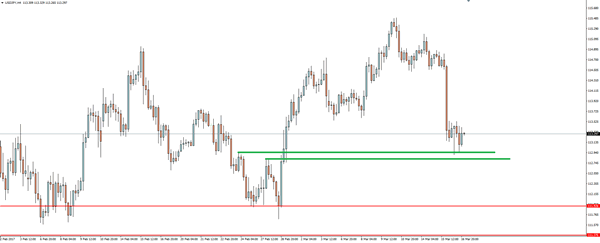
…where price is obviously at least starting to react.
Just keep in mind that earlier in the week I've been talking about shorting EUR/JPY.