Sample Category Title
USD/CHF Mid-Day Outlook
Daily Pivots: (S1) 0.9654; (P) 0.9694; (R1) 0.9749; More.....
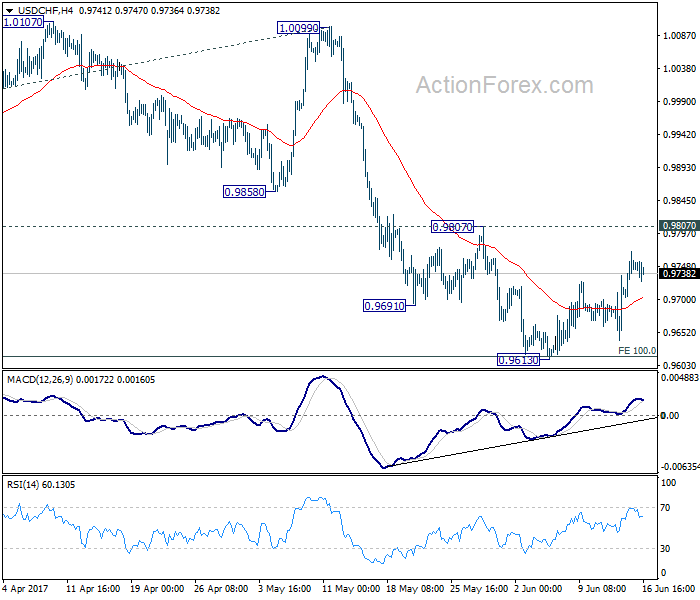
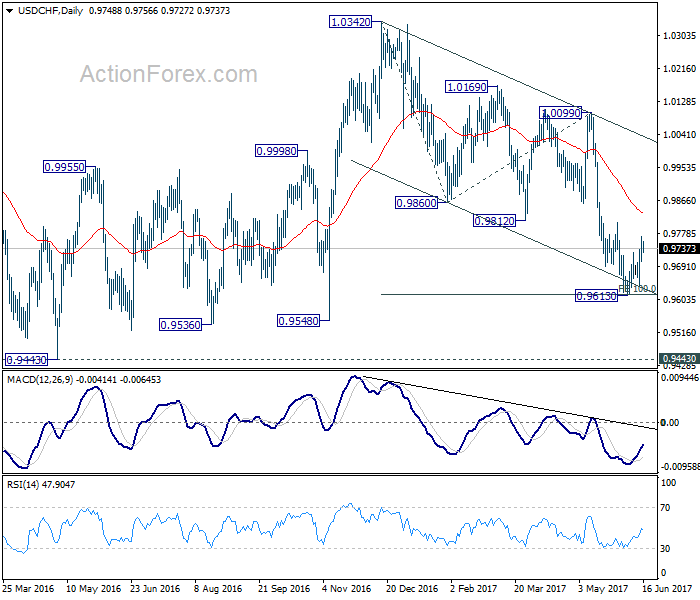
USD/CHF is staying in range of 0.9613/9807 and intraday bias remains neutral, with bearish near term outlook. Break of 0.9613 will extend the whole decline from 1.0342 to 0.9548 support and below. We'd start to look for bottoming signal again as it approaches 0.9443 key support level. However, considering bullish convergence condition in 4 hour MACD, break of 0.9807 will indicate near term reversal and turn outlook bullish for 1.0099 resistance next.
In the bigger picture, USD/CHF is still bounded in medium term range of 0.9443/1.0342 for the moment. Consolidative trading would likely continue and medium term outlook remains neutral. Break of 1.0342 key resistance is needed to confirm underlying bullish momentum in the pair. Meanwhile, downside attempts should be contained by 0.9443 key support level. However, sustained break of 0.9443 will carry larger bearish implication and target 0.9 handle.
Trade Idea Update: USD/CHF – Buy at 0.9705
USD/CHF - 0.9744
Original strategy :
Buy at 0.9705, Target: 0.9805, Stop: 0.9670
Position : -
Target : -
Stop : -
New strategy :
Buy at 0.9705, Target: 0.9805, Stop: 0.9670
Position : -
Target : -
Stop : -
As the greenback has eased after surging to 0.9771 yesterday, suggesting minor consolidation below this level would be seen and pullback to 0.9720 cannot be ruled out, however, reckon support at 0.9703 would limit downside and bring another rise later, above said resistance at 0.9771 would extend recent rise from 0.9613 low to resistance at 0.9808, however, reckon previous resistance at 0.9825 would hold from here due to near term overbought condition, bring retreat later.
In view of this, we re looking to buy dollar on pullback as 0.9700-05 should limit downside. Below 0.9680 would defer and risk weakness towards said support at 0.9641 but only break there would abort and revive bearishness, this would also suggest the rebound from 0.9613 has ended instead, bring retest of this level later.

Trade Idea Update: GBP/USD – Hold short entered at 1.2790
GBP/USD - 1.2777
Original strategy :
Sold at 1.2790, Target: 1.2690, Stop: 1.2800
Position : - Short at 1.2790
Target : - 1.2690
Stop : - 1.2800
New strategy :
Hold short entered at 1.2790, Target: 1.2690, Stop: 1.2800
Position : - Short at 1.2790
Target : - 1.2690
Stop : - 1.2800
Although the British pound retreated from 1.2818 to yesterday’s low at 1.2690, the subsequent rebound suggests consolidation would be seen, however, as long as 1.2795-00 holds, mild downside bias remains for another fall to 1.2680-90, break there would retain bearishness and signal the rebound from 1.2635 has ended, bring further fall to 1.2650, then towards said support at 1.2635.
In view of this, we are holding on to our short position entered at 1.2790. Only above said resistance at 1.2818 would defer and risk a strong rebound to 1.2845-50 (61.8% Fibonacci retracement of 1.2978-1.2635) but upside should be limited to 1.2870-80.

Trade Idea Update: EUR/USD – Sell at 1.1210
EUR/USD - 1.1173
Original strategy :
Sell at 1.1190, Target: 1.1090, Stop: 1.1225
Position : -
Target : -
Stop : -
New strategy :
Sell at 1.1210, Target: 1.1110, Stop: 1.1245
Position : -
Target : -
Stop : -
This week’s selloff from 1.1296 signals top has been formed there and consolidation with downside bias is seen for this move to bring a strong retracement of recent upmove, hence further fall to previous support at 1.1109 would be seen, however, break there is needed to retain bearishness and extend further weakness to 1.1076 and possibly towards 1.1050 but price should stay above previous resistance at 1.1025.
In view of this, we are looking to sell euro on recovery as 1.1210-15 (50% Fibonacci retracement of 1.1296-1.1132) should limit upside and bring another decline. Above 1.1230-35 (61.8% Fibonacci retracement) would defer and risk a stronger rebound to 1.1250 but price should falter well below said resistance at 1.1296, bring another decline later.

USD/JPY Mid-Day Outlook
Daily Pivots: (S1) 109.81; (P) 110.39; (R1) 111.52; More...
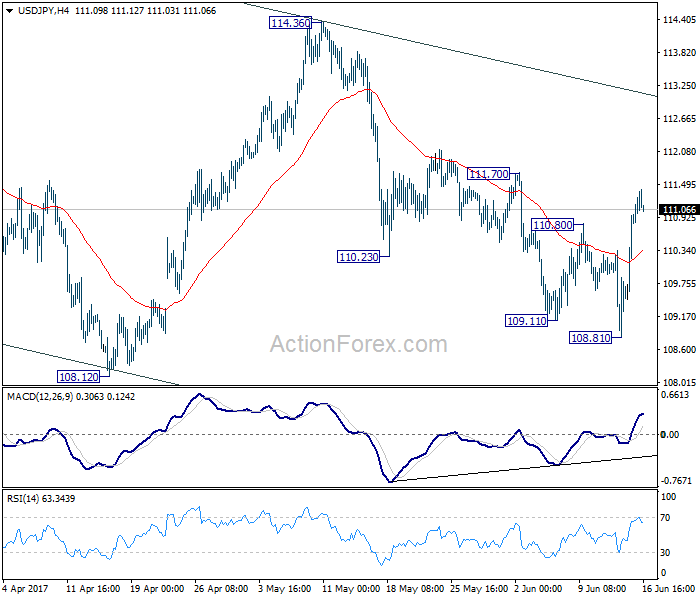
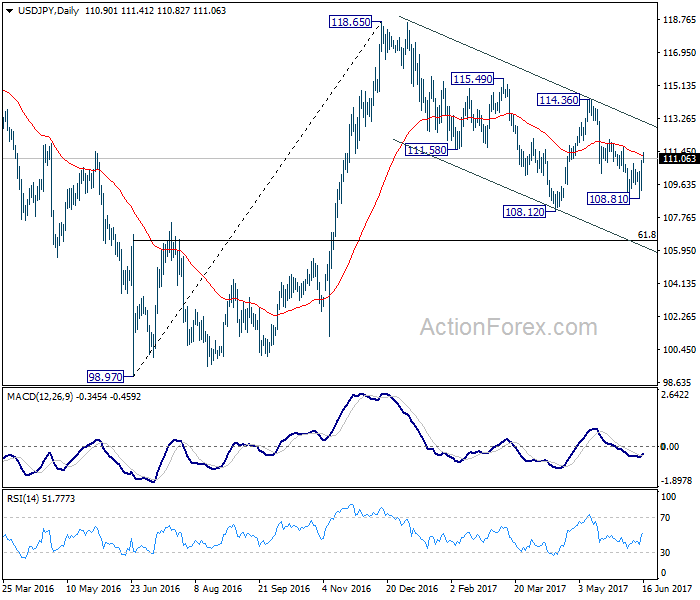
Intraday bias in USD/JPY remains on the upside for near term channel resistance (now at 113.06). Sustained break there will suggest that whole pull back from 118.65 has completed at 108.12 already. In such case, further rise should be seen to 114.36 resistance for confirmation. Nonetheless, break of 108.81 will still extend the fall from 118.65 through 108.12 low before completion.
In the bigger picture, price actions from 125.85 high are seen as a corrective pattern. It's uncertain whether it's completed yet. But in case of another fall, downside should be contained by 61.8% retracement of 75.56 to 125.85 at 94.77 to bring rebound. Overall, rise from 75.56 is still expected to resume later after the correction from 125.85 completes.
Commodity Currencies to End the Week Broadly Higher, Yen Remains the Weakest
Commodity currencies are set to end the week as the strongest ones, but not because of commodity prices. Canadian dollar is the largest gainer for the week after the hawkish twist in BoC comments. Meanwhile, Aussie was boosted by unemployment data and receding bet on RBA cut. Sterling and Dollar followed as supported by hawkishness of respective central banks. Meanwhile, Yen tumbled across the board as the global economy is starting to exit the era of ultra-loose monetary policies. In other markets, gold suffered steep selloff this week and is now trying to find support around 55 day EMA at 1257. WTI crude oil dropped to as low as 44.22 and couldn't find buying to recovery back above 45 handle yet.
UK PM May agreed to start Brexit negotiation with the bill
In UK, it's reported that Prime Minister Theresa May has finally conceded and agreed to start the Brexit negotiation with EU with the divorce bill first. That's what EU's negotiator Michel Barnier has been pushing for, settle on the bill, citizens right and border of Ireland before moving on to trade agreement. But Barnier emphasized there that is "no" bill for punishment but settlement of the accounts. UK's Brexit minister David Davis emphasized that US will pay what is due but "not just what the EU wants. The formal negotiation will start next Monday and continue throughout summer.
BoJ Kuroda refrained from talking about stimulus exit
In Japan, BoJ Governor Haruhiko Kuroda said in the post meeting press conference that "with the 2% inflation target still some way off, it is not appropriate to talk about how an exit is going to work, or show simulations on what an exit would mean in terms of the BOJ's financial health." He refrained to talk about any exit strategies. Instead, Kuroda pointed to the fact that what Fed is doing now, started to raise interest rate before shrinking the balance sheet, was not what it has indicated before.
BoJ on hold, slightly more upbeat
BoJ left monetary policies unchanged as widely expected. Benchmark interest is kept at -0.1%. Meanwhile, under the yield curve control framework, the central bank continues to target 10 year JGB yield at around 0%. Annual pace of asset purchase is held at JPY 80T. Locally, BoJ noted that "private consumption has shown increased resilience against a background of steady improvement in the employment and income situation". Globally, BoJ said that overseas economies were "continuing to grow at a moderate pace as a whole". Overall tone in the central's statement was slightly more upbeat than the previous one.
On the data front...
US housing starts dropped to 1.09m annualized in May. Building permits dropped to 1.17m. Canada international securities transactions dropped to CAD 10.5b in April. Eurozone CPI was finalized at 1.4% yoy, core CPI at 0.9% yoy in May. New Zealand business NZ manufacturing index rose to 58.5 in May.
USD/JPY Mid-Day Outlook
Daily Pivots: (S1) 109.81; (P) 110.39; (R1) 111.52; More...
Intraday bias in USD/JPY remains on the upside for near term channel resistance (now at 113.06). Sustained break there will suggest that whole pull back from 118.65 has completed at 108.12 already. In such case, further rise should be seen to 114.36 resistance for confirmation. Nonetheless, break of 108.81 will still extend the fall from 118.65 through 108.12 low before completion.
In the bigger picture, price actions from 125.85 high are seen as a corrective pattern. It's uncertain whether it's completed yet. But in case of another fall, downside should be contained by 61.8% retracement of 75.56 to 125.85 at 94.77 to bring rebound. Overall, rise from 75.56 is still expected to resume later after the correction from 125.85 completes.
Economic Indicators Update
| GMT | Ccy | Events | Actual | Forecast | Previous | Revised |
|---|---|---|---|---|---|---|
| JPY | Monetary Policy Statement | |||||
| 22:30 | NZD | Business NZ Manufacturing Index May | 58.5 | 56.8 | 56.9 | |
| 09:00 | EUR | Eurozone CPI M/M May | -0.10% | -0.10% | -0.10% | |
| 09:00 | EUR | Eurozone CPI Y/Y May F | 1.40% | 1.40% | 1.40% | |
| 09:00 | EUR | Eurozone CPI - Core Y/Y May F | 0.90% | 0.90% | 0.90% | |
| 12:30 | CAD | International Securities Transactions (CAD) Apr | 10.6B | 12.14B | 15.13B | 15.1B |
| 12:30 | USD | Housing Starts May | 1.09M | 1.21M | 1.17M | 1.16M |
| 12:30 | USD | Building Permits May | 1.17M | 1.25M | 1.23M | |
| 14:00 | USD | Labor Market Conditions Index | 3 | 3.5 | ||
| 14:00 | USD | U. of Michigan Confidence (JUN P) | 97.3 | 97.1 |
Trade Idea Update: USD/JPY – Buy at 110.40
USD/JPY - 111.05
Original strategy :
Buy at 110.40, Target: 111.40, Stop: 110.05
Position : -
Target : -
Stop : -
New strategy :
Buy at 110.40, Target: 111.40, Stop: 110.05
Position : -
Target : -
Stop : -
As the greenback has surged again and broke above previous resistance at 110.81 (now support), adding credence to our view that low has been formed at 108.82 and the rise from there shall bring retracement of recent decline from 114.37, hence further gain towards 111.60 (50% Fibonacci retracement of 114.37-108.82) would be seen, however, near term overbought condition should limit upside to previous resistance at 111.71 and price should falter well below another resistance at 112.13.
In view of this, we are looking to buy dollar on pullback but one should exit on next rise. Whilst a return move to 110.81 cannot be ruled out, reckon another previous resistance at 110.35 would contain downside and bring another rise later.

BOJ, Sterling, Greece & Oil Under Spot Light, Tesco Beats Sales Estimates
- No Colour Injected By BOJ, It Remains on Autopilot
- Sterling May Have Another Stab At Its Resistance
- No Greek Summer Theatre
- Oil Traders Reacted to IEA Forecast
European stocks are ignoring the butchery we experienced in the US equity which was triggered by the FANG stock. This was mainly on the back of two fundamental reasons. Firstly, the central banks around the globe tightening their screws on the liquidity taps. Finally, in some circumstances, such as the US, the instability in the economic data being confused with transitory weakness. The NASDAQ index has lost its thunder and given that it was mainly the tech sector which usually outperformed other sectors, the fear of matter going ugly is pushing investors to cash in their profits.
No Colour Injected By BOJ, It Remains on Autopilot
Kurado stayed away from the da Vinci painting brush and did not add any colour. The Bank of Japan kept its monetary policy on autopilot today. The bank is under pressure to follow the path of the ECB and the Fed, given the sheer size of its balance sheet. However, for now, they decided to keep everything unchanged. The bank still wants to see more improvement in private consumption and they think this is not the time to shift ground- at least for now. The policy balance rate was maintained at -0.1% and it could still expand its purchases up to 80 trillion yen.
Traders kept the Japanese yen on their sell list. The high of 112.07 is under their target while the support is at 108.93 which is the monthly low.
Sterling May Have Another Stab At Its Resistance
The sterling rebounded as investors reacted to the new hawkish member's decision in the MPC committee members. The three hawkish members reason that it is about time that the BOE should start normalising the interest rate. Inflation has strapped the consumer spending and the retail data was horrible. The governor of the Bank of England is facing more and more uncertainty and it would be equivalent of a catastrophe if he rushes into any hasty decision. In other words, the BOE's interest rate hike day is not in this year's calendar. Investors would remain quick in taking the profit off the table if we continue to fail the resistance of 1.2820. Failing to break the resistance of 1.2820 would confirm the downward bias.
Back in the UK, Theresa May is still trying to put all the broken pieces together and forming a coalition with the Northern DUP party remains on top of the bucket list. The deal she is brokering with the DUP party could include that the UK would not be required to stay in the EU's single market which means that she is trying to establish a stronger position in a relative perspective before she ignites the negotiation process next week.
No Greek Summer Theatre
Over in Europe, the thoughts of the Greek saga not derailing the markets further is the silver lining which we could see. Lately, the summer has been associated with a rough and tough battle between lenders and creditors. However, to save everyone trouble, the EU and the IMF decided not to put the theatre camp up and actually addressed the issue in a timely fashion.
Oil Traders Reacted to IEA Forecast
After touching the seven-month low, the black gold is finding some strength as bargain hunters think it may be the time to dip their toe. The IEA statement in which they confirmed that OPEC's rival will produce more oil than there will be demand and growth in the next year, would keep investors cautious. The statement was a hint to OPEC that they need to cut their production more to balance the market or sit with US shale producers to have a joint agreement towards the oil supply.
Tesco Beats Sales Estimates
Tesco has surprised investors today by maintaining its resistance in raising prices which boosted its sales growth to the strongest level which had not been seen in nearly seven years. The company has cut corners in reducing its cost but battled hard in not raising prices which is the key element to keep the tills ringing. It is an encouraging sign that their domestic same store surged by 2.3 percent in the face of rising inflation. The discount supermarkets such as Aldi and Lidl would keep the competition harsh in luring customers who are facing stagnant wages. It is important to keep in mind that investors are not going to keep jumping in buying the stock blindfolded because discounters are in a much better position still and investors would continuously need assurance that Tesco could continue to resurge its growth.
Aussie Dollar Maintains Overall Strong Bullish Structure
The Aussie dollar maintains overall strong bullish structure following break above pivotal barriers at 0.7560 zone (multi-day congestion tops / 100SMA).
However, fresh bullish extension was so far unable to sustain break above 0.7600 barrier and failed to close above next pivot at 0.7588 (Fibo 61.8% of 0.7749/0.7328 descend) on repeated attempts.
Daily candles with long upper wicks that were left on Wed/Thu signal strong hesitation, as rallies stalled at 0.7635/31.
Bullish technicals on daily chart remain supportive, as the pair is in fresh attempt above 0.7600. Close above 0.7588 Fibo barrier is needed to generate bullish signal for extension towards targets at 0.7650 (Fibo 76.4%) and 0.7679 (30 Mar high).The pair is on track for the second strong bullish weekly close.
Broken 100SMA marks strong support which is expected to remain intact and keep bulls in play.
Res: 0.7635; 0.7650; 0.7679; 0.7700
Sup: 0.7572; 0.7556; 0.7546; 0.7532
EURJPY – Extends Bullish Recovery
EURJPY - With the pair continuing to hold on to its corrective recovery, more strength is envisaged. On the downside, support comes in at the 124.00 level where a break if seen will aim at the 123.50 level. A cut through here will turn focus to the 123.00 level and possibly lower towards the 122.50 level. On the upside, resistance resides at the 125.00 level. Further out, we envisage a possible move towards the 125.50 level. Further out, resistance resides at the 126.00 level with a turn above here aiming at the 126.50 level. Its daily RSI is bullish and pointing higher suggesting more strength. On the whole, EURJPY faces further recovery threats.