
Sample Category Title
Trade Idea: EUR/JPY – Buy at 123.40
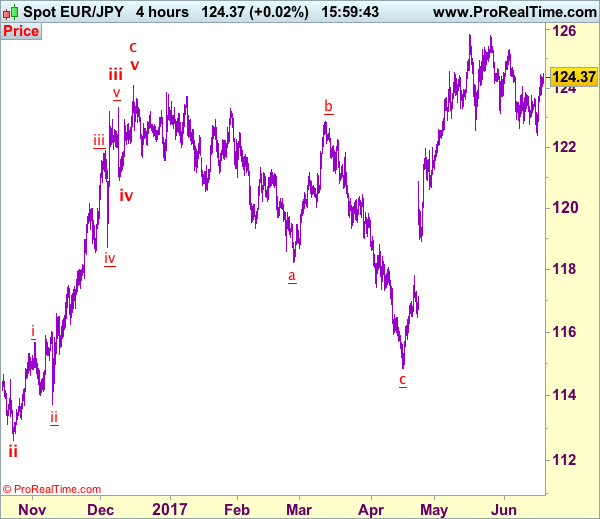
EUR/JPY - 124.36
Recent wave: wave v of (C) ended at 94.12 and major correction in wave A has ended at 149.79
Trend: Near term up
Original strategy:
Buy art 123.40, Target: 125.40, Stop: 122.80
Position: -
Target: -
Stop: -
New strategy :
Buy art 123.40, Target: 125.40, Stop: 122.80
Position: -
Target: -
Stop:-
Although the single currency edged higher after staging a strong rebound from 122.40 (last week’s low), loss of near term upward momentum should prevent sharp move beyond 124.70-75 and reckon 125.00 would hold on first testing, risk from there has increased for are retreat to take place soon. Looking ahead, only a break of resistance at 125.31 would retain bullishness and suggest the correction from 125.82 has ended, bring eventual retest of this level later this month.
In view of this, would not chase this rise here and we are looking to buy euro on dips as 123.40-50 should limit downside and bring another rebound later. Below 122.90-00 would defer and risk another fall to said support at 122.40 but only break there would signal the erratic decline from 125.82 top is still in progress for correction of early upmove to 122.00, then 121.70-75.
Our latest preferred count is that wave (ii) is ABC-X-ABC which ended at 123.33 and wave (iii) is unfolding with wave iii ended at 100.77, followed by wave iv at 111.57 and wave v as well as the wave (iii) has ended at 97.04, followed by wave (iv) at 111.43 and wave (v) has ended at 94.12 which is also the end of the larger degree v, this also implied the major wave (C) has also ended there, hence major correction has commenced from there with (A) leg unfolding in its lower degree wave c which has possibly ended at 145.69. Under this count, A-B-C wave (B) has commenced with A leg ended at 136.23, wave B at 143.79 and wave C has possibly ended at 149.79.
Our larger degree count is that the decline from 139.26 is wave (C) and is sub-divided into a diagonal triangle i-ii-iii-iv-v with wave i - 105.44, wave ii- 123.33, wave iii - 97.03, wave iv - 111.43, followed by the final wave v as well as the end of wave (C) at 94.12, this also mark the bottom of larger degree wave B. Under this count, major rise in wave C has commenced as an impulsive wave with minor wave III ended at 145.69, wave V is still in progress for further gain to 150.00. Having said that, this so-called wave V could well be the first leg of larger degree 5-waver wave C and this wave C should bring at least a retest of wave A top at 169.97 (July 2008).
Trade Idea: AUD/USD – Buy at 0.7525
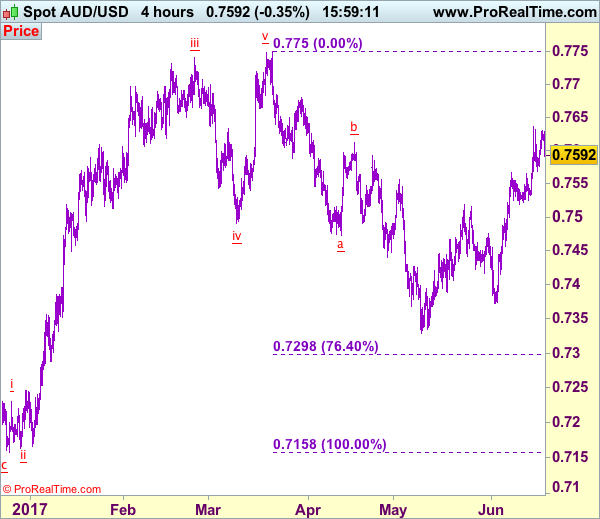
AUD/USD – 0.7592
Recent wave: Wave 5 ended at 1.1081 and major correction has commenced for fall to 0.7000 and then towards 0.6500-10
Trend: Near term up
Original strategy :
Buy at 0.7525, Target: 0.7670, Stop: 0.7465
Position: -
Target: -
Stop: -
New strategy :
Buy at 0.7525, Target: 0.7670, Stop: 0.7465
Position: -
Target: -
Stop:-
As aussie has retreated again after faltering below indicated resistance at 0.7636, retaining our view that consolidation below this level would be seen and pullback t0 0.7550-60 cannot be ruled out, however, reckon support at 0.7524 would limit downside and bring another rise later, above said resistance at 0.7636 would extend recent upmove from 0.7329 towards resistance at 0.7680 but loss of momentum should limit upside and price should falter below chart point at 0.7750.
In view of this, we are looking to buy aussie on dips as 0.7520-25 should limit downside and bring another rise. Only below support at 0.7457 would abort and suggest top is possibly formed, bring weakness to 0.7415-20 but price should stay well above key support at 0.7372, bring another rebound later.
On the 4-hour chart, the move from 0.8066 is the wave 5 with i: 0.8860, ii: 0.8315, wave iii is an extended move ended at 1.0183, iv: 0.9706 and wave v has ended at 1.1081 (also the top of entire wave 5). The subsequent selloff is the major correction which is unfolding as ABC-X-ABC and 2nd A leg has ended at 0.8848, followed by a-b-c wave B which ended at 0.9758, hence, 2nd C wave is now in progress and indicated downside target at 0.7000 and 0.6950 had been met, so further fall to 0.6710-20 cannot be ruled out.
Technical Outlook: Risk Of Fresh Easing While 20SMA Caps
The Euro extended recovery from last Friday in Asia but probes above 1.1200 barrier were so far limited.
Last Friday's rally formed bullish inside day pattern, suggesting corrective pullback from 1.1295 may be over. Rising 55SMA and 100/200SMA bull-cross formed on daily chart continue to under pin broader bulls.
On the other side, 10/20SMA bear-cross is forming at 1.1210 and along with daily Tenkan-sen, capping near-term recovery attempts from last week's correction low at 1.1132.
Mixed near-term technical studies and south-heading d e to under pin broader bulls. aily indicators see risk of extended consolidation within initial range of 1.1132/1.1210 on repeated close below 20SMA.
Stronger signals could be expected on break above 1.1210 (10/20SMA) which would re-expose key barrier at 1.1300, or slide below 1.1121/09 (Fibo 38.2% of 1.0839/1.1295 upleg/30 May low) which would risk deeper pullback. Very light calendar on Monday suggests the pair will be driven mainly by technicals.
Res: 1.1210, 1.1268, 1.1295, 1.1327
Sup: 1.1185, 1.1132, 1.1121, 1.1109
EUR/USD Candlesticks and Ichimoku Analysis
Weekly
• Last Candlesticks pattern: Shooting star
• Time of formation: 03 May 2016
• Trend bias: Down
Daily
• Last Candlesticks pattern: Shooting star
• Time of formation: 3 May 2016
• Trend bias: Sideways
EUR/USD – 1.1200
Although the single currency resumed recent upmove and rose briefly to 1.1296, lack of follow through buying on the break of previous resistance at 1.1285 and the subsequent retreat suggest a temporary top is possibly formed there and consolidation below this level would be seen, below last week’s low at 1.1132 would bring test of previous support at 1.1109 but a daily close below there is needed to add credence to this view, bring retracement of recent upmove to 1.1050, then test of previous resistance at 1.1025 (now support) but reckon downside would be limited to 1.0950-60 and price should stay well above support at 1.0839.
On the upside, whilst initial recovery to 1.1230-35 cannot be ruled out, reckon said resistance at 1.1296 would remain intact, bring retreat later. A break above said last week’s high would extend recent upmove from 1.0340 low to previous resistance at 1.1327, however, near term overbought condition should limit upside to previous chart resistance at 1.1366 and reckon 1.1440-50 would hold from here, risk from there is seen for a retreat later.
Recommendation: Take profit on our long entered at 1.1120 and stand aside
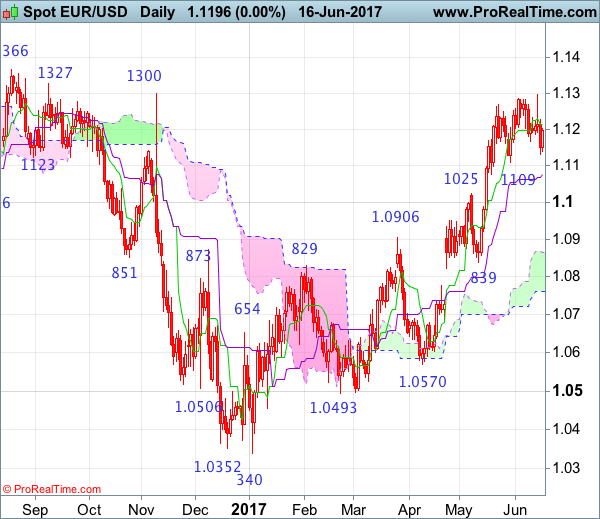
On the weekly chart, euro’s retreat after last week’s late rise to 1.1296 suggests consolidation below this level would be seen and pullback to 1.1109 support cannot be rued out, however, a weekly close below the Tenkan-Sen (now at 1.1059) is needed to suggest a temporary top is formed there, bring retracement of recent rise to the upper Kumo (now at 1.0984), then towards 1.0920-25, however, reckon downside would be limited to 1.0850-60 and previous support at 1.0839 would hold from here, bring rebound later.
On the upside, above said resistance at 1.1296-00 would signal the rise from 1.0340 low is still in progress and bring a test of previous resistance at 1.1366 but a break of this level is needed to signal early downtrend has ended at 1.0340, bring further subsequent rise to 1.1428, then towards 1.1500, having said that, price should falter well below another previous chart resistance at 1.1616.

USD/JPY Candlesticks and Ichimoku Analysis
Weekly
• Last Candlesticks pattern: Marubozu
• Time of formation: 14 Nov 2016
• Trend bias: Down
Daily
• Last Candlesticks pattern: Shooting star
• Time of formation: 15 Feb 2017
• Trend bias: Down
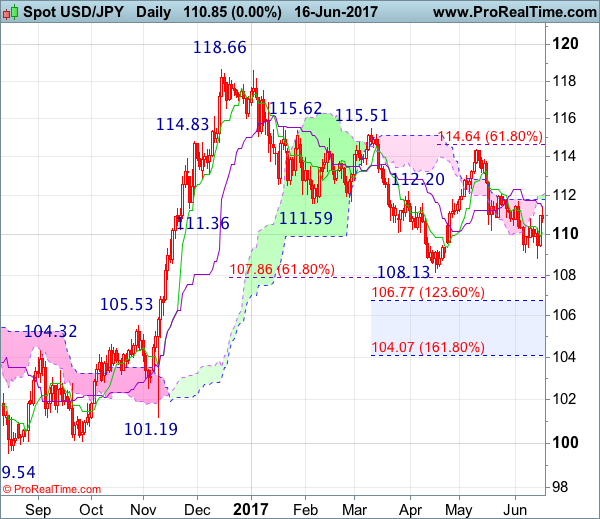
USD/JPY – 111.18
Although dollar fell briefly to 108.82, lack of follow through selling on break of previous support at 109.11 and the subsequent rebound suggest low has possibly been formed there and consolidation with mild upside bias is seen for gain to 111.60-65 (50% Fibonacci retracement of 114.39-108.82), however, reckon 112.25-30 (61.8% Fibonacci retracement) would hold from here, price should falter well below 113.00 and bring retreat later.
On the downside, whilst pullback to 110.65-70 is likely, reckon downside would be limited to the Tenkan-Sen (now at 110.12) and bring another rebound later. Only below said support at 108.82 would abort and signal the fall from 114.39 is still in progress and may extend weakness towards recent low at 108.13 which is likely to hold from here due to oversold condition, risk from there is seen for another rebound later.
Recommendation : Sell at 112.00 for 110.00 with stop above 113.00 or buy at 110.00 for 112.00 with stop below 109.00.
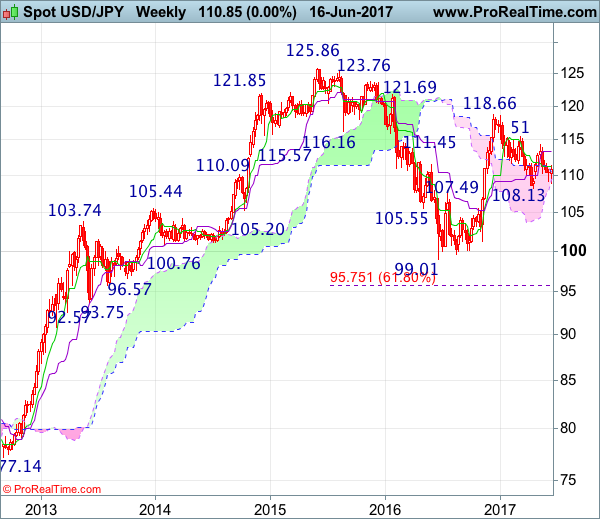
On the weekly chart, although dollar fell briefly to 108.82, as the greenback found good support there and staged a strong rebound, a white candlestick with a long lower shadow was formed, suggesting low has possibly been formed there and consolidation with upside b was is seen for test of 111.60-65 (current level of the Tenkan-Sen and 50% Fibonacci retracement of 114.39-108.82) cannot be ruled out, however, reckon upside would be limited to 112.25-30 (61.8% Fibonacci retracement), price should falter below the Kijun-Sen (now at 113.37), bring another decline later this week.
On the downside, expect pullback to be limited to 110.00-10 and bring another rise later. Below 109.85-90 would bring weakness to 109.25-30 but break there is needed to revive bearishness and signal the rebound from 108.82 has ended, bring retest of this level, break there would extend weakness to previous chart support at 108.13. Looking ahead, a drop below this level would signal the fall from 118.66 top has resumed and extend decline towards previous resistance at 107.49.
Brexit Negotiations To Keep The GBP Busy
The US dollar gave up some of the gains on Friday as investors booked profit after the markets digested the hawkish statement from the Fed. The FOMC's meeting last week saw the central bank raising the short term interest rates and also giving forward guidance to the markets about its intentions to unwind its massive balance sheet.
Economic data on Friday saw the building permits and housing starts numbers rising less than expected and slower than the previous month. The University of Michigan's consumer sentiment index also dipped from a revised 97.1 to 94.5, which added to the weakness.
Looking ahead, the lack of any clear economic data today will most likely see the markets trading flat. Fed speeches include FOMC member Dudley and Evans. Across the pond, the EU and the UK are scheduled to being the Brexit negotiations today which could add some volatility to the markets.
EURUSD intraday analysis
EURUSD (1.1194): EURUSD closed bearish yesterday with price action expected to continue to decline. The technical support level at 1.1171 was breached yesterday, and this suggests further downside in price. EURUSD could be expected to continue to slip towards 1.1018 - 1.0995 support level over the medium term. On the daily chart, there is potential for a short term retracement to occur. This could see EURUSD retesting 1.1171 price level where the broken support could turn to resistance in the near term. The bias shifts to the upside only on a close above this level.
GBPUSD intraday analysis
GBPUSD (1.2772): GBPUSD is seen trading below the 1.2800 resistance level. We can expect this price level to be tested in the near term, following which if it fails to breakout above this level, the bias shifts to the downside. The target at 1.2600 remains in place for GBPUSD, which could be tested in the near term. There is also a potential for price action to extend the declines down to 1.2400. On the 4-hour chart, we see the descending triangle pattern in place. This also coincides with the head and shoulders pattern from the daily chart, suggesting the downside in GBPUSD.
USDJPY intraday analysis
USDJPY (110.97): USDJPY closed with a doji pattern on Friday and a bearish close today could signal a reversal. If this happens, the reversal would occur below the resistance level of 111.61 and could keep USDJPY range bound within this resistance and support at 108.32. On the 4-hour chart, support is seen at 110.52. If we see a reversal at this level, then USDJPY will suggest near-term upside in price. This could send price testing the resistance level at 111.70. Alternately, failure to hold the declines at 110.52 will see USDJPY decline towards 109.50.
Euro Steady As Macron Set To Win Legislative Elections, Sterling In Focus As Brexit Talks Begin
The euro was supported by news that French President Emmanuel Macron won a majority in Sunday's legislative elections. Sterling was steady ahead of the start of Brexit talks in Brussels today.
In terms of economic data, Japan had a surprise trade deficit in May. The overall trade balance was -203.4 billion yen last month, missing the 76.0 billion yen surplus expected and was below the prior 481.7 billion yen surplus.
The yen weakened after the Japanese data. This helped the dollar bounce slightly to 111.19 yen, to recover some of Friday's losses on the back of disappointing US data that took the pair down to 110.63 yen. The dollar index traded to as low as 97.11 in Asia. Data on Friday showed US homebuilding declined for a third month in May to the lowest in eight months, while another report showed consumer sentiment in the US unexpectedly dropped in early June. The market's focus today will be on a speech by New York Fed President William Dudley who kicks off a busy week of Fed speeches.
The euro was steady against the dollar, not making any notable moves despite news that President Emmanuel Macron's Republic on the Move (REM) party is heading for a victory following the final round of the legislative elections in France that took place last Sunday. This should give him a powerful mandate to push through pro-business reforms, which is seen as positive for the euro. The single currency tested the key $1.1200 level and traded within a range in Asia, between $1.1188 and $1.1204.
Sterling traded in a range against the dollar during the Asian session, between $1.2758 and $1.2783. Investors are being cautious as the Brexit negotiations are due to being in Brussels today. The UK's Brexit Secretary David Davis will be meeting the EU's negotiator Michel Barnier. In the aftermath of the UK elections which resulted in Prime Minister Theresa May losing her majority government, it would be interesting to see if her hard Brexit stance will prevail or if the UK will aim for a soft Brexit.
In commodities, spot gold touched a 3-1/2-week low in the Asian session, reaching $1,249.65 an ounce. WTI oil futures lingered near six-week lows and continued to trade below $45 a barrel on concerns of a global supply glut.
GBPNZD Bearish In Descending Channel, Capped By 200-Day Moving Average
GBPNZD has been in a downtrend since the May 11 high of 1.8958 and prices have been falling in a descending channel to reach a low of 1.7438 last week.
Immediate support levels can be found at the June 14 low of 1.7438, followed by 1.7140 (March 1) and then at an important swing low at 1.6827.
A break above the 200-day moving average and a sustained move above the range high of 1.7766 (June 12) would target resistance provided by the base of the Ichimoku cloud at 1.8008.
The technical indicators are bearish, with oscillators like the RSI below 50 and MACD below zero. The market does not look like it can push any higher in the near term as prices are capped by the 200-day moving average at 1.7685.
Other technical studies are pointing to a bearish picture, as the market trades below the daily Ichimoku cloud. The tenkan-sen crossed below the kijun-sen line in May, giving a bearish signal and keeping the bias to the downside.
In the near-term, it appears prices are consolidating just below the 200-day moving average but the bias is skewed to the downside in the short-term. Looking at the bigger picture, there is no clear trend in the medium-term. Only a rise back above the cloud at 1.8580 would give a more bullish outlook.
Daily Technical Analysis: EURUSD, GBPUSD, USDJPY, USDCHF
EURUSD
The EURUSD was indecisive last week. The bias is neutral in nearest term. Overall I remain bullish, but need a clear break above 1.1285 to continue the bullish scenario targeting 1.1350 – 1.1425 region. Immediate support is seen around 1.1160, but key support remains at 1.1080 which is a good place to buy with a tight stop loss as a clear break below that area would continue the false breakout (above 1.1285) bearish pullback scenario, testing 1.0900 region and the major trend line support as you can see on my H4 chart below.
GBPUSD
The GBPUSD was indecisive last week. The bias is neutral in nearet term probably with a little bullish bias. The bullish pin bar on H4 chart still suggests a potential bullish scenario from here, but need a clear break above 1.2780 and the H4 EMA 200 (1.2820) to confirm the bullish scenario targeting 1.2900 – 1.3000/50 region. On the downside, only a clear break below 1.2635 would nullify the bullish bias testing 1.2500 region.
USDJPY
The USDJPY was indecisive last week. Price attempted to push lower, bottomed at 108.82 but whipsawed to the upside and closed higher at 110.85 and hit 111.13 earlier today in Asian session. The bearish scenario is no longer valid as price broke above the trend line resistance as you can see on my H4 chart below, but I am not bullish yet. The bias is bullish in nearest term testing 111.70 – 112.15. Immediate support is seen around 110.65/35. A clear break back below that area could lead price to neutral zone in nearest term but would give the bearish scenario another chance.
USDCHF
The USDCHF continued its bullish correction last week topped at 0.9770. The bias is bullish in nearest term testing 0.9815 key resistance which is a good place to sell with a tight stop loss targeting 0.9600 – 0.9550 area. Immediate support is seen around 0.9715. A clear break below that area could lead price to neutral zone in nearest term testing 0.9680/50 region. On the upside, a clear break and daily close above 0.9815 would end the bearish outlook testing 0.9900 area or higher.
What To Expect In The Week Ahead After The Fed & BoE Surprises?
Last week central bankers took many traders by surprise. It started with the Federal Reserve's monetary decision on Wednesday. The 25-basis points interest rate hike was fully priced in for several weeks nbut many market participants expected a dovish statement due to the softness in recent economic data. However, the statement was hawkish and Janet Yellen seemed to be confident in the path of economic growth. Similarly, for the BoE after the surprise election results the U.K. was left with a hung parliament and economic data sending warning signals. The expectation was for unanimous decision to keep rates unchanged but three out of the eight Monetary Policy Committee members voted for a rate increase. This indicates that policymakers are becoming more concerned about higher inflation though the economy is not moving in the right direction.
The dollar's reaction was mixed suggesting that investors are somewhat skeptical about the trajectory of the Fed's interest rates and the reduction of $4.2 trillion in Treasury bonds and mortgage-backed securities. The USD ended the week higher against JPY and EUR, lower against commodity currencies, and almost unchanged against GBP. The U.S. Treasury bonds also sent a similar message as yields declined across the curve. Investors have the right to be skeptical, especially after a series of weak economic data releases including retails sales, consumer prices, housing starts and consumer confidence. None of these reports justifies tighter monetary policy.
While only PMI surveys and home sales figures due to release from the U.S. the week ahead. The USD will likely take its cue from the Fed official talks. Six Fed members are scheduled to speak, including Lael Brainard, John Williams, Robert Kaplan, Patrick Harker, William Dudley, and Jerome Powell. If their tone seemed to be aligned with Janet Yellen then probably there's something the Fed knows which we don't and will be positive for the dollar. However, I think there's a high chance we'll get mixed messages thus making it hard to take a one-way bet on the greenback.
On the other side of the Atlantic, politics will be the key driver for the pound. While there's no tier one economic data on the U.K. calendar, official talks on the Brexit process will kick off on Monday and unfortunately May is not in a strong position as a hung parliament will make the negotiations more complicated. Although I believe the pound is fundamentally undervalued the currency may still face downside risks depending on how tough will be the EU stance.