Sample Category Title
GBP/JPY Daily Outlook
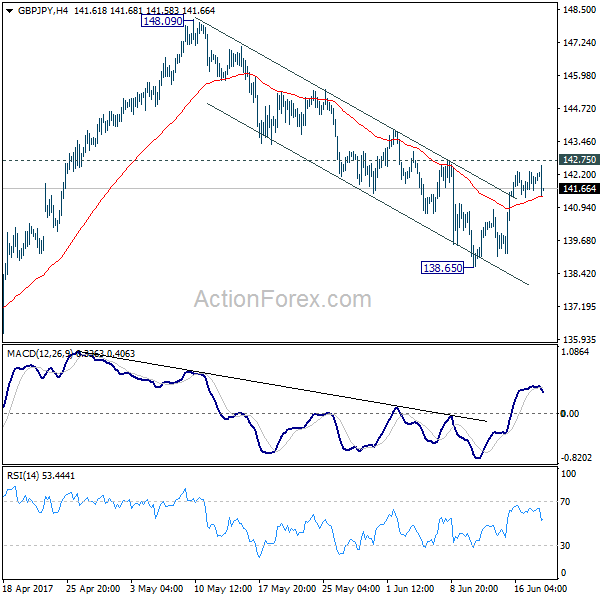
Daily Pivots: (S1) 141.46; (P) 141.89; (R1) 142.48; More....
GBP/JPY continues to stay in range below 142.75 resistance and intraday bias remains neutral first. We'd still prefer to see break of 142.75 to confirm near term reversal. In that case, intraday bias will be turned back to the upside for 148.09 resistance. On the downside, break of 138.65 will resume the decline from 148.09. But in that case, we'd look for bottoming signal around 135.58, which is close to 135.39 fibonacci level, to bring rebound.
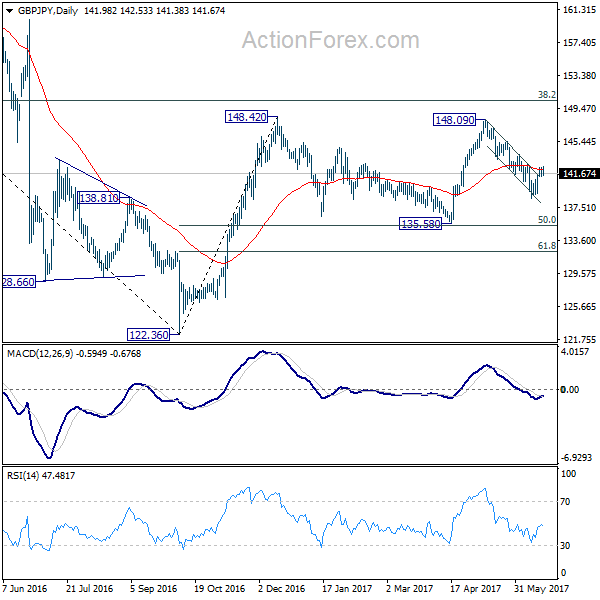
In the bigger picture, while the fall from 148.09 is deeper than expected, we're not bearish in the cross yet. Price action from 148.42 is possibly developing into a sideway pattern with fall from 148.09 as the third leg. Deeper decline could be seen but we're looking for strong support from 135.58 and 50% retracement of 122.36 to 148.42 at 135.39 to contain downside. Rise from 122.36 is still mildly in favor to resume at a later stage. However, sustained break of 135.58/39 will confirm reversal and target a retest on 122.36 low.
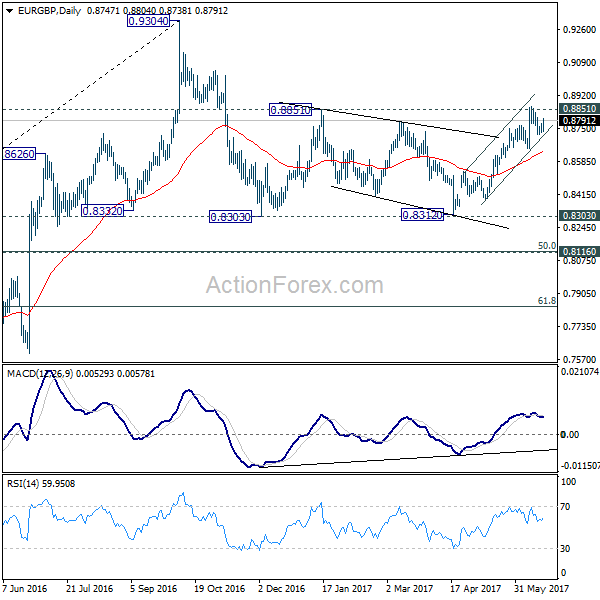
EUR/GBP Daily Outlook
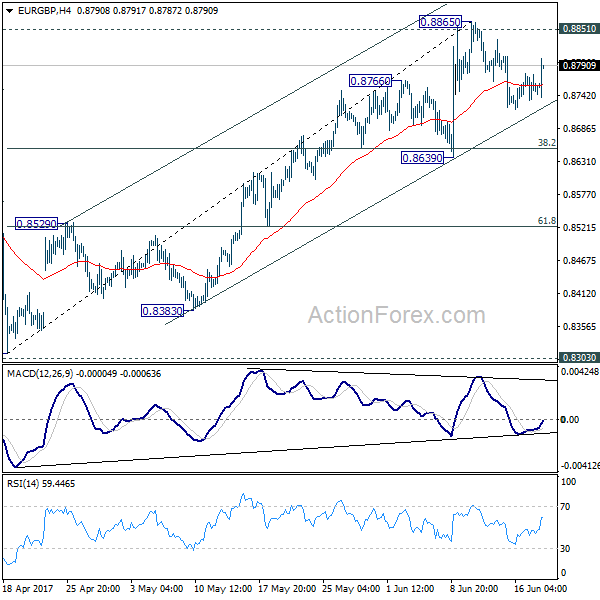
Daily Pivots: (S1) 0.8731; (P) 0.8755; (R1) 0.8775; More...
Intraday bias in EUR/GBP remains neutral at this point as consolidation from 0.8865 continues. In case of another fall, we'd expect strong support from 0.8639 to contain downside and bring rise resumption. Decisive break of 0.8851 resistance will pave the way to retest 0.9304 high. However, break of 0.8639 support will now indicate near term topping and bring deeper pull back 0.8529 resistance turned support and below.
In the bigger picture, price actions from 0.9304 are viewed as a medium term corrective pattern. The leg from 0.9304 should have completed after testing 0.8332 structural support. But it's too early to say that larger rise from 0.6935 is resuming. Rejection from 0.9304 will extend the consolidation with another falling leg. Meanwhile, firm break of 0.9304 will target 0.9799 (2008 high). In case of another decline, we'd expect strong support from 0.8116 cluster support (50% retracement of 0.6935 to 0.9304 at 0.8120) to contain downside and bring rebound.
Technical Outlook: AUDUSD – Current Wave C May Extend To Its FE 161.8% At 0.7677
The Aussie dollar climbed back above 0.7600 after overnight's dips were contained at 0.7585 (Monday's low / broken Fibo 61.8% of 0.7749/0.7328 descend). The pair maintains bullish bias with near-term action in consolidation mode on repeated failure at 0.7630 zone.
Technical studies on daily chart remain firmly bullish and supportive for further advance.
The price is currently riding on the third wave of five-wave pattern from 0.7328 (09 May low) which met its 138.2% Fibonacci expansion at 0.7634 and could travel to its FE 161.8% at 0.7677.
Bullish cross of 10/100SMA's underpins the action with rising 10SMA / Tenkan-sen at 0.7570/74, tracking the rally and expected to hold corrective dips.
Res: 0.7635, 0.7650, 0.7679, 0.7700
Sup: 0.7585, 0.7570, 0.7556, 0.7539
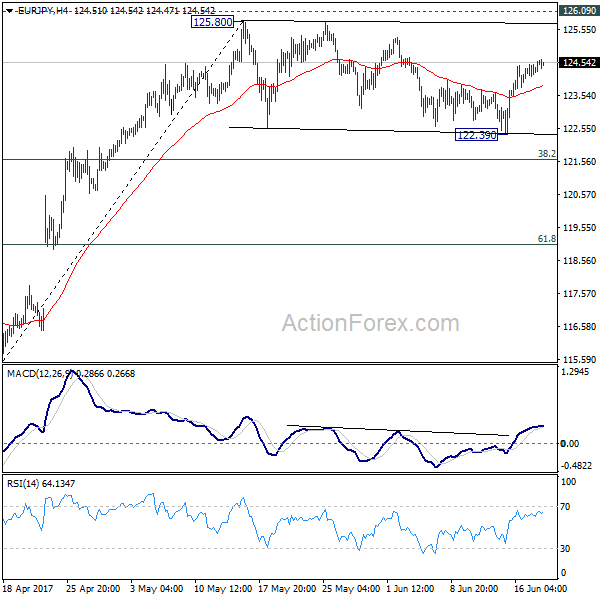
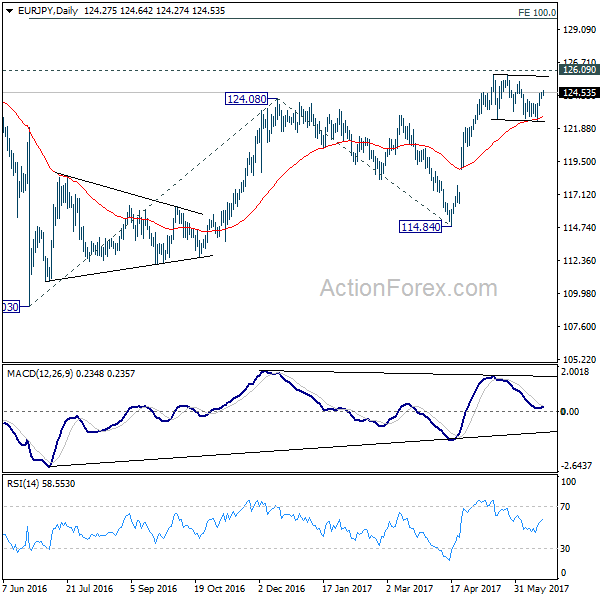
EUR/JPY Daily Outlook
Daily Pivots: (S1) 124.08; (P) 124.29; (R1) 124.52; More...
Intraday bias in EUR/JPY stays mildly on the upside for 125.80/126.09 resistance zone. Decisive break of 126.09 will extend the whole rebound from 109.03 to 100% projection of 109.03 to 124.08 from 114.84 at 129.89. In case of another fall as consolidation from 125.80 extends, we'd still expect strong support from 38.2% retracement of 114.84 to 125.80 at 121.61 to bring rebound and then rise resumption.
In the bigger picture, focus is staying on 126.09 support turned resistance. Decisive break there will confirm completion of the down trend from 149.76. And in such case, rise from 109.20 is at the same degree and should target 141.04 resistance and above. Meanwhile, rejection from 126.09 and break of 114.84 will extend the fall from 149.76 through 109.20 low.
Technical Outlook: USDJPY – Extended Rally Tests Daily Cloud Base
The pair extended strong rally from Monday and came ticks ahead strong barriers at 111.80/84 (daily cloud base / 100SMA) on Tuesday. The dollar was boosted by comments from Fed’s Dudley and Monday’s strong rally broke above pivotal barriers at 110.93 (Fibo 38.2% of 114.36/108.80 downleg) and 111.29 (daily Kijun-sen), ending day in long bullish candle and generating strong bullish signal.
Break above 111.80/84 barriers would extend rally towards next important resistances at 112.20/24 (daily cloud top / Fibo 61.8% of 114.36/108.80).
Bulls may take a breather before probing into cloud as strongly overbought slow stochastic on daily chart suggests correction.
Session low at 111.48 marks immediate support, followed by broken 30 SMA at 111.28 and broken 55SMA at 111.02 which is expected to contain extended dips.
Res: 111.84, 112.12, 112.24, 113.05
Sup: 111.48, 111.28, 111.02, 110.67
Fed’s Dudley Strikes A Hawkish Tone
The US dollar gained yesterday, following some hawkish remarks from New York Fed President William Dudley. The influential policymaker noted that even though inflation is lower than what the Fed would like, it is expected to pick up again, boosted by accelerating wages as the labor market continues to tighten. He added he is 'very confident' there is still a long way to go in this economic expansion. His comments echoed a similar message as Chair Yellen last week, that there's no reason for the Fed to pause with its hiking plans.
USD/JPY edged north yesterday on Dudley's hawkish remarks, after it hit support near the 110.80 (S2) zone to stop near the 111.70 (R1) obstacle, marked by the peak of the 2nd of June. Following the break above the downside resistance line taken from the peak of the 10th of May, the price structure suggests that the short-term outlook has turned positive. As such, even if we experience a setback due to profit taking on yesterday's up-leg, we expect the bulls to remain in the driver's seat. A clear break above 111.70 (R1) is possible to initially aim for our next resistance of 112.15 (R2).
Overall, what we consider most interesting is the growing divide within the Fed, between policymakers who are confident slowing inflation is transitory (Yellen, Dudley), and officials who have called for caution and a rebound in the data before acting again (Kashkari, Kaplan, Evans). The market seems to be on the side of caution as it continues to expect a pause before the next rate hike, which is fully priced in for June 2018. Considering that market pricing is already very pessimistic, we see the risks surrounding the dollar's future path as asymmetric. We think that any upside reaction in case of accelerating inflation is likely to be larger than the corresponding negative one in case of further slowdown in prices.
Today, we will hear from Fed Vice Chairman Fischer, who tends to be on the same page with Yellen and Dudley in his views. Should he echo similar comments that slowing inflation is transitory, USD could gain a bit further.
RBA minutes: No fireworks
Overnight, the minutes of the RBA's June policy meeting contained no surprises. Policymakers appeared slightly more upbeat on jobs, but they reiterated that developments in the labor and housing markets continue to warrant careful monitoring. Looking ahead, we think the Bank is likely to sound more optimistic when it meets again on the 4th of July, mainly because the latest jobs report that was released after the June gathering was stellar, which is likely to alleviate some of the RBA's labor market concerns.
AUD/USD slid yesterday ahead of the minutes after it found resistance slightly below the 0.7635 (R1) barrier and fell below the upside support line drawn from the low of the 2nd of June. The bulls' failure to aim for a higher high and the subsequent dip below the aforementioned upside line make us switch to flat for now with regards to the short-term picture. We prefer to wait for a decisive close above 0.7635 (R1) before we get confident on further advances again. On the downside, a break below the 0.7565 (S1) support will probably signal the completion of a double top formation and perhaps bring a short-term trend reversal.
Today's highlights:
The economic calendar is very light today. From Europe, we get Sweden's unemployment rate for May and Germany's PPI data for the same month. In the US, the current account balance for Q1 is due out. From New Zealand, we get the GDT (Global Dairy Trade) index, but no forecast is available. That said, the event that will probably keep NZD traders on the edge of their seats in the following days is the RBNZ policy meeting on Thursday.
We have six speakers on the agenda. In the US, besides Fischer, Dallas Fed President Robert Kaplan, and Boston Fed President Eric Rosengren speak as well. Elsewhere, we will get remarks from SNB Chair Thomas Jordan, ECB Executive Board member Benoit Coeure and BoE Governor Mark Carney. In light of last week's surprisingly hawkish BoE rate decision, we think Carney's comments will be closely followed for any hints as to whether a policy action is indeed as likely as the hawkish dissents would lead one to believe.
USD/JPY
Support: 111.40 (S1), 110.80 (S2), 110.30 (S3)
Resistance: 111.70 (R1), 112.15 (R2), 112.50 (R3)
AUD/USD
Support: 0.7565 (S1), 0.7515 (S2), 0.7500 (S3)
Resistance: 0.7635 (R1), 0.7675 (R2), 0.7700 (R3)
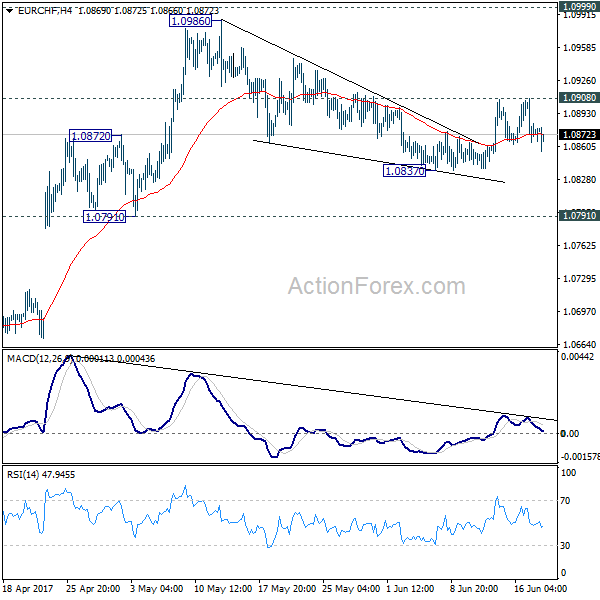
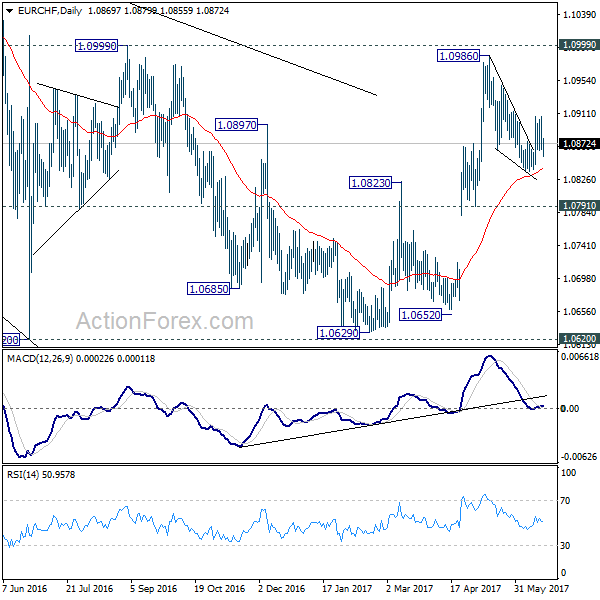
EUR/CHF Daily Outlook
Daily Pivots: (S1) 1.0857; (P) 1.0882; (R1) 1.0901; More...
In the bigger picture, the price actions from 1.1198 are seen as a corrective move. Such correction could have completed after defending 38.2% retracement of 0.9771 to 1.1198 at 1.0653. Decisive break of 1.0999 resistance will target a test on 1.1198 high. For now, this will be the preferred case as long as 1.0791 support holds.
USD Rises As Investor Concerns Abated
Investor concerns, that low US inflation could deter the Federal Reserve from raising interest rates further this year, were somewhat abated last night after New York Fed President William Dudley stated “that the tightening in the labour market should help drive up inflation”. Dudley’s comments reinforced last weeks Fed message and helped to give a boost to USD.
In early Asian trading USDJPY rose to 111.783 reaching its strongest level since May 26th which is nearly 2.8% above the 2 month low set on June 14th of 108.81. Currently USDJPY is trading at 111.60. Technical Analysis indicates key resistance levels just above 112.10 which may tempt market bulls to test.
Additional gains for USD against JPY may also arise following the comments made last week by the Bank of Japan Governor Kuroda; “the BOJ would be in no hurry to dial back its massive stimulus program”
USD strength saw the Dollar Index September Future trading as high as 97.29 in early trading – it’s highest level since May 30th – currently trading at 97.25 for the September Future.
Domestic politics and the UK’s economic future (the Brexit negotiations began yesterday) have caused downward pressure on GBP. After reaching a high on Monday of 1.2814 GBPUSD is trading below 1.2690 this morning. There may be some hope for GBPUSD to recover with speeches expected today form Bank of England Governor Mark Carney and British finance minister Philip Hammond.
Oil continues to be under selling pressure as there is clear evidence that crude oil production is rising in the US, Nigeria & Libya. These increases are undermining the efforts of OPEC to curb production. Add to that a 22nd consecutive month of increases in new US Oil rigs and it becomes less of a surprise to see WTI trading below $44.70 and Brent trading below $47.35 a barrel in early trading this morning – both close to 5 month lows.
As global risk sentiment has improved Gold has lost some of its shine hitting a 1 month low of $1,242.75 before retracing higher to currently trade close to $1,247.
GBP/USD Elliott Wave Analysis
GBP/USD – 1.2739
GBP/USD – Wave 4 is unfolding as an (A)-(B)-(C) and could have ended at 1.7192
Cable’s recovery after finding support at 1.2635 earlier this month suggests minor consolidation above this level would be seen, however, reckon upside would be limited to 1.2818 and price should falter below 1.2870-80, bring another decline later, a daily close below 1.2690 would bring test of 1.2635 support, a drop below there would add credence to our view that a temporary top has been formed at 1.3048 earlier, bring retracement of recent upmove to previous resistance at 1.2616 (tentatively wave i top), then 1.2550, having said that, reckon downside would be limited to 1.2500 and price should stay above 1.2440-50 due to near term oversold condition.
Our preferred count on the daily chart is that cable's rebound from 1.3500 (wave (A) trough) is unfolding as a wave (B) with A ended at 1.7043, followed by triangle wave B and wave C as well as wave (B) has possibly ended at 1.7192, below support at 1.4232 would add credence to this count, then further fall to 1.4000 level would follow but reckon downside would be limited to 1.3655 support and price should stay above previous support at 1.3500.
On the upside, expect recovery to be limited to 1.2818 minor resistance and bring another decline later. Above 1.2885-90 would suggest low is possibly formed, bring a stronger rebound towards resistance at 1.2978 which is likely to hold from here. Looking ahead, only a break above 1.2978 would signal the correction from 1.3048 top has ended, bring retest of tis level later. A break above there would extend recent upmove from 1.1986 low to 1.3140-50 (38.2% Fibonacci retracement of 1.5018-1.1986) and possibly 1.3200.
Recommendation: Hold short entered at 1.2800 for 1.2550 with stop above 1.2900.

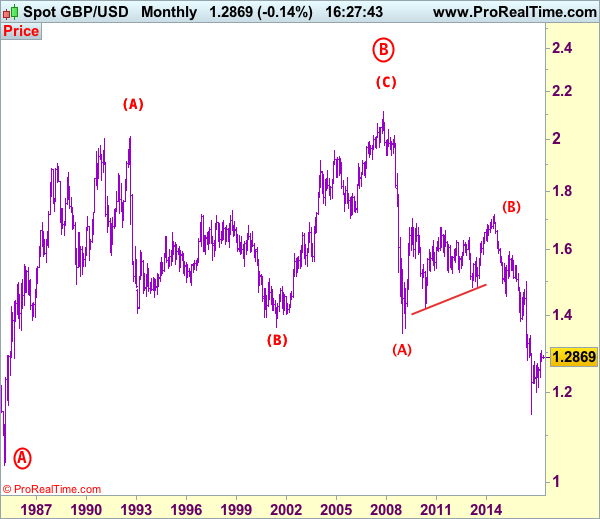
Longer term - Cable's rise from 1.0520 (Feb 1985) to 2.0100 (September 1992) is seen as [A], the decline to 1.3682 is labeled as (B) and (C) wave rally has ended at 2.1162 (9 Nov, 2007) which is also the top of larger degree wave B with circle. The selloff from there is a 5-waver with wave (A) ended at 1.3500 (23 Jan 2009), wave (B) itself is labeled as A: 1.6733, triangle wave B: 1.4813 and wave C as well as top of wave (B) ended at 1.7192 (2014), hence the selloff from there is an impulsive wave (C) with wave I : 1.4566, wave II 1.5930, an extended wave III is unfolding and already exceeded our downside target at 1.3500 and 1.3000, hence weakness to 1.2500 and possibly 1.2000 cannot be ruled out, however, price should stay well above psychological level at 1.0000.
GBPAUD Focus To The Downside, Testing 200-Day Moving Average
GBPAUD bias is to the downside after a break below the 50-day moving average and below the key psychological 1.7000 level on June 9.
Momentum oscillators are showing that the downside bias is gathering momentum. RSI is trending down and is below 50 in bearish territory, while MACD is also showing bearishness as it is below zero and falling.
Prices are currently testing the 200-day moving average at 1.6654. It is expected to provide support but a daily close below it would bring about more weakness in the market and accelerate a further decline. Next support would come into view at 1.6240 before 1.5902 (March 16 low).
To the upside, major resistance is provided by the psychological 1.7000 level. A break above this opens the way towards 1.7200 and 1.7500.From here, we could see a re-test of the high at 1.7650. This would bring about a bullish bias and a resumption of the uptrend from 1.5902.
As long as the market can stay above the 200-day moving average, the uptrend that took place from 1.5902 to 1.7650 will likely remain intact. But the short-term bias is to the downside. Looking at the bigger picture, the pair has a neutral outlook.