Sample Category Title
CAC Posts Gains as Fed Continues Hawkish Message
The CAC index has posted gains in the Tuesday session. The index has gained 0.37% and is currently trading at 5330.57 points. On the release front, the Eurozone's current account surplus dropped sharply to EUR 22.2 billion, well below the estimate of EUR 31.3 billion. This was the lowest surplus since July 2016.
The Federal Reserve issued a hawkish rate statement at last week's meeting, and the Federal Reserve of New York President Charles Dudley continued the upbeat message on Tuesday. Dudley cautioned the Fed against halting its current tightening cycle. Dudley said that he was not concerned with inflation levels, which are at 1.5 percent. Dudley's upbeat remarks have sent global stock markets higher. If other FOMC members also wax positive about the economy, the odds of a December (or even September) rate hike could increase.
France's long election season is finally over, after the second round of parliamentary elections on Sunday. President Emmanuel Macron's En Marche easily won a majority of seats in the National Assembly, garnering about 61% of the vote. This was somewhat lower than recent polls, which had predicted that Macron would win as much as 80% of the seats in parliament. Still, it's an impressive victory for the young and charismatic Macron, whose party is barely a year old. Macron ran on a pro-business agenda, promising to relax regulations and reform labor laws in order to make the French economy more competitive, but France's powerful trade unions are sure to push back against any legislation that will take away rights or benefits from workers. The unions have not shied away from going on strike or organizing mass protests in past conflicts with the government, so Macron will be hard-pressed to implement reforms while keeping peace on the labor front.
One year after the Brexit referendum, which stunned Britain and the European Union, the two sides formally commenced negotiations on Monday in Brussels. The first day was primarily a photo-shoot opportunity, and the sides were on their best behavior. The parties published a concise Terms of Reference for the negotiations, which provided an outline of the talks as set by the Europeans. The paper pointedly did not mention trade talks, but rather listed the initial issues that will be discussed: 1) legal status of EU citizens in the UK; (2) Northern Ireland/Ireland border; and (3) financial obligations of the UK to the EU. With Prime Minister May trying to cobble together a minority government, her position is much weaker than before the disastrous election, and the British position has become more flexible. Philip Hammond, the British finance minister, has said that he wants a business-friendly and pragmatic Brexit and that no deal would be bad for the UK. Hammond did, however, warn the Europeans not to craft an agreement that punished the UK for leaving the club. The negotiations are expected to resume on July 10, when the parties will delve into substantial issues.
GBPJPY Fell Back Below Daily Cloud
The cross fell back below daily cloud on Tuesday after dovish comments from BoE's Carney. Penetration into daily cloud (spanned between 141.85 and 144.07) and probe above 142.27 (Fibo 38.2% of 148.28/138.66 downleg) was short-lived and generated initial signal of stall.
Thick daily cloud weighs on the pair, along with bearishly aligned technical studies (20/55 SMA bear cross was formed at 142.18 yesterday) and uncertainty at the beginning of Brexit talks.
Fresh bearish acceleration through 100SMA (141.23) and 10SMA/Fibo 38.2% of 138.66/142.54 upleg (141.06) further weakens near-term structure, with daily Tenkan-sen (140.71) coming under increased pressure.
Daily close below 141.06 will be seen as strong bearish signal, while firm break below Tenkan-sen would generate initial signal of an end of corrective phase from 138.66.
Res: 141.23; 141.48; 141.85; 142.27
Sup: 140.71; 140.34; 140.14; 139.58
EUR/USD Mid-Day Outlook
Daily Pivots: (S1) 1.1122; (P) 1.1167 (R1) 1.1192; More....
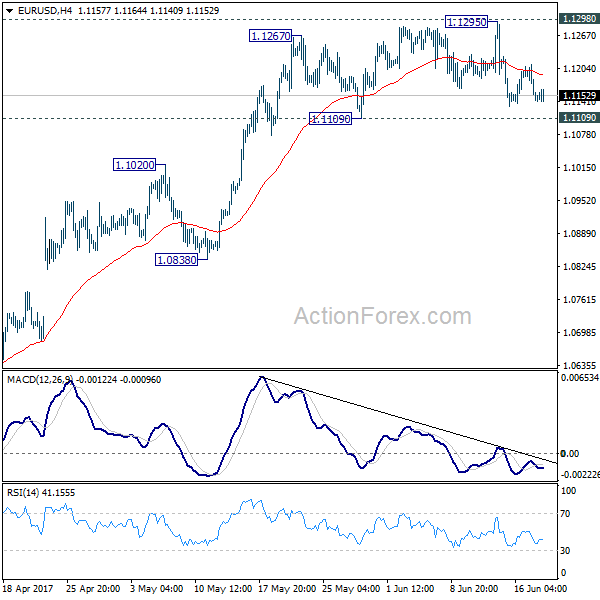
EUR/USD is still staying in range of 1.1109/1295 and intraday bias remains neutral. Focus stays on 1.1298 key resistance. Decisive break there will carry larger bullish implication and target 1.1615 resistance next. On the downside, break of 1.1109 support will indicate short term topping and rejection from 1.1298. In such case, intraday bias will be turned to the downside for 1.0838 support.
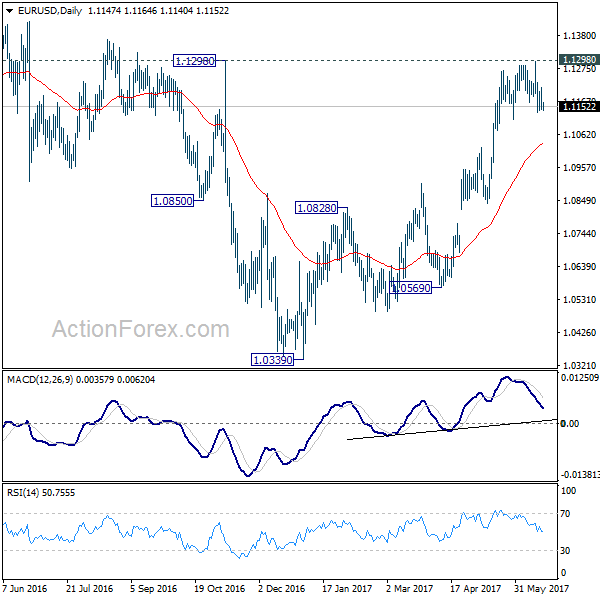
In the bigger picture, the case for medium term reversal continues to build up with EUR/USD staying far above 55 week EMA (now at 1.0932). Also, bullish convergence condition is seen in weekly MACD. Focus will now be on 1.1298 key resistance. Rejection from there will maintain medium term bearishness and would extend the whole down trend from 1.6039 (2008 high). However, firm break of 1.1298 will indicate reversal. In such case, further rally would be seen back to 1.2042 support turned resistance next.
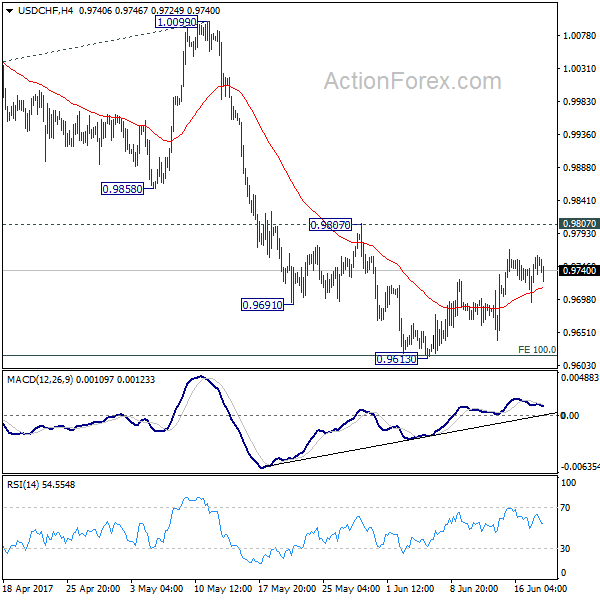
USD/CHF Mid-Day Outlook
Daily Pivots: (S1) 0.9714; (P) 0.9737; (R1) 0.9778; More.....
USD/CHF is staying in consolidation above 0.9613 and intraday bias remains neutral at this point. As long as 0.9807 resistance holds, near term outlook remains bearish and deeper fall is expected. Below 0.9613 will extend the whole decline from 1.0342 to 0.9548 support and below. We'd start to look for bottoming signal again as it approaches 0.9443 key support level. However, considering bullish convergence condition in 4 hour MACD, break of 0.9807 will indicate near term reversal and turn outlook bullish for 1.0099 resistance next.
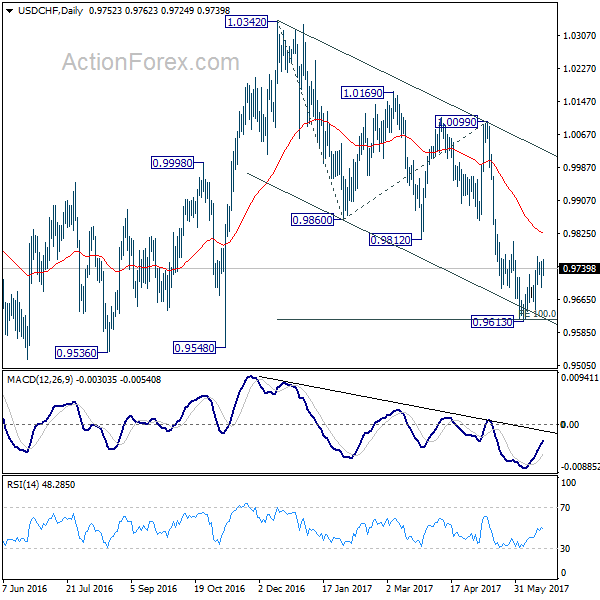
In the bigger picture, USD/CHF is still bounded in medium term range of 0.9443/1.0342 for the moment. Consolidative trading would likely continue and medium term outlook remains neutral. Break of 1.0342 key resistance is needed to confirm underlying bullish momentum in the pair. Meanwhile, downside attempts should be contained by 0.9443 key support level. However, sustained break of 0.9443 will carry larger bearish implication and target 0.9 handle.
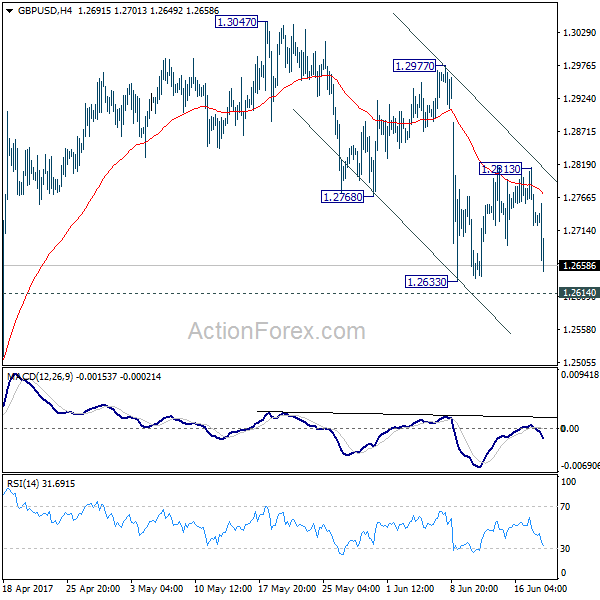
GBP/USD Mid-Day Outlook
Daily Pivots: (S1) 1.2700; (P) 1.2757; (R1) 1.2792; More...
GBP/USD's fall accelerates today but for the moment, it's still staying above 1.2614/33 support zone. Intraday bias stays neutral at this point. overall, we're still favoring the bearish case. That is, consolidation pattern from 1.1946 has completed at 1.3047 already. Break of 1.2614 resistance turned support should confirm our bearish view and target a test on 1.1946 low next. However, break of 1.2813 resistance will dampen our view and turn bias back to the upside for 1.3047 and above.
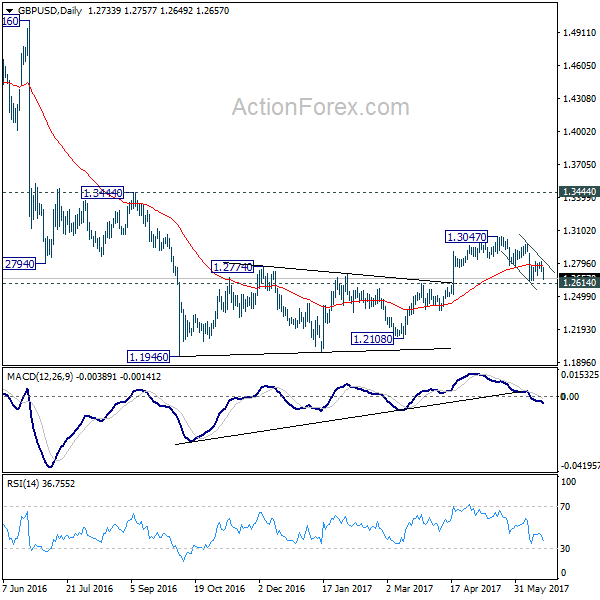
In the bigger picture, fall from 1.7190 is seen as part of the down trend from 2.1161. Price actions from 1.1946 medium term low are seen as a consolidation pattern, which could have completed after hitting 55 week EMA. Break of 1.1946 low will target 61.8% projection of 1.5016 to 1.1946 from 1.3047 at 1.1150 next. In case the consolidation from 1.1946 extends, outlook will stay remain bearish as long as 1.3444 resistance holds.
Sterling Dives as BoE Carney Said No to Rate Hike
Sterling dives broadly today after BoE Governor Mark Carney tried to talk down rate hike expectations and said it's not the time yet. Meanwhile, Canadian dollar was also pressured as WTI crude oil tumbles through 43.76 support to as low as 42.93, hitting the lowest level since November. The Japanese Yen rebounds as risk appetite recedes. Meanwhile, Dollar and Euro are trading mixed. Technically, key focuses in US session will be on whether GBP/USD would take out 1.2633 support, and whether EUR/GBP would take out 0.8865 resistance.
BoE Carney: "Now is not yet the time"
BoE Governor Mark Carney said in his Mansion House speech that "now is not yet the time to begin that adjustment" of monetary policies. He added that "different members of the MPC will understandably have different views about the outlook and therefore on the potential timing of any Bank Rate increase. But all expect that any changes would be limited in scope and gradual in pace." For him, he would like to see "the extent to which weaker consumption growth is offset by other components of demand, whether wages begin to firm, and more generally, how the economy reacts to the prospect of tighter financial conditions and the reality of Brexit negotiations."
Talking about Brexit, Chancellor of Exchequer Philip Hammond said in the Mansion House speech and urged to ensure a "smooth pathway to a deep and special future partnership with our EU neighbors". And he emphasized a way that "protects jobs, prosperity, and living standards in Britain will require every ounce of skill and diplomacy." And, the government must avoid "unnecessary disruption and dangerous cliff edges."
SNB Jordan: Stimulus exit will be difficult, bumpy
SNB Chairman Thomas Jordan said in a conference that exit from the current monetary stimulus will be "difficult" and "may be a bumpy road". But, by then, "it is also positive that we are at the point where we can talk about normalization." For now, negative interest rates and currency market intervention help keep the Swiss Franc on track. The Swiss State Secretariat for Economic Affairs cut the country's GDP forecast for 2017 to 1.4%, down from 1.6%. For 2018, growth projection was held unchanged at 1.9%. SECO kept 2017 inflation projection unchanged at 0.5%. However, for 2018, inflation forecast was lowered to 0.2%, down from 0.3%.
RBA minutes added nothing new
RBA minutes showed that the central bank was confident that growth will pick up again the the weak Q1. Nonetheless, the board cautioned the developments in labor and housing markets and said they "warranted careful monitoring". In particular, the minutes said that "members observed that low growth in incomes, along with high levels of household debt, appeared to have been constraining growth in household consumption." Overall, the minutes added little to what Governor Philip Lowe said yesterday. Lowe painted an optimistic picture and said that growth over the next couple of years will be "a bit stronger than it has been recently".
On the data front
US current account deficit widened to USD -116.8b in Q1. Canada wholesale sales rose 1.0% mom in April. Eurozone current account surplus narrowed to EUR 22.2b in April. German PPI dropped -0.2% mom, rose 2.8% yoy in May. Australia house price index rose 2.2% qoq in Q1.
GBP/USD Mid-Day Outlook
Daily Pivots: (S1) 1.2700; (P) 1.2757; (R1) 1.2792; More...
GBP/USD's fall accelerates today but for the moment, it's still staying above 1.2614/33 support zone. Intraday bias stays neutral at this point. overall, we're still favoring the bearish case. That is, consolidation pattern from 1.1946 has completed at 1.3047 already. Break of 1.2614 resistance turned support should confirm our bearish view and target a test on 1.1946 low next. However, break of 1.2813 resistance will dampen our view and turn bias back to the upside for 1.3047 and above.
In the bigger picture, fall from 1.7190 is seen as part of the down trend from 2.1161. Price actions from 1.1946 medium term low are seen as a consolidation pattern, which could have completed after hitting 55 week EMA. Break of 1.1946 low will target 61.8% projection of 1.5016 to 1.1946 from 1.3047 at 1.1150 next. In case the consolidation from 1.1946 extends, outlook will stay remain bearish as long as 1.3444 resistance holds.
Economic Indicators Update
| GMT | Ccy | Events | Actual | Forecast | Previous | Revised |
|---|---|---|---|---|---|---|
| 01:30 | AUD | House Price Index Q/Q Q1 | 2.20% | 2.20% | 4.10% | |
| 01:30 | AUD | RBA Meeting Minutes | ||||
| 06:00 | EUR | German PPI M/M May | -0.20% | -0.10% | 0.40% | |
| 06:00 | EUR | German PPI Y/Y May | 2.80% | 2.90% | 3.40% | |
| 08:00 | EUR | Eurozone Current Account (EUR) Apr | 22.2B | 31.3B | 34.1B | 35.7B |
| 12:30 | CAD | Wholesale Sales M/M Apr | 1.00% | 0.50% | 0.90% | 1.20% |
| 12:30 | USD | Current Account (USD) Q1 | -116.8B | -124B | -112B | -114.0B |
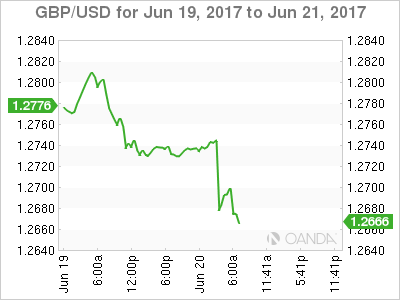
Mark Carney Says ‘No’ To BoE Hawks
Sterling was in trouble during Tuesday’s trading session with prices tumbling to a weekly low at 1.2668 after Mark Carney suggested that interest rates should be kept on hold amid Brexit uncertainty. It is becoming clear that the rising fears of Brexit negotiations negatively impacting economic growth continues to weigh heavily on sentiment while prolonged periods of uncertainty has ensured Pound weakness remains a recurrent theme. With both consumer spending and business investments dishing out mixed signals,and tepid wage growth still a cause for concern, 'now is not yet the time to raise interest rates' according to Mark Carney.
While last week’s unexpected hawkish rebellion at June’s BoE meeting supported expectations of the central bank taking action, the ongoing Brexit woes coupled with political instability in Westminster should encourage the Bank of England to 'stand pat' moving forward. Although raising interest rates may curb inflation, it could end up punishing borrowers, consequently sapping business confidence and hitting consumers further.
EU secures first victory on Brexit timetable
Sterling bears were back in actionon Monday after the first round of the formal Brexit negotiations concluded with Britain backing down and accepting the European Union’s timetable for Brexit. With the European Union already leading the way and making demands in the early stages of talks, it does raise questions over who is really in charge. The Pound may turn extremely sensitive as the talks get under way with any signs of complications likely exposing the currency to further downside.
From a technical standpoint, the GBPUSD is coming under increasing pressure on the daily charts. Ongoing weakness below 1.2775 should offer sellers enough inspiration to send prices towards 1.2600.
Equity bulls are back in town
Financial markets have roared back to life after a solid rebound in technology stocks and optimism over French President Emmanuel Macron’s extraordinary electoral victory boosted risk sentiment. European stock markets ventured into the green territory on Monday while US equities concluded at record highs amid the renewed appetite for risk.
Although Asian indexes were mostly mixed during early trading on Tuesday, equity bulls could receive enough inspiration to elevate Asian markets higher if MSCI decides to include China A-shares in its globally tracked Emerging Market Index. An acceptance by MSCI would be highly beneficial for the second largest economy in the world and may mark a crucial step for Beijing as it embarks on opening its financial markets in a bidto attractforeign investment.
Dollar boosted by Fed hawks
Dollar bullish investors were injected with inspiration on Monday following hawkish comments from New York Federal Reserve Bank President William Dudley thatsupported expectations of the Federal Reserve raising rates further this year. Although Dudley displayed optimism over the health of the US economy, I feel the macro-fundamentals from the States need to display ongoing signs of stability before investors adopt a similar school of thought. With the data calender relatively light this week, the Greenback could edge higher if other Fed officials share similar hawkish viewsto Dudley.
From a technical standpoint, the Dollar Index has found some ground on the daily charts. A breakout above the 97.75 lower high should encourage a further incline towards 98.00.
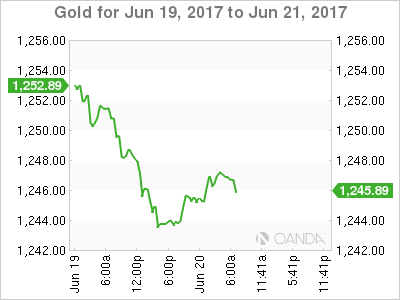
Commodity spotlight – Gold
Gold was exposed to heavy losses on Monday with prices descending towards $1240 as the Dollar appreciated. The downside was complimented by hawkish comments from a top Federal Reserve official which boosted hopes of the Fed raising US rates again this year. Although the ongoing uncertainty over Brexit talks and political uncertainty in the US may support the commodity in the medium to longer term, short term bears still remain in control below $1260. From a technical standpoint, Gold is pressured on the daily charts with bears eyeing $1240.
Technical Outlook: WTI Oil Hits New Multi-Month Low On Fresh Bearish Acceleration
WTI oil fell to $43.37 on Tuesday, hitting fresh multi-month low. Fresh acceleration lower came after narrow consolidation and upside attempts being limited at $45.00 by daily Tenkan-sen in steep descend. Bears surged through target at $43.74 (05 May spike low), signaling extension of larger bear-leg from $51.98 (25 May high). Oil price remains under strong pressure on fears on global oversupply which undermines efforts from OPEC to support oil prices by reducing oil production for extended period. Renewed pressure comes after OPEC supplies jumped in May as output recovered in Libya and Nigeria. Strong bearish sentiment in the markets continues to drive oil prices lower, with close below $43.74 handle to generate another strong bearish signal for extension towards $42.98 (Fibo 76.4% of $39.20/$55.22 (Aug 16/Jan 17) bull phase and $42.19 (14 Nov low). Strongly oversold daily studies have so far been ignored, however, corrective action could be anticipated in the near-term.
Res: 43.74, 44.07, 44.67, 45.03
Sup: 43.37, 43.06, 42.98, 42.19
Fed Talk Gives Dollar A Boost
Despite the lack of economic fundamentals to use as a direction, the 'mighty' U.S dollar remains better bid as investors look ahead to another week of public appearances by Fed officials.
For most of Q2, the dollar has been underperforming on market doubts that the Fed would be hiking U.S rates again this year. Despite weaker U.S fundamentals of late, investors should expect Fed talk to continue to support the greenback in the short-term.
Yesterday, New York Fed President Dudley said that he was 'very confident' that there is 'quite a long ways to go' in the economic expansion. Last night, Chicago Fed President Evans said, 'the current environment supports very gradual rate hikes.'
Current Fed-fund futures are showing that the odds for another rate increase from the Fed this year stands at around +47%, the probability was around +41% on Friday.
Boston's Fed Eric Rosengren and Fed Vice-Chair Stanley Fischer speak today, while Fed governor Jerome Powell and St. Louis Fed chief James Bullard are due later in the week.
1. Stocks print record highs
Stateside yesterday, the equity markets regained steam with the tech sector leading the way. Both the Dow and S&P reached new all-time highs with closes at 21,528 and 2,453 respectively.
In Japan, the Nikkei (+0.8%) and broader Topix (+0.7%) both jumped to a two-year high overnight, powered by the record highs on Wall Street, a weaker yen and hopes for the global economy.
Down-under, Australia's S&P/ASX 200 Index slipped -0.8% – the country's largest banks weighing on the index following yesterday's ratings downgrades from Moody's Investors Service.
In Hong Kong, the Hang Seng Index fell -0.3% and the Shanghai Composite Index dropped -0.1% as excitement over the city's plans for a new listing board for 'new economy' companies waned.
Note: MSCI will announce today whether it will approve Chinese-listed stocks in its global benchmarks. The +$6.8T 'onshore' market is the world's second largest and accounts for +9% of global stock value – the decision is expected after the bell.
In Europe, indices are trading largely higher across the board seeing follow through from the strong showing in the U.S yesterday. The FTSE futures got a boost this morning following BoE Carney comments (see below).
U.S stocks are set to open in the 'black' (+0.1%).
Indices: Stoxx 600 +0.2% at 393, FTSE +0.3% at 7545, DAX +0.4% at 12934, CAC-40 +0.5% at 5334, IBEX-35 +0.1% at 10855, FTSE MIB +0.3% at 21070, SMI +0.4% at 9063, S&P 500 Futures +0.1%.
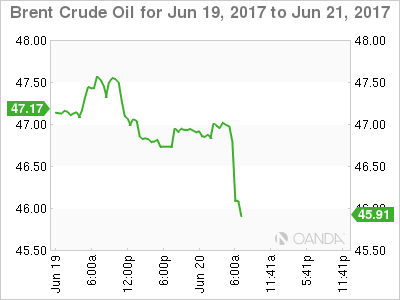
2. Oil prices near seven-month lows on global oversupply
Oil prices trade atop of their seven month lows, weighed down by an expansion in U.S drilling that has helped to maintain high global supplies despite OPEC's initiative to tighten the market by cutting production.
Also, signs of faltering demand are also weakening global sentiment.
Brent crude futures are up +15c at +$47.06 per barrel, while U.S West Texas Intermediate (WTI) crude futures are up +16c at +$44.35 per barrel.
Note: Prices for both benchmarks are down -14% since late May, when OPEC formally extended its pledge to cut output by -1.8m bpd for an extra nine months.
Data out Friday afternoon in the U.S showed another week of rising active U.S oil-drilling rigs, bringing the count to +747, the most since April 2015.
Even at such low price levels, questions on the U.S 'shale's' ability to keep profitable are being asked.
Data also shows that supplies from OPEC also jumped last month, driven by recovering output from Libya and Nigeria, which were exempt from cuts due to unrest that had hindered their output.
Ahead of the U.S open, gold has inched higher (up +0.3% at +$1,246.82 per ounce), supported by global political uncertainties – risk aversion due to Brexit, concerns over U.S President Trump's ability to carry out financial reforms, election results in Europe and Middle East turmoil have provided some support for the precious metal.
3. Global yields range trade
Government bond yields, especially in Germany and the U.S, have been range-bound ever since last November and there is nothing to suggest that this trend will change anytime soon.
With the Fed and the ECB having already made key decisions, they now appear to be waiting for inflation pressures before becoming more 'hawkish.'
U.S 10-year notes have traded between +2.12% and +2.60% since Trump's U.S Presidential win, while German 10-year yields have traded between +0.15% and +0.5% and U.K. gilts have fluctuated between +1% and +1.5% over the period.
Overnight, the yield on 10-year Treasuries has fallen -1 bps to +2.18%, after rising +4 bps yesterday, while benchmark yields in the U.K fell -3 bps to +1.01% on BoE comments (see below).
4. The pound walloped on Carney talk
Ahead of the U.S open, sterling (£1.2683) is under pressure after Bank of England Governor Carney suggested weak wage growth meant it was too early to raise interest rates.
During a rescheduled Mansion House speech this morning, Carney said 'anaemic' wage growth raised questions about the strength of domestic inflationary pressures, while he was unsure how the economy would respond to talks between the U.K and the E.U on Brexit terms.
The comments come after last week's BoE minutes unexpectedly showed three out of eight policymakers voted to raise rates due to high inflation.
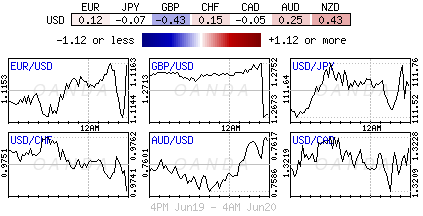
Elsewhere, overall price action sees the USD steady across the board, aided by recent 'hawkish' Fed commentary and rising U.S bond yields. USD/JPY (¥111.54) trades atop of its three-week high, while the EUR (€1.1157) is little changed near yesterday's outright lows.

5. RBA meeting minutes reinforce neutral stance
Minutes of the RBA's June 6 policy meeting, which resulted in interest rates being left unchanged at a record low +1.5%, indicated the board expected data to show the domestic economy to slow in Q1.
The economy grew by just +1.7% y/y in Q1, with some of the weakness attributable to a cyclone in Queensland, which inhibited coal exports.
The RBA noted improvement in global economic conditions and sustained property construction investment in China. Their main focus in coming months will remain trends in employment and also the housing market.
Note: Recent data on both fronts showed unemployment falling to a four-year low, while soaring house price growth has showed signs of cooling in some markets.
The minutes were consistent with upbeat comments from RBA's Governor Lowe on Monday, but did not have much effect on AUD (A$0.7625) because the RBA has been optimistic for some time.
GOLD Monitoring Uptrend Channel, SILVER Selling Pressures Continues, CRUDE OIL Testing Support Given At $43.76.
GOLD Monitoring uptrend channel.
Gold is now monitoring the lower bound of the uptrend channel. Hourly support is located at 1249 (intraday low). Stronger support is given at 1214 (09/05/2017 low). Expected to show renewed upside pressures.
In the long-term, the technical structure suggests that there is a growing upside momentum. A break of 1392 (17/03/2014) is necessary ton confirm it, A major support can be found at 1045 (05/02/2010 low).
SILVER Selling pressures continues.
Silver declines. Closest support is given at 16.44 (18/05/2017 low). Strong support is given at 16.06 (09/05/2017 low). Key resistance is given at a distance at 19.00 (09/11/2017 high). The road seems wide open for further decline.
In the long-term, the death cross indicates that further downsides are very likely. Resistance is located at 25.11 (28/08/2013 high). Strong support can be found at 11.75 (20/04/2009).
CRUDE OIL Testing support given at $43.76.
Crude oil is finally continuing its decline since the recent collapse from $52. Support is given at a distance 43.76 (05/05/2017 low). Expected to show further decline.
In the long-term, crude oil has recovered after its sharp decline last year. However, we consider that further weakness are very likely. Strong support lies at 24.82 (13/11/2002) while resistance can now be found at 55.24 (03/01/2017 high).