

Sample Category Title
Daily Technical Outlook And Review: EUR/USD, GBP/USD, AUD/USD, USD/JPY, USD/CAD, USD/CHF, DOW 30, GOLD
A note on lower timeframe confirming price action...
Waiting for lower timeframe confirmation is our main tool to confirm strength within higher timeframe zones, and has really been the key to our trading success. It takes a little time to understand the subtle nuances, however, as each trade is never the same, but once you master the rhythm so to speak, you will be saved from countless unnecessary losing trades. The following is a list of what we look for:
- A break/retest of supply or demand dependent on which way you're trading.
- A trendline break/retest.
- Buying/selling tails ... essentially we look for a cluster of very obvious spikes off of lower timeframe support and resistance levels within the higher timeframe zone.
- Candlestick patterns. We tend to only stick with pin bars and engulfing bars as these have proven to be the most effective.
We typically search for lower-timeframe confirmation between the M15 and H1 timeframes, since most of our higher-timeframe areas begin with the H4. Stops are usually placed 1-3 pips beyond confirming structures.
EUR/USD
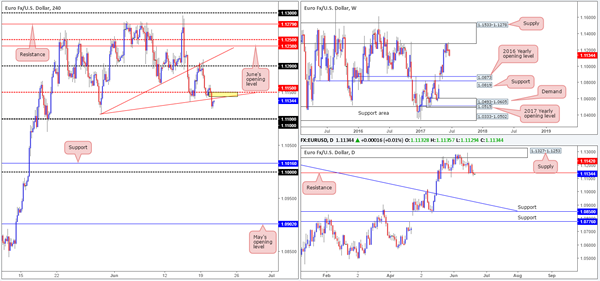
Kicking this morning's report off from the weekly timeframe, we can see that the sellers continue to reflect a strong bearish stance from the underside of a major supply at 1.1533-1.1278. Looking down to the daily chart, price recently crossed below support at 1.1142. Assuming that this barrier holds as resistance, the next downside target in view is the trendline support etched from the high 1.1616, followed closely by support at 1.0850.
Across on the H4 chart, the mid-level support at 1.1150 was recently taken out along with the trendline support drawn from the low 1.1109. Should the small yellow area (represents the daily resistance and the two said H4 resistances) hold firm, then it's likely that the single currency will test the 1.11 handle sometime today.
Our suggestions: In Tuesday's report, we mentioned that before shorts are considered, the 1.11 handle will need to be consumed. While we still believe this to be the more conservative route, our desk would also consider shorts from 1.1150/1.1142 (the yellow zone on the H4 chart) today, as long as there is some form of lower-timeframe confirming action present (see the top of this report).
Ultimately the first take-profit target would be 1.11. A break below here, and we could see the unit stretch down as far as the 1.10 region.
Data points to consider: No high-impacting events on the docket today.
Levels to watch/live orders:
- Buys: Flat (stop loss: N/A).
- Sells: 1.1150/1.1142 ([waiting for a lower-timeframe confirming signal to form is advised] stop loss: dependent on where one confirms the area).
GBP/USD
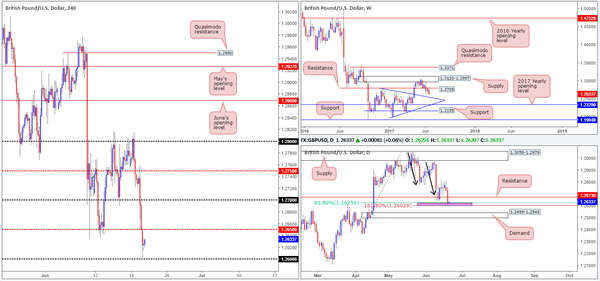
In response to Gov. Carney's speech yesterday, the GBP aggressively weakened and took out the 1.27 handle along with it. Following this, downside momentum continued to be seen and it was not until the US open did we see any sign of bullish intent.
Leaving the 1.26 handle unchallenged, the bulls managed to clock a high of 1.2636 by the closing bell. This move was also likely helped by the daily AB=CD (black arrows) 161.8% ext. completion point seen at 1.2602 drawn from the high 1.3047, and the 61.8% daily Fib support at 1.2625 taken from the low 1.2365.
Despite the above, weekly price shows room to extend down to a trendline support taken from the high 1.2774, which happens to intersect with daily demand seen below the two above said daily Fib levels at 1.2499-1.2543.
Our suggestions: Neither a long nor short seems attractive at the moment. On the one hand, weekly flow indicates lower prices may be on the cards, and on the other hand, the daily chart is trading from two closely converging Fib levels. Therefore, no matter which direction you take, you'll be trading against higher-timeframe flow! With that being the case, our team has decided to remain on the sidelines for the time being until we have more of a defined direction in this market.
Data points to consider: MPC member Haldane speaks at 12pm GMT+1.
Levels to watch/live orders:
- Buys: Flat (stop loss: N/A).
- Sells: Flat (stop loss: N/A).
AUD/USD
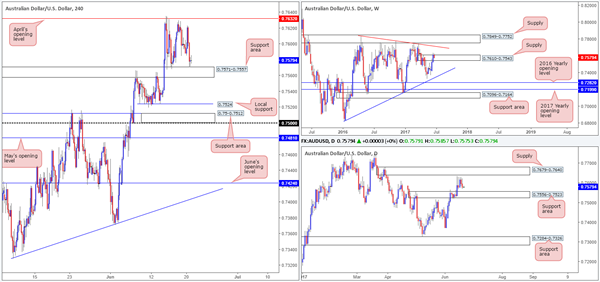
The AUD/USD, as you can see on the H4 chart, remains consolidating between April's opening level at 0.7632 and the support area coming in at 0.7571-0.7557. Of particular interest is April's opening level being sited just 8 pips below the lower edge of a daily supply at 0.7679-0.7640. Furthermore, a pip below the current H4 support area is a daily support area positioned at 0.7556-0.7523.
On the weekly timeframe, however, we can see that the unit marginally closed above supply at 0.7610-0.7543. As we mentioned in Monday's report, it may be worth waiting for this week's candle to close before presuming that the said weekly supply is consumed, since it could just as well be a fakeout.
Our suggestions: Right now, we're not only capped by the current H4 consolidation, we're also confined by the neighboring daily demand and supply mentioned above! To that end, we still stand by Tuesday's suggestion: an ideal scenario would be for H4 price to chalk up a bearish selling wick that whipsaws through 0.7632, connects with the daily supply and then closes back below 0.7632. This would, in our humble opinion, be enough evidence to validate a sell, with an initial target objective set at the said H4 support area.
Data points to consider: No high-impacting events on the docket today.
Levels to watch/live orders:
- Buys: Flat (stop loss: N/A).
- Sells: Look for H4 price to chalk up a bearish selling wick that whipsaws through 0.7632 and connects with daily supply (stop loss: ideally beyond the candle's wick).
USD/JPY
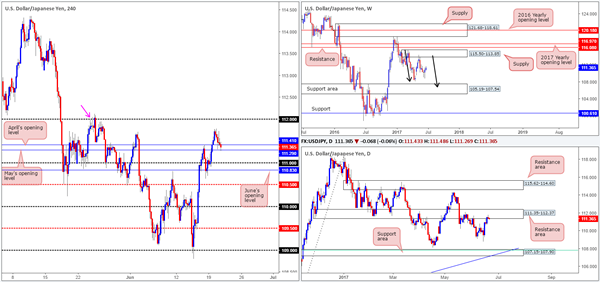
During the course of yesterday's sessions, the USD/JPY pair topped at 111.78 and pulled back to May/April's opening levels at 111.29/111.41.Although these two levels appear to be holding steady, there may be trouble lurking ahead. Over on the daily timeframe, see how price chalked up a selling wick around the underside of supply at 111.35-112.37. In addition to this, we still feel that weekly bears remain in a relatively strong position after pushing aggressively lower from supply registered at 115.50-113.85. We know there's a lot of ground to cover here, but this move could possibly result in further downside taking shape in the form of a weekly AB=CD correction (see black arrows) that terminates within a weekly support area marked at 105.19-107.54 (stretches all the way back to early 2014).
Our suggestions: Buying from 111.29/111.41 is a risky move, as far as we're concerned, since you'd be going up against potential weekly and daily sellers. Shorting this market below 111.29/111.41 is also difficult. Yes, we would have higher-timeframe flow on our side, but we'd be selling into the 111 handle, followed closely by June's opening level at 110.83.
Data points to consider: No high-impacting events on the docket today.
Levels to watch/live orders:
- Buys: Flat (stop loss: N/A).
- Sells: Flat (stop loss: N/A).
USD/CAD
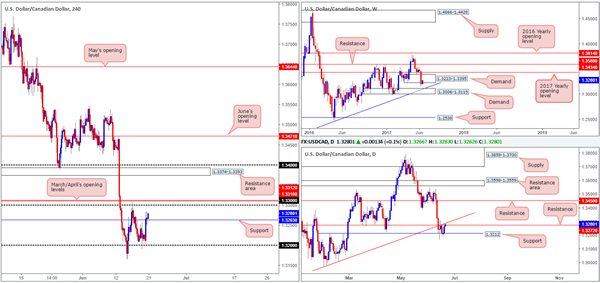
Monday's call to buy from 1.32 worked out beautifully, as expected. The move from this number recently lifted H4 price above resistance at 1.3263 and now looks poised to attack the 1.33 handle, shadowed closely by March/April's opening levels at 1.3312/1.3310. However, we do feel the bulls will likely struggle here since we're also dealing with daily resistance at 1.3272 and a daily trendline resistance etched from the low 1.2968. On a more positive note, nevertheless, weekly action is seen trading from within the walls of demand formed at 1.3223-1.3395, which could help the buyers penetrate the said daily levels.
Our suggestions: Despite weekly bulls standing in a relatively favorable position, entering long when we know that both the daily and H4 charts show resistance structures ahead is not something our desk would feel comfortable with. By the same token, selling is just as risky, in our opinion, as you'd be shorting into weekly demand! Therefore, unless you are still long from 1.32, we would advise remaining flat today.
Data points to consider: Crude oil inventories at 3.30pm GMT+1.
Levels to watch/live orders:
- Buys: Flat (Stop loss: N/A).
- Sells: Flat (Stop loss: N/A).
USD/CHF
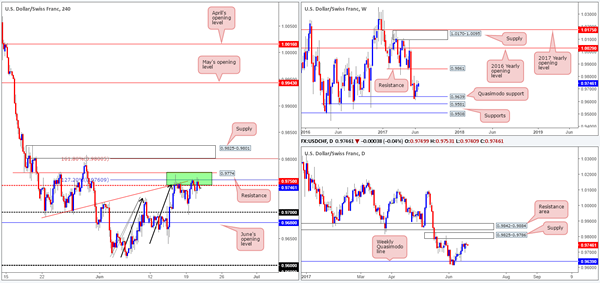
On Tuesday, the pair spent the day clinging to the green H4 area at 0.9774/0.9750. This zone is comprised of a H4 resistance level at 0.9774, a H4 AB=CD 127.2% ext. at 0.9760 taken from the low 0.9613, a H4 trendline resistance etched from the low 0.9691 and a H4 mid-level resistance drawn from 0.9750.
As we mentioned in our previous report, although the confluence surrounding the green zone is attractive, we have our eyeballs on the H4 supply seen overhead at 0.9825-0.9801. Apart from converging with a H4 AB=CD 161.8% ext. at 0.98 taken from the low 0.9613 and the round number 0.98, this area is also positioned around the upper edge of daily supply marked at 0.9825-0.9786.
Our suggestions: Should price strike the H4 supply area mentioned above at 0.9825-0.9801 today/this week, we would, dependent on the time of day, look to sell from here at market, with stops sited at 0.9827, targeting 0.9750 as an initial take-profit zone.
Data points to consider: No high-impacting events on the docket today.
Levels to watch/live orders:
- Buys: Flat (stop loss: N/A).
- Sells: 0.98 (stop loss: 0.9827).
DOW 30
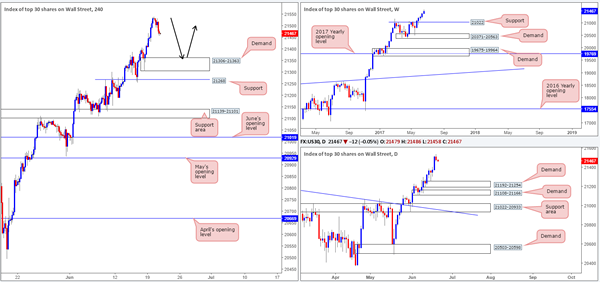
US equities pulled back from a fresh record high of 21541 yesterday, bringing H4 price to a low of 21465.Should the index continue to be sold, the next port of call will likely be the H4 demand base coming in at 21306-21363. For those who follow our analysis on a regular basis, you may recall that our desk is currently long from 21164. 50% of that position was quickly liquidated at 21234, with the remaining 50% left in the market to run since we intend on trailing this trend long term. The stop-loss order is currently positioned below the said H4 demand at 21298, as we believe this to be the safest area for the time being.
Our suggestions: Personally, we are looking for price to continue rallying before it reaches the aforementioned H4 demand. Should price challenge 21306-21363 this week, however, and is reinforced by a full or near-full-bodied bullish candle, we may look to add to our current position (as per the black arrows) and trail accordingly.
Data points to consider: No high-impacting events on the docket today.
Levels to watch/live orders:
- Buys: 21164 ([live] stop loss: 21298). 21306-21363 ([waiting for a reasonably sized H4 bull candle – preferably a full-bodied candle – to form before pulling the trigger is advised] stop loss: ideally beyond the candle's tail).
- Sells: Flat (stop loss: N/A).
GOLD
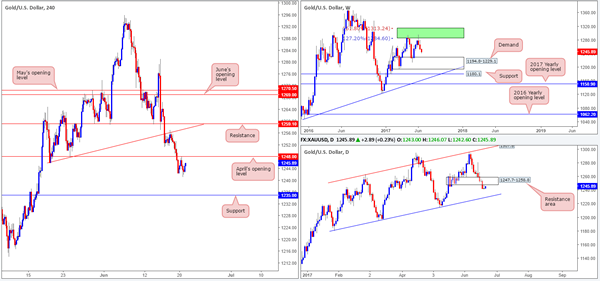
Early on in yesterday's US segment, the yellow metal retested April's opening level at 1248.0 as resistance. In Tuesday's report, we stated that should this level be tested and accompanied by a reasonably sized H4 bearish candle (preferable a full-bodied candle), then it'd be an ideal zone to sell from. H4 price did print a bearish candle from this line, but also slightly corrected before the candle closed, so we passed on the setup.
To our way of seeing things, it appears as though the H4 candles are going to retest April's level once again. Given that this line is bolstered by a daily resistance area formed at 1247.7-1258.8, and weekly price shows room to extend down to demand pegged at 1194.8-1229.1, this line still deserves attention.
Our suggestions: As such, a second retest of April's opening level at 1248.0 would, if it's accompanied by a reasonably sized H4 bearish candle (preferable a full-bodied candle), be an ideal zone to sell from, targeting the H4 support level at1235.0, followed closely by the top edge of weekly demand at 1229.1.
Levels to watch/live orders:
- Buys: Flat (stop loss: N/A).
- Sells: 1248.0 region ([waiting for a reasonably sized H4 bear candle – preferably a full-bodied candle – to form before pulling the trigger is advised] stop loss: ideally beyond the candle's wick).
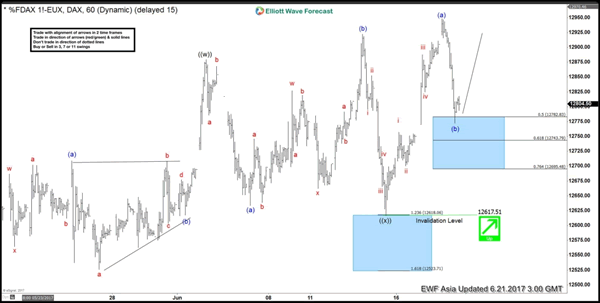
Elliott Wave View: DAX Bullish Against 12617
Short term DAX Elliott Wave view suggests the rally from 5/18 is unfolding as a double three Elliott Wave structure. Minute wave ((w)) ended at 12879.5 and Minute wave ((x)) pullback ended at 12617. Internal of Minute wave ((x)) subdivided as an expanded flat Elliott Wave structure where Minutte wave (a) ended at 12633.5, Minutte wave (b) ended at 12922.5 and Minutte wave (c) of ((x)) ended at 12617. DAX has broken above Minutte wave (b) on 6/14, adding conviction that the next leg higher has started. Up from 12617, the rally is unfolding as a zigzag Elliott Wave structure where Minutte wave (a) ended at 12948.5 and Minutte wave (b) is proposed complete at 12772.5. Near term, while pullbacks stay above 12772.5, and more importantly above 12617, expect Index to extend higher. We do not like selling the proposed pullback.
DAX 1 Hour Elliott Wave Chart
European Open Briefing: The US Dollar Extended Gains Overnight.
Global Markets:
- Asian stock markets: Nikkei down 0.45 %, Shanghai Composite gained 0.15 %, Hang Seng declined 0.60 %, ASX 200 lost 1.35 %
- Commodities: Gold at $1248 (+0.35 %), Silver at $16.50 (+0.50 %), WTI Oil at $43.45 (-0.15 %), Brent Oil at $45.90 (-0.25 %)
- Rates: US 10-year yield at 2.16, UK 10-year yield at 1.00, German 10-year yield at 0.26
News & Data
- Australia MI Leading Index 0.0 % vs -0.1 % previous
- PBoC Fixes USDCNY Reference Rate At 6.8193 (prev fix 6.8096 prev close 6.8295)
- Oil slump spooks investors; China stocks underwhelmed by MSCI – RTRS
- Oil holds near multi-month lows as glut fears persist – RTRS
Markets Update:
The US Dollar extended gains overnight. The decline in stock markets and oil prices triggered a risk-off sentiment in markets, which provided additional support for the USD. Risk currencies such as the Australian and New Zealand came under pressure overnight. AUD/USD fell from 0.7590 to 0.7560. Key support is seen at 0.7520. Should the pair break below it, a correction towards 0.74 seems likely.
The focus today will be on the RBNZ rate decision. No changes are expected, but traders are looking forward to the central bank's statement and whether it will maintain its slightly hawkish tone. The strong NZD could be a concern for the RBNZ though. NZD/USD rallied from 0.6820 to 0.73 in the past two months. Meanwhile, AUD/NZD fell from 1.09 to 1.04. This puts New Zealand's export industry under pressure.
The Pound fell sharply after dovish comments from Bank of England Governor Carney. He said that “now is not the right time” for a rate hike. GBP suffers now from lower rate expectations, as well as the political uncertainty in the UK. The short-term outlook remains negative and move towards 1.25 likely.
Upcoming Events:
- 15:00 BST – US Existing Home Sales
- 15:30 BST – US Crude Oil Inventories
- 22:00 BST – RBNZ Rate Decision
Crunch Time For EUR/AUD Support
Selling this EUR/AUD resistance zone gave day traders a short term bounce, but the bearish momentum was short lived and price subsequently rallied hard through the level.
Just from reading the online trading community's thoughts, I can see plenty of chatter around about buying these pullbacks and if this is your view, then this daily support level is key. It's certainly crunch time for the bulls.
EUR/AUD Daily:
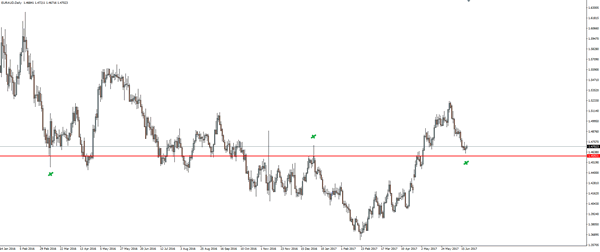
I've only included a single, hard line but as you can see when you look back to the left side of that chart, there is plenty of long wicks and chop here and there. That is just the price action nature of a forex cross such as EUR/AUD and highlights the risk management mentality that you have to have to trade these types of pairs successfully.
With this in mind, when a day trader zooms into an intraday chart, they still have to come up with a strict risk management plan which should involve the short term levels that have most recently been tested. These levels can't be zones like the higher time frame because we need a hard number to take entries or set stops around.
Oil Tanks As Price Slick Spreads
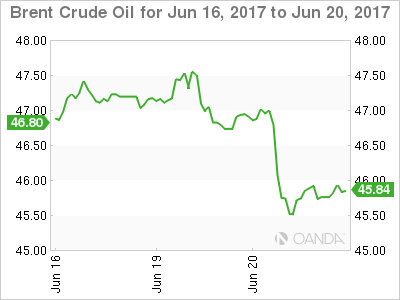
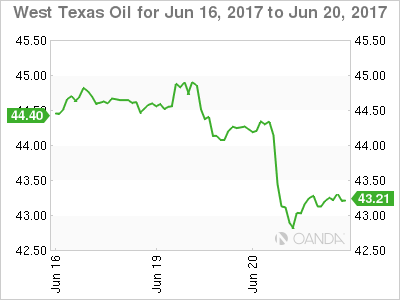
Oil gushed lower again overnight with both Brent and WTI taking out their early May panic liquidation lows and falling around 2 percent in the session.
This was despite OPEC/Non-OPEC's compliance being announced at 106 percent and the American Petroleum Institute's crude inventory draw coming in higher than expected at 2.72 million barrels. The inability of oil to stage even a modest dead cat bounce after these two data points must be a concern to producers although it may be that stop loss selling through the May lows overwhelmed both.
From a technical perspective, the picture continues to look ugly with the short end of the oil curve being overwhelmed by increased production from exempt Nigeria and Libya along with OPEC's perpetual migraine, U.S. shale. Producers will be looking with some trepidation now at the official U.S. EIA Crude Inventory Report where the street is forecasting a 2 million barrel drawdown in crude and a gain of 0.1 million in gasoline inventories. A positive increase on either almost certainly seeing an uncapped leak of crude prices lower.
Brent spot trades at 45.85 this morning with resistance at 46.60 and 47.65. Support lies in the 45.10/45.30 region with a break of this area implying the slick could spread to the November lows of 43.00.
WTI spot trades at 43.25 this morning with resistance at 44.00 and 45.00. Interim support lies at the overnight low of 42.70 with the November low at 42.00 clearly in traders crosshairs.
EM Asia FX Feeling The Pressure From Falling Oil Prices
Falling oil prices have dampened local market sentiment, and despite falling US yields overnight the USD remained solid outside of JPY motioning a market shift to risk aversion
When oil prices decline they have a negative pass through to regional currencies and with the greenback carving out gains against the broader G-10 landscape, local currencies should fall out of favour near-term
The MSCI inclusion of A-shares should provide a longer term boost to local markets, and the incision is structured such that there's a huge incentive for China to keep reforms on track so that the participation weights will broaden as more reforms get introduced. Long term this should provide capital inflow to the mainland and reduce pressure on the RMB complex. Reports t of sporadic currency interventions at yesterday's close on the CNY has helped Yuan sentiment, but strong dollar narrative continues to carry the day.
North Korea headlines are creating a risk ripple after South Korea's military said a drone found earlier this month on a mountain near the Demilitarized Zone border was confirmed to have been from North Korea and described it as a “grave provocation.” Also, the fallout from the Warmbier tragedy is more likely to gather pace as President Trump pulled few punches on his condemnation of North Korea.
The Ringgit continues to tarnish on the weaker oil price narrative and the hawkish Fed storyline.
Market Morning Briefing: Persistent Moderate Hawkish Stance By The Fed
STOCKS
Dow (21467.14, -0.29%) has tested a crucial long term resistance near 21500 which could possibly hold for the coming weeks. An upward extension if seen could take it to 21600, but this could form a near term top for now. A downward correction towards 21300 is possible in the near term.
Dax (12814.79, -0.58%) came off sharply from levels below 13000. Note that 13000 is a crucial medium term resistance and could possibly keep the index below 13000 for the coming sessions. But while the 13000 levels holds, we could see some movement in the 13000-12700 region.
Shanghai (3143.45, +0.11%) is almost stable while above 3120. Movement within 3120 and 3180 may continue for a few more sessions before the index starts to move up. For now the next couple of sessions could see a sideways consolidation.
Nikkei (20183.90, -0.23%) opened with a gap up and if it manages to break above 20300, it could move up sharply towards 20500-20600 levels.
Nifty (9657.55, +0.72%) was almost stable yesterday but looks potentially bullish for the near term while above 9600. A re-test of 9700-9710 is possible in the near term.
COMMODITIES
Muted price action had been seen in Gold (1247) as it remains in a slow corrective move which may take it to the support of 1230 but if the support holds, a quick bounce towards 1262 can’t be ruled out. Silver (16.49) is also moved lower in line with our expectation. A close above 16.50 could open up 16.95 levels within a couple of days. Both gold and silver are oversold in near term time frame.
Copper (2.55) is trading within the narrow range of 2.54-2.67. Only above 2.68, higher resistances of 2.84 can come into consideration, but a daily close below 2.55 could open up 2.45 and 2.35 levels as well. We wait for further directional clarity on a break on either side of 2.55 and 2.67 levels.
Nothing new to add as market is waiting for today’s U.S weekly crude inventory data (8:00 pm, IST) with an expectation of a shortage (-1.2 MB) in inventory. If the anticipation of -1.2 M Barrel of shortage will match the actual outcome then that could be beneficial for both Brent and WTI. Otherwise a surplus or a less than expected shortage could bring further bearish possibilities into consideration.As of now, Brent (45.95) and WTI (43.48) are trading below their respective supports of 46.68 and 44 with an immediate trading range of 43.50-46.70 for Brent and 38.72-44 WTI. If Brent and WTI manage to close above 47 and 44.50 in today’s post inventory session, another attempt for 49.62and 46.45 can be seen. As Brent and WTI are oversold in near term time frame, a shortage (either at per or more than the expectation) in US weekly crude oil inventory could activate short term buying momentum in the market.
FOREX
Persistent moderate hawkish stance by the Fed officials despite the recent soft US macro data keeps Dollar strong against all the majors.
In line with expectations, Dollar Index (97.72) has tested our resistance of 97.80 already and as long as it stays above 97.50, the rise may extend to 98.10-40 and then 99.00+
Euro (1.1135) has weakened from our resistance of 1.1215 and registered a fresh swing low at 1.1115 in the last session. A break below the support of 1.1100-1.1090 may increase the bearish momentum and in that case, Dollar Index may find it easier to climb above 98.00 levels.
Dollar-Yen (111.21) has hit a high at 111.78, close to our initial target of 112.00, before retreating for a normal correction. As long as the support of 110.60-50 holds, the uptrend remains intact and the targets of 112-113 remain unchanged.
Pound (1.2630) has met our downside target of 1.2600 in a single session following the continued concern of the BOE governor over the Brexit impact on the economy. The immediate downside may be limited to 1.2540 and a corrective bounce may emerge by the end of the week from either 1.2600 or 1.2550-40.
Aussie (0.7570) is testing our support of 0.7570-60 which may hold and push the currency back to 0.7625-50 levels.
Dollar-Rupee (64.50) may test the levels of 64.60-70 today and while the resistance of 64.70-75 is expected to hold, our view of continued "range trade" between 64.70-10 will be put to the test over the next couple of days.
INTEREST RATES
The US yields have dipped after rising sharply for the last 2-sessions. The 5Yr, 10YR and 30Yr are trading at 1.76%, 2.15% and 2.74% compared to previous levels of 1.79%, 2.19% and 2.79% respectively.
The US 10-5Yr (0.40%) yield spread is testing important support near current levels and could bounce back in the near term.
Lazy Days Of Summer – Not So
Lazy Days of Summer – Not so
Those lazy days of summer are about to turn into the hazy, crazy days of summer given the abundance of risk narratives that lie ahead. Risk aversion reared its ugly head on Tuesday as headline risk reminded us that of what lies ahead and what key drivers will influence our trading decisions in the months ahead.
At the centre of the debate lies the Fed policy. It’s abundantly clear from the deluge of Fed speaks that the FOMC are preparing the field to move the goalposts. While the Fed message is clear, the market’s air of apprehension is thick as the recent run of US economic data does not entirely support the Fed’s current tack.
Another layer of complexity to the inflation narrative, oil prices have officially entered a bear market as Oils plummeted 2 % after reports of rising output from Nigeria Libya, both OPEC members exempt from the production cut deal, made headlines. Traders are showing little fear of from an ineffectual OPEC, and with inventory levels adding to the bearish sentiment, the markets look headed for a test of $40.00 WTI
The far-reaching effect of the Oil slide was felt on US equity market as the Dow slipped from record highs weighted down by energy stocks. The Tech-laden NASDAQ also laggard suggesting market jitters are setting on over tax reform. It’s clear the Republicans are trying to the right the fiscal reform ship, but with so many issues to be ironed out (raising the debt ceiling for one), it remains a close call whether the changes will pass.
On the US special election front, in Georgia Democrat Jon Ossoff or Republican Karen Handel are hoping to succeed the seat vacated by health secretary Tom Price. Thi runs off will be viewed as a major sentiment driver for the Trump presidency.
China MSCI inclusion
The door is finally open and China’s locally-traded A shares will comprise just 0.7 percent of MSCI’s global emerging-markets gauge, with 222 companies added and the weighting will increase over time as China adds further market reforms. The MSCI inclusion bodes well over the long term if the Mainland regulators move forward with Yaun internationalisation and regulatory reform. But investors are still cautious knowing the Pboc, and Financial Regulators continue to change the rules of engagement, so caution will likely persist.
The CNH has rallied this morning on the anticipation of increased capital inflows.
The Pound
It was a cruel overnight session for Sterling bulls after Carney quashed any hope for a rate hike. There was some optimism for the GBP after the hawkish surprise of three MPC members voting for a BoE rate hike last week, but all that has faded. And with DUP talks faltering the pound was utterly helpless as traders knocked it lower until some semblance of support emerged around 1.2600.
Japanese Yen
The yen is on the move in early trade as the risk complex wobbles on sliding oil prices but remains relatively resilient despite the abundance of risk aversion hitting the markets. The pair remains tentatively supported on dips feeding off the hawkish Fed hike from last week, but risk aversion continues to ripple
USD/CAD Canadian Dollar Lower After Oil Falls Ahead Of Inventories
The Canadian dollar is falling versus the US dollar on Tuesday following the fall in crude prices and hawkish Fedspeak. The loonie has slipped against the greenback as crude is touching 7 month lows after oversupply concerns as Organization of the Petroleum Exporting Countries (OPEC) members Libya and Nigeria are back to full output after sorting several disruptions.
Central banks appear to have retaken the steering wheel in June. The Bank of Canada (BoC) surprised markets with hawkish comments from its Deputy Governor Carolyn Wilkins that were later followed up by Governor Stephen Poloz putting a rate hike firmly on the table. The timing was not discussed but as other central banks are getting ready to engage in major monetary policy shifts this year the BoC has issued rhetoric to say it is sticking with the pack.
The CAD appreciated after the comments from Canadian policy makers even in a week that featured the second interest rate hike by the U.S. Federal Reserve in 2017 and a weaker outlook on oil prices. The mood this week has changed slightly as Fed speakers have for the most part supported the decision of the Federal Open Market Committee (FOMC) and keep forecasting sustained growth that would validate 1 or 2 more rate hikes with the possibility of a reduction of the US central bank’s massive balance sheet.
The fall in oil prices has also sapped the momentum of the Canadian currency as despite the best efforts of the government and the central bank the economy is still heavily dependant on natural resources.
The Fed is most likely to hike at its September or December FOMC meetings. Markets are now pricing in a move by the BoC in October, which conveniently falls in between. If the Fed refrains from raising its benchmark rate in September, the end of the year becomes a huge possibility. Stephen Poloz has shown he prefers to be proactive and might try to anticipate a move by the Fed and the European Central Bank (ECB) that is also expected to either being tapering its QE program or raise rates, or both before the end of the year.
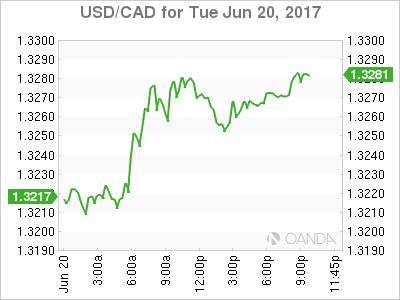
The USD/CAD gained 0.346 percent in the last 24 hours. The currency pair is trading at 1.3266 after falling oil prices and hawkish rhetoric kept the USD higher against the Canadian currency. Central bank moves have shifted once again the pricing of the USD/CAD pair. The Fed is now expected to hike in September or December. The CME FedWatch tool is giving the September FOMC meeting a 14 percent probability, while December enjoys a 50 percent chance based on Fed funds future prices.
The biggest risk for the CAD and the economy before the end of the year is the renegotiation of NAFTA. Earlier today agriculture ministers from the three partner nations said that there are few differences over trade but the combative tone from the Trump administration ahead of the start of negotiations. The BoC is sure to get a feel for how the talks shape up when they start in late August. Mexican officials have said that the conversations should not go beyond December.
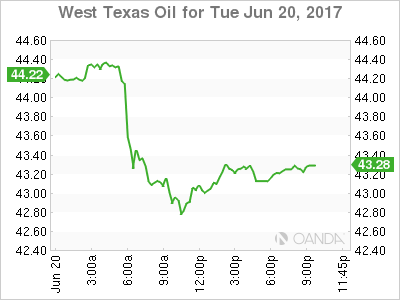
Oil fell 1.876 on Tuesday. The price of West Texas Intermediate is trading at $43.26 on fears of oversupply now that Libya and Nigeria have sorted their local disruptions to production. Both nations are exempt from the OPEC production cut agreement given their fragile infrastructure and political climate.
Oil got a boost late in the day when the American Petroleum Institute released its weekly inventories showing a 2.7 million barrel drawdown in crude stocks and a 300,000 barrels buildup in gasoline. The drawdown of crude stocks was higher than expected, while the gasoline inventories increased by less than expected. The move in oil prices will be confirmed once the Energy Information Administration (EIA) released the official weekly US crude inventories on Wednesday, at 10:30 am EDT.
Market events to watch this week:
Tuesday, June 20
2:30 am CHF SNB Chairman Jordan Speaks
4:45 am CHF SNB Chairman Jordan Speaks
Wednesday, June 21
10:30 am USD Crude Oil Inventories
4:00 pm NZD RBNZ Rate Statement
5:00 pm NZD Official Cash Rate
Thursday, June 22
8:30 am CAD Core Retail Sales m/m
8:30 am USD Unemployment Claims
Friday, June 23
8:30 am CAD CPI m/m
Gold Stabilizes After Week Starts With Losses
Gold is showing little movement in the Tuesday session, after falling 0.87% on Monday. In North American trade, spot gold trading at $1243.60 per ounce. On the release front, the current account deficit increased to $117 billion, but this beat the forecast of $124 billion. On Wednesday, the US will release Existing Home Sales and Crude Oil Inventories.
Is the US headed for another weak disappointing quarter? Last week ended on a disappointing note, as construction and consumer confidence reports missed expectations. Building Permits dropped to 1.17 million, its lowest level since August 2016. Housing Starts were also week, as the reading of 1.09 million marked the lowest since November 2016. There is concern that the soft construction numbers could weigh on second-quarter GDP. There was more bad news from UoM Consumer Sentiment, which dipped to 94.7 in May, marking a 7-month low. This is significant, as it is the indicator's lowest reading since President Trump took office, and points to consumer unease with how the US economy is being handled. There are troubling signs that the June UoM report could be even lower, coming after the Comey testimony which has damaged Trump's credibility even further. The labor market remains strong, but this has not translated into stronger consumer spending, which accounts for some two-thirds of economic growth.
As expected, the Federal Reserve raised rates last week, the second increase this year. What surprised the markets was not the rate move, but rather the upbeat tone of the rate statement. Fed policymakers noted that the labor market remained strong, and dismissed weak inflation levels as being temporary. On Monday, Federal Reserve of New York President Charles Dudley continued the upbeat message, cautioning the Fed against halting its current tightening cycle. Dudley said that the tight labor market should lead to higher wages, which in turn would push inflation to the Fed's target of 2.0%. Gold is closely linked to interest rate movement, and dropped considerably after Dudley's statement. If the Fed continues to send out a hawkish message, the odds of a rate hike in December (or even in September) are likely to increase, which could spell trouble for gold prices.