Sample Category Title
SECO Cuts Switzerland’s Economic Growth Forecast For 2017
For the 24 hours to 23:00 GMT, the USD declined 0.07% against the CHF and closed at 0.9748.
Yesterday, the State Secretariat for Economic Affairs (SECO), in its quarterly economic forecasts report, trimmed Switzerland's 2017 growth outlook by 0.2% to 1.4%, citing subdued inflation in the nation. Meanwhile, projection for 2018 was retained at 1.9%.
In the Asian session, at GMT0300, the pair is trading at 0.9744, with the USD trading a tad lower against the CHF from yesterday's close.
The pair is expected to find support at 0.9725, and a fall through could take it to the next support level of 0.9705. The pair is expected to find its first resistance at 0.9765, and a rise through could take it to the next resistance level of 0.9785.
Investors look forward to the Swiss National Bank's quarterly bulletin report, scheduled to release later in the day.
The currency pair is showing convergence with its 20 Hr and 50 Hr moving averages.

Loonie Trading Marginally Lower This Morning
For the 24 hours to 23:00 GMT, the USD rose 0.35% against the CAD and closed at 1.3271.
In economic news, Canada's wholesale sales advanced above expectations by 1.0% on a monthly basis in April, following a revised 1.2% rise in the previous month.
In the Asian session, at GMT0300, the pair is trading at 1.3278, with the USD trading a tad higher against the CAD from yesterday's close.
The pair is expected to find support at 1.3226, and a fall through could take it to the next support level of 1.3175. The pair is expected to find its first resistance at 1.3307, and a rise through could take it to the next resistance level of 1.3337.
The currency pair is trading above its 20 Hr and 50 Hr moving averages.

USD/CAD Daily Outlook
Daily Pivots: (S1) 1.3218; (P) 1.3252; (R1) 1.3300; More....
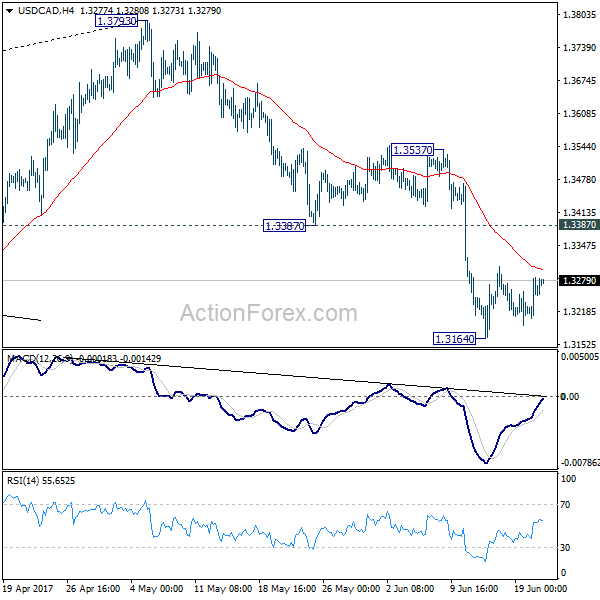
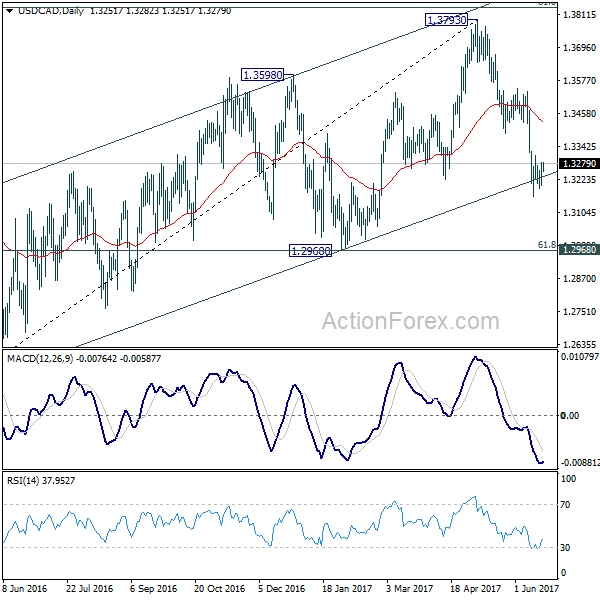
Intraday bias in USD/CAD remains neutral as consolidation from 1.3164 continues. Another recovery could be seen. But upside should be limited by 1.3387 support turned resistance and bring fall resumption. We're holding on to the view that corrective rise from 1.2460 has completed at 1.3793 already. Below 1.3164 will target 1.2968 cluster support, 61.8% retracement of 1.2460 to 1.3793 at 1.2969.
In the bigger picture, price actions from 1.4689 medium term top are seen as a correction pattern. The first leg has completed at 1.2460. Rise from 1.2460 is seen as the second leg and has completed at 1.3793, ahead of 61.8% retracement of 1.4689 to 1.2460 at 1.3838. Break of 1.3222 should now indicate the start of the third leg while further break of 1.2968 should confirm. In that case, USD/CAD should decline through 1.2460 support to 50% retracement of 0.9406 to 1.4869 at 1.2048.
AUD/USD Daily Outlook
Daily Pivots: (S1) 0.7558; (P) 0.7591; (R1) 0.7611; More....
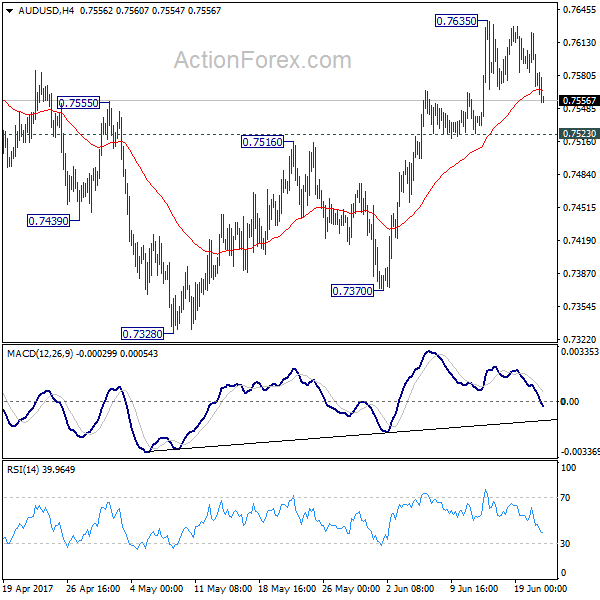
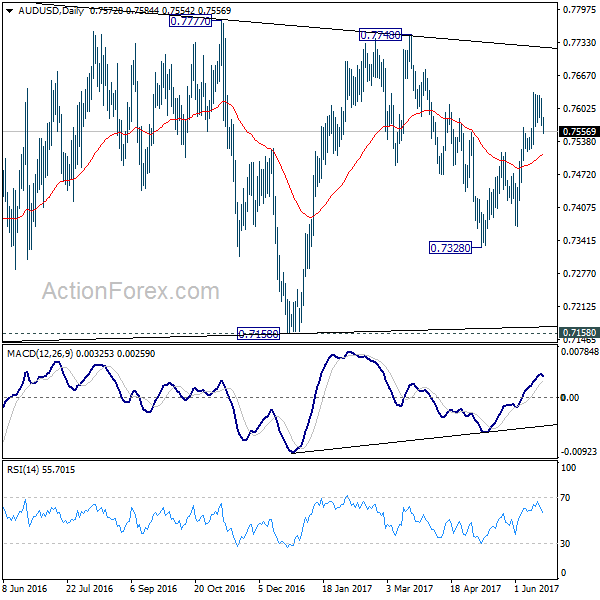
Intraday bias in AUD/USD remains neutral for consolidation below 0.7635 temporary top. As long as 0.7523 support holds, further rise is expected. Above 0.7635 will turn bias to the upside for 0.7748 resistance and above. At this point, there is no clear sign of range breakout at. Hence, we'd be cautious on topping again as it approaches medium term fibonacci level at 0.7849. Meanwhile, break of 0.7523 will argue that rebound from 0.7328 is possibly completed. In that case, intraday bias will be turned back to the downside for 0.7370 support.
In the bigger picture, we're still treating price actions from 0.6826 low as a corrective pattern. And, as long as 38.2% retracement of 0.9504 to 0.6826 at 0.7849 holds, long term down trend from 1.1079 is expected to resume sooner or later. Break of 0.6826 low will target 0.6008 key support level. However, firm break of 0.7849 will indicate that rise from 0.6826 is developing into a medium term rebound, rather than a sideway pattern. In such case, stronger rise should be seen to 55 month EMA (now at 0.8116) and above.
USD/CHF Daily Outlook
Daily Pivots: (S1) 0.9727; (P) 0.9747; (R1) 0.9768; More.....
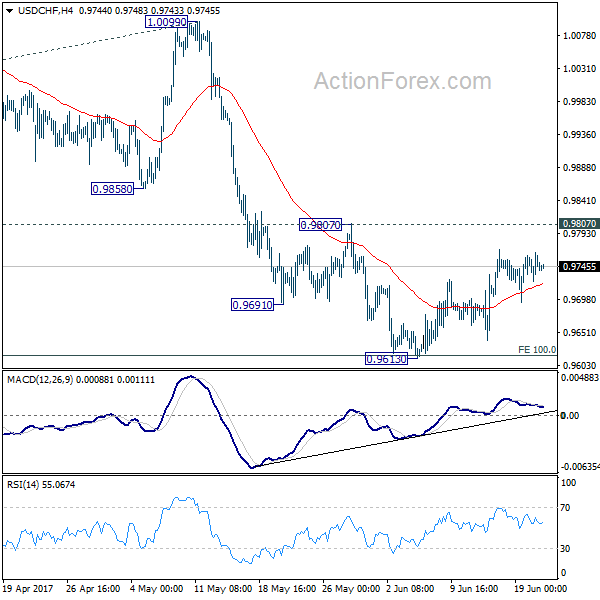
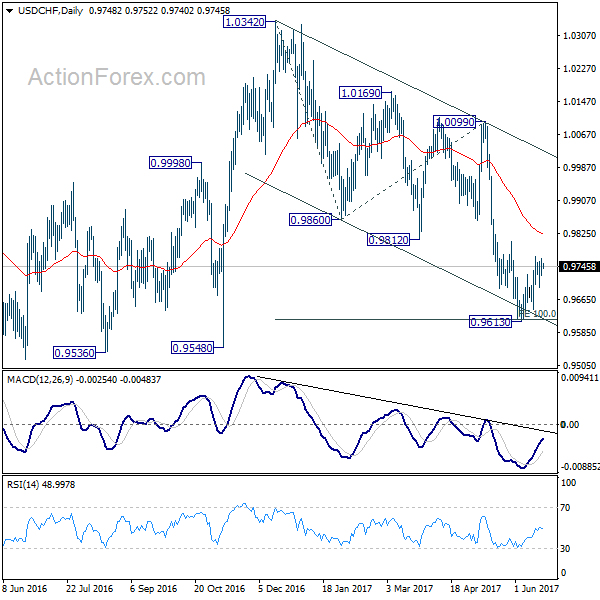
No change in USD/CHF's outlook as it's staying in consolidation above 0.9613. Intraday bias remains neutral at this point. As long as 0.9807 resistance holds, near term outlook remains bearish and deeper fall is expected. Below 0.9613 will extend the whole decline from 1.0342 to 0.9548 support and below. We'd start to look for bottoming signal again as it approaches 0.9443 key support level. However, considering bullish convergence condition in 4 hour MACD, break of 0.9807 will indicate near term reversal and turn outlook bullish for 1.0099 resistance next.
In the bigger picture, USD/CHF is still bounded in medium term range of 0.9443/1.0342 for the moment. Consolidative trading would likely continue and medium term outlook remains neutral. Break of 1.0342 key resistance is needed to confirm underlying bullish momentum in the pair. Meanwhile, downside attempts should be contained by 0.9443 key support level. However, sustained break of 0.9443 will carry larger bearish implication and target 0.9 handle.
USD/JPY Daily Outlook
Daily Pivots: (S1) 111.24; (P) 111.51; (R1) 111.72; More...
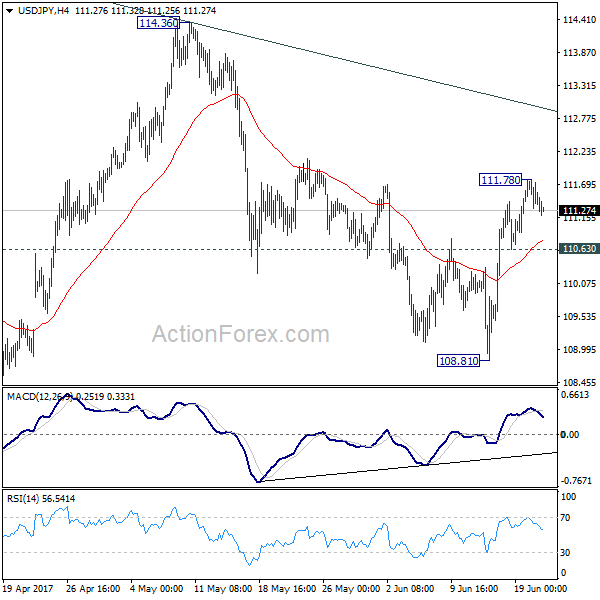
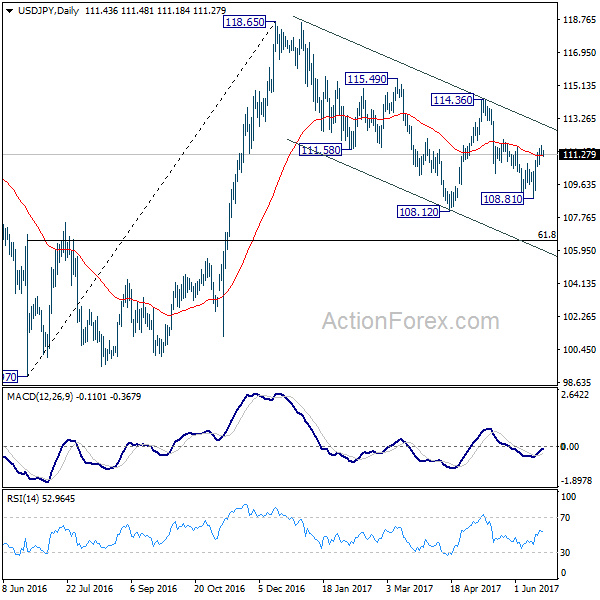
USD/JPY lost momentum after hitting 111.78 and intraday bias is turned neutral first. Further rise is expected long as 110.63 minor support holds. Above 111.78 will target near term channel resistance (now at 113.02). Sustained break there will suggest that whole pull back from 118.65 has completed at 108.12 already. In such case, further rise should be seen to 114.36 resistance for confirmation. However, break of 110.63 will turn bias back to the downside for 108.81 instead.
In the bigger picture, price actions from 125.85 high are seen as a corrective pattern. It's uncertain whether it's completed yet. But in case of another fall, downside should be contained by 61.8% retracement of 75.56 to 125.85 at 94.77 to bring rebound. Overall, rise from 75.56 is still expected to resume later after the correction from 125.85 completes.
EUR/USD Daily Outlook
Daily Pivots: (S1) 1.1113; (P) 1.1138 (R1) 1.1159; More....
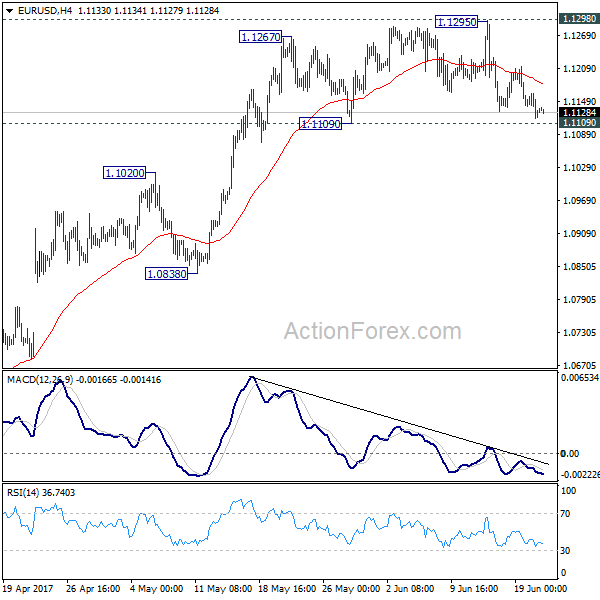
EUR/USD's fall from 1.1295 extended lower but it's still staying above 1.1109 support. Intraday bias remains neutral with focus on 1.1298 key resistance. Decisive break there will carry larger bullish implication and target 1.1615 resistance next. On the downside, break of 1.1109 support will indicate short term topping and rejection from 1.1298. In such case, intraday bias will be turned to the downside for 1.0838 support.
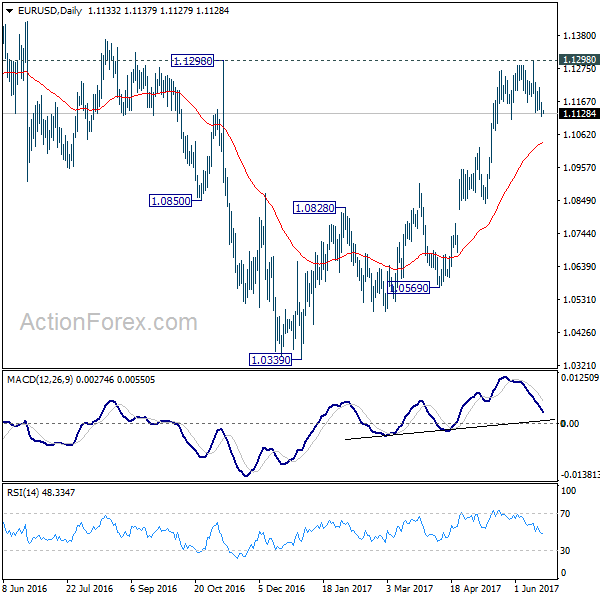
In the bigger picture, the case for medium term reversal continues to build up with EUR/USD staying far above 55 week EMA (now at 1.0932). Also, bullish convergence condition is seen in weekly MACD. Focus will now be on 1.1298 key resistance. Rejection from there will maintain medium term bearishness and would extend the whole down trend from 1.6039 (2008 high). However, firm break of 1.1298 will indicate reversal. In such case, further rally would be seen back to 1.2042 support turned resistance next.
GBP/USD Daily Outlook
Daily Pivots: (S1) 1.2565; (P) 1.2661; (R1) 1.2721; More...
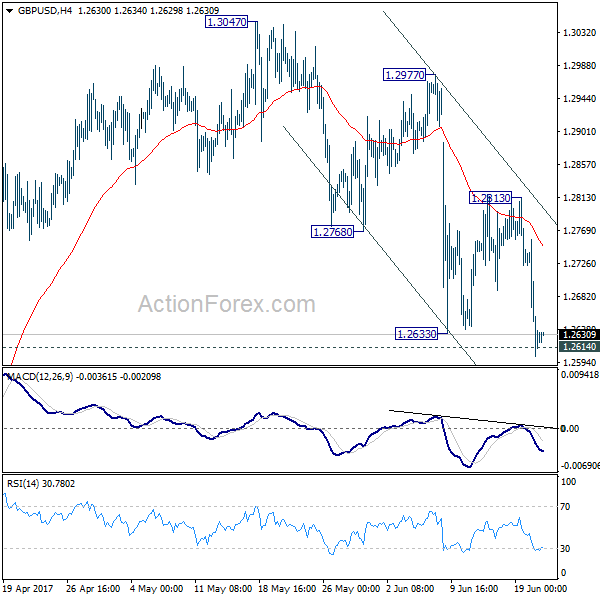
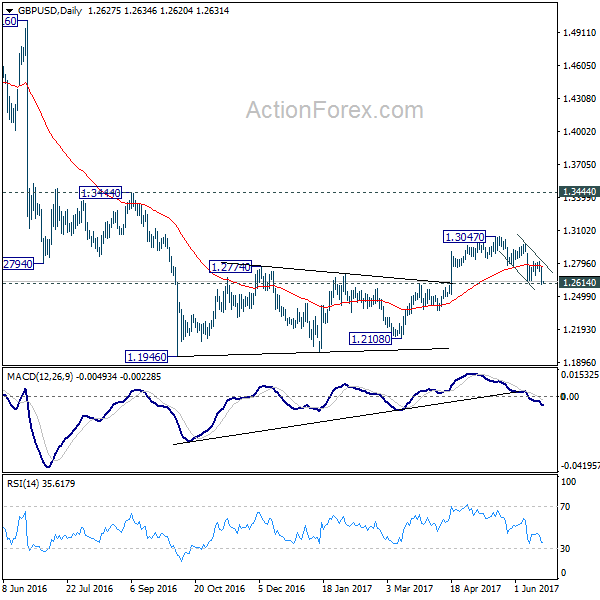
GBP/USD's decline and break of 1.2633 support indicates resumption of fall from 1.3047. Intraday bias is back on the downside for deeper decline. As noted before, we're still favoring the bearish case that consolidation pattern from 1.1946 has completed at 1.3047 already. Sustained break of 1.2614 resistance turned support should confirm our bearish view and target a test on 1.1946 low next. However, break of 1.2813 resistance will dampen our view and turn bias back to the upside for 1.3047 and above.
In the bigger picture, fall from 1.7190 is seen as part of the down trend from 2.1161. Price actions from 1.1946 medium term low are seen as a consolidation pattern, which could have completed after hitting 55 week EMA. Break of 1.1946 low will target 61.8% projection of 1.5016 to 1.1946 from 1.3047 at 1.1150 next. In case the consolidation from 1.1946 extends, outlook will stay remain bearish as long as 1.3444 resistance holds.
Dollar Recovers But Strength Limited by Falling Yield, Sterling Weighed Down by Political Uncertainties
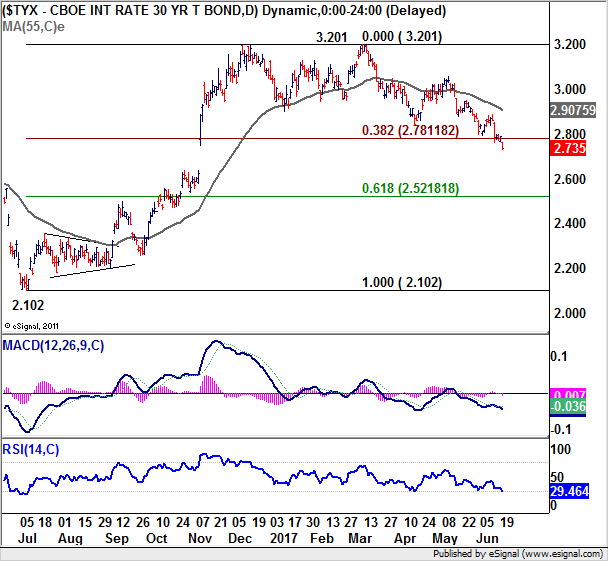
Dollar trades broadly higher this week so far, but strength is limited by weakness in treasury yields and risk aversion. WTI crude oil dropped as low as 42.75 yesterday before recovering mildly to 43.5. DOW and S&P 500 retreated after hitting records highs on Monday and closed lower by -0.29% and -0.67% respectively. Nikkei followed and is trading down -0.48% at the time of writing. Notable weakness is seen in 30 year yield while extends this year's decline and lost -0.053 to close at 2.735. 10 year yield also closed lower by -0.037 but stays above last week's low at 2.103 so far. In other markets, Gold remains weak and struggles to regain 1250 after dipping to 1242.4.
Known dove Chicago Fed President Charles Evans said that the decisions on monetary policies is "much more challenging from here on out". He pointed to latest weak inflation data and said they "make me a little nervous". Evans said that Fed can "go until December and make a judgement that maybe three is the right number or maybe two is the right number". That is, the comments made it further clearer that Evans prefers Fed to pause hiking interest rates for now and don't move in September. Currently, fed fund futures are only pricing in 13.1% chance of another hike in September, comparing to 28.8% pricing last week.
30 year yield lost hold of 38.2% retracement of 2.102 to 3.201 at 2.781 overnight and closed down at 3.735. Note that the TYX was rejected from key clear resistance at 3.255 twice. And the depth of decline now suggests that TYX is heading back to 61.8% retracement at 2.52 and possibly below. 10 year yield is kept well below 2.229 resistance and is vulnerable for another fall to 2.0 handle. While dollar index breached 97.77 resistance, the development warrants no trend reversal yet. Overall, while Dollar has stabilized, more is needed to prove that its trend is reversing.
Sterling pressured further by political uncertianties
Sterling continues to trade as the weakest major currency for the week. The selloff was triggered by comments from BoE Governor Mark Carney that it's not the time for rate hike yet despite some calls for it in the MPC. The Pound was also also pressured by domestic political uncertainties. Prime Minister Theresa is forming a coalition with North Ireland's Democratic Unionist Party after her Conservatives lost majority in the House of Commons. However, it's reported that DUP believed conservatives cannot take the partnership for granted. And so far, no deal was reached between the parties after 10 days of talks. Meanwhile, more than 50 Labour politicians signed a joint statement to "stop the Tories in their tracks" over hard Brexit.
ECB Cœuré favors moving Euro clearing back
ECB executive board member Benoît Cœuré argued that it's better for Euro clearing to move from London to EU after Brexit. Cœuré said in an interview that "we need to ensure that we can preserve a framework that ensures the safety and stability of the financial system when the UK is no longer a member of the EU." And, "in this regard, we think the European Commission proposals to amend [the rules] are a step in the right direction." On the other hand, BoE Governor Mark Carney said that moving the EUR 900b a day clearing from London is in "no one's economic interest". Carney argue that would "reduce the benefits of central clearing" and "any development which prevented EU27 firms from continuing to clear trades in the UK would split liquidity between a less liquid onshore market for EU firms and a more liquid offshore market for everyone else."
BoJ minutes: Members comfortable with fluctation in bond purcahses
The minutes of BoJ's April meeting showed that policy makers were comfortable with the fluctuation in JGB purchases. The minutes noted that "members reaffirmed their view that debt purchases will fluctuate within a range depending on market conditions and agreed this poses no problems to the BOJ's guidance for market operations." This came into question as BoJ recently slowed down the bong purchases. And with the current pace, the total annual increase could be projected as JPY 60T, instead of JPY 80T as the central noted in its communications. Nonetheless, it's been clear that BoJ changed its approach last year to the so called Yield Curve Control framework. That is, the central bank is targeting to keep long term yield at zero, instead of a figure of asset purchase.
On the data front
Australia Westpac leading index rose 0.0% mom in May. Japan all industry index rose 2.1% mom in April. UK will release public sector borrowing in European session. US will release existing home sales later in the day.
GBP/USD Daily Outlook
Daily Pivots: (S1) 1.2565; (P) 1.2661; (R1) 1.2721; More...
GBP/USD's decline and break of 1.2633 support indicates resumption of fall from 1.3047. Intraday bias is back on the downside for deeper decline. As noted before, we're still favoring the bearish case that consolidation pattern from 1.1946 has completed at 1.3047 already. Sustained break of 1.2614 resistance turned support should confirm our bearish view and target a test on 1.1946 low next. However, break of 1.2813 resistance will dampen our view and turn bias back to the upside for 1.3047 and above.
In the bigger picture, fall from 1.7190 is seen as part of the down trend from 2.1161. Price actions from 1.1946 medium term low are seen as a consolidation pattern, which could have completed after hitting 55 week EMA. Break of 1.1946 low will target 61.8% projection of 1.5016 to 1.1946 from 1.3047 at 1.1150 next. In case the consolidation from 1.1946 extends, outlook will stay remain bearish as long as 1.3444 resistance holds.
Economic Indicators Update
| GMT | Ccy | Events | Actual | Forecast | Previous | Revised |
|---|---|---|---|---|---|---|
| 23:50 | JPY | BOJ Minutes April Meeting | ||||
| 0:30 | AUD | Westpac Leading Index M/M May | 0.00% | -0.10% | ||
| 4:30 | JPY | All Industry Activity Index M/M Apr | 1.60% | -0.60% | ||
| 8:30 | GBP | Public Sector Net Borrowing (GBP) May | 7.3B | 9.6B | ||
| 14:00 | USD | Existing Home Sales May | 5.54M | 5.57M | ||
| 14:30 | USD | Crude Oil Inventories | -1.7M | |||
| 21:00 | NZD | RBNZ Rate Decision | 1.75% | 1.75% |
Daily Technical Analysis: EUR/USD Prepares For Bearish Break, Pullback And Continuation Pattern
Currency pair EUR/USD
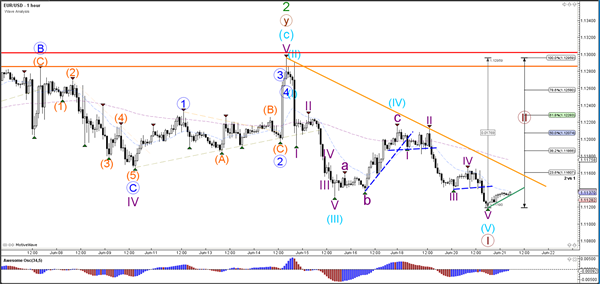
The EUR/USD broke below the long-term support trend line (dotted blue) but it will need to break below 1.11 before a potential wave 3 becomes likely. At this point a break, pullback and continuation seems the most probable via a wave 1 and 2 (brown).
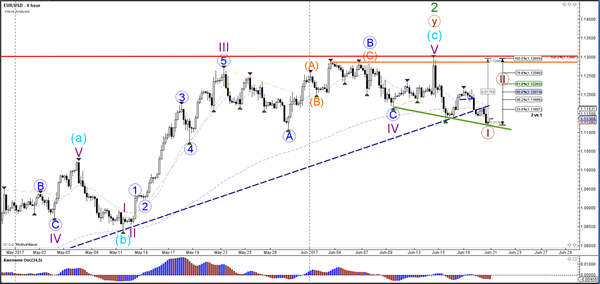
The EUR/USD is showing divergence between the bottoms which could cause a wave 2 (brown) retracement. Price invalidates wave 2 (brown) if price manages to break above the 100% Fibonacci level. A break below support (green) could indicate a continuation of the bearish trend.
Currency pair USD/JPY
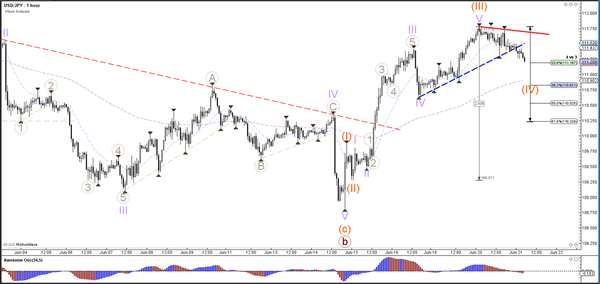
The USD/JPY continued with the bullish momentum (orange 3) within wave C (brown) yesterday. Price is now building a potential pullback within wave 4 (orange) which could find support (green) at the previous bottom and tops.
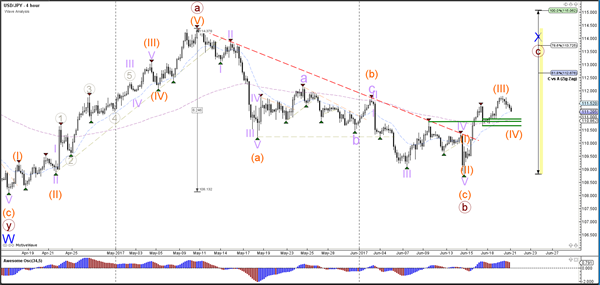
The USD/JPY could also see potential support from the Fibonacci levels of wave 4 (orange).
Currency pair GBP/USD
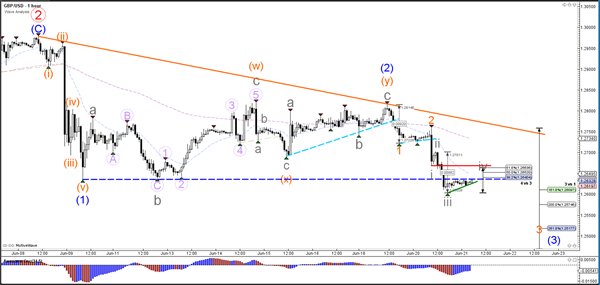
The GBP/USD bearish breakout below support (dotted blue) has been short lived so far. A continuation below 1.26 could see a further bearish extension towards the Fib targets of wave 3 (blue).
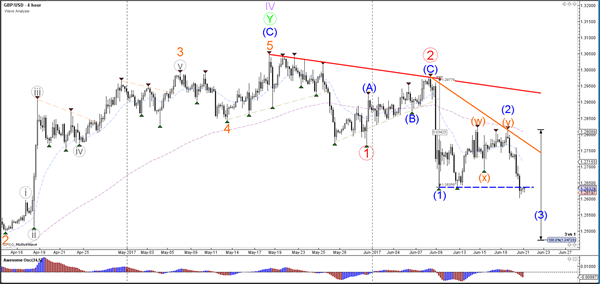
The GBP/USD is in a potential wave 4 (grey) which is invalidated if price manages to break above the bottom of wave 1 (grey) indicated by the resistance trend line (red). A break below support (green) could see the continuation of wave 3 (orange).